ASX Leading stocks

Viewing 6 posts - 1 through 6 (of 6 total)

  • Author
    Posts
  • #215942 quote
    ChamberskobChamberskob
    Participant
    New

    Hi,

    Would anyone be able to help me create a screener that identifies the leading/trending stocks for the ASX. Ideally I want to be able to narrow my search down for the top positive trending stocks on a daily time frame that are liquid and showing relative strength .

    I think the following variables may be  appropriate but open to suggestions…..

    Top performing positive price action for the 10 days
    relative strength to ASX
    Mcap >10m
    Min daily capital >50k

    Cheers any comment welcomed!

    #215946 quote
    JSJS
    Participant
    Master
    Hi,

    Take a look at this screener…

    The RSI is mainly used as an “overbought” (>70) and “oversold” (<20) indicator…

    One approximation to the market cap is: Average volume * close

    I assume you are meaning with “minus daily capital” that the average volume is above 50k?

    C1=RSI[10](Close)>60
    C2=Average[10](Volume)*Close>10000000
    c3=Average[10](Volume)>50000
    Screener[C1 and C2 and C3](C1 as "RSI>60")
    

    Scherm­afbeelding-2023-06-10-om-10.06.20.png Scherm­afbeelding-2023-06-10-om-10.06.20.png
    #215965 quote
    ChamberskobChamberskob
    Participant
    New
    Thanks JS! Ill have a play around with it for a while – might have some follow up Q’s down the track if thats ok. Appreciate your time sir.
    JS thanked this post
    #216593 quote
    ChamberskobChamberskob
    Participant
    New
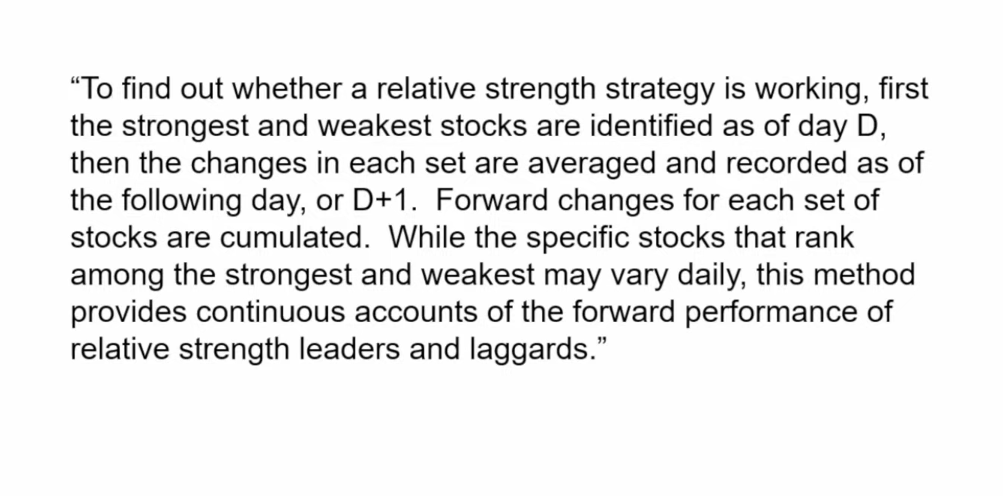
    Hi JS, Sorry to bother you again would you have any idea if I could do this (attached) with PRT? Or is there another way to track the spread between a basket of laggers and a basket of leaders? Cheers
    laggers-leaders-formula.png laggers-leaders-formula.png
    #216596 quote
    JSJS
    Participant
    Master

    No bother at all, I always learn the most from it myself… 😉

    I don’t think it’s possible to average groups of winners and groups of losers, but what you could do:

    1. Focus on winners
    2. Set a condition for yourself that the winners must meet, for example: the RSI (of the winners) must rise between 30 and 70 for 10 days long.
    TimeFrame(Daily)
    myRSI=RSI[10](Close)
    C1=myRSI>30 and myRSI<70
    C2=Summation[10](myRSI>myRSI[1])=10 //Ten days rising between 30 and 70
    Screener[C1 and C2]
    
    Chamberskob thanked this post
    #216604 quote
    ChamberskobChamberskob
    Participant
    New
    Ok thanks again JS!  Ill run that. So There is no way of basketing a group of leaders and a groups of laggers and spreading them against each other…..pretty sure I might be able to do this if I API data to excel from my broker.
Viewing 6 posts - 1 through 6 (of 6 total)
  • You must be logged in to reply to this topic.

ProRealAI ProRealAI New

Stuck on this ProBuilder code?

Describe what this topic is trying to build, in plain English, and ProRealAI writes the ProRealTime™ indicator, screener or system for you.

Available in 7 languages
Try ProRealAI

ASX Leading stocks


ProScreener: Market Scanners & Detection

New Reply
Author
Summary

This topic contains 5 replies,
has 2 voices, and was last updated by ChamberskobChamberskob
3 years, 3 months ago.

Topic Details
Forum: ProScreener: Market Scanners & Detection
Language: English
Started: 06/09/2023
Status: Active
Attachments: 2 files
ProRealCode ProRealCode
Loading...