Am I right, wrong or just thinking of it all wrong?
All attached images relate to the same System
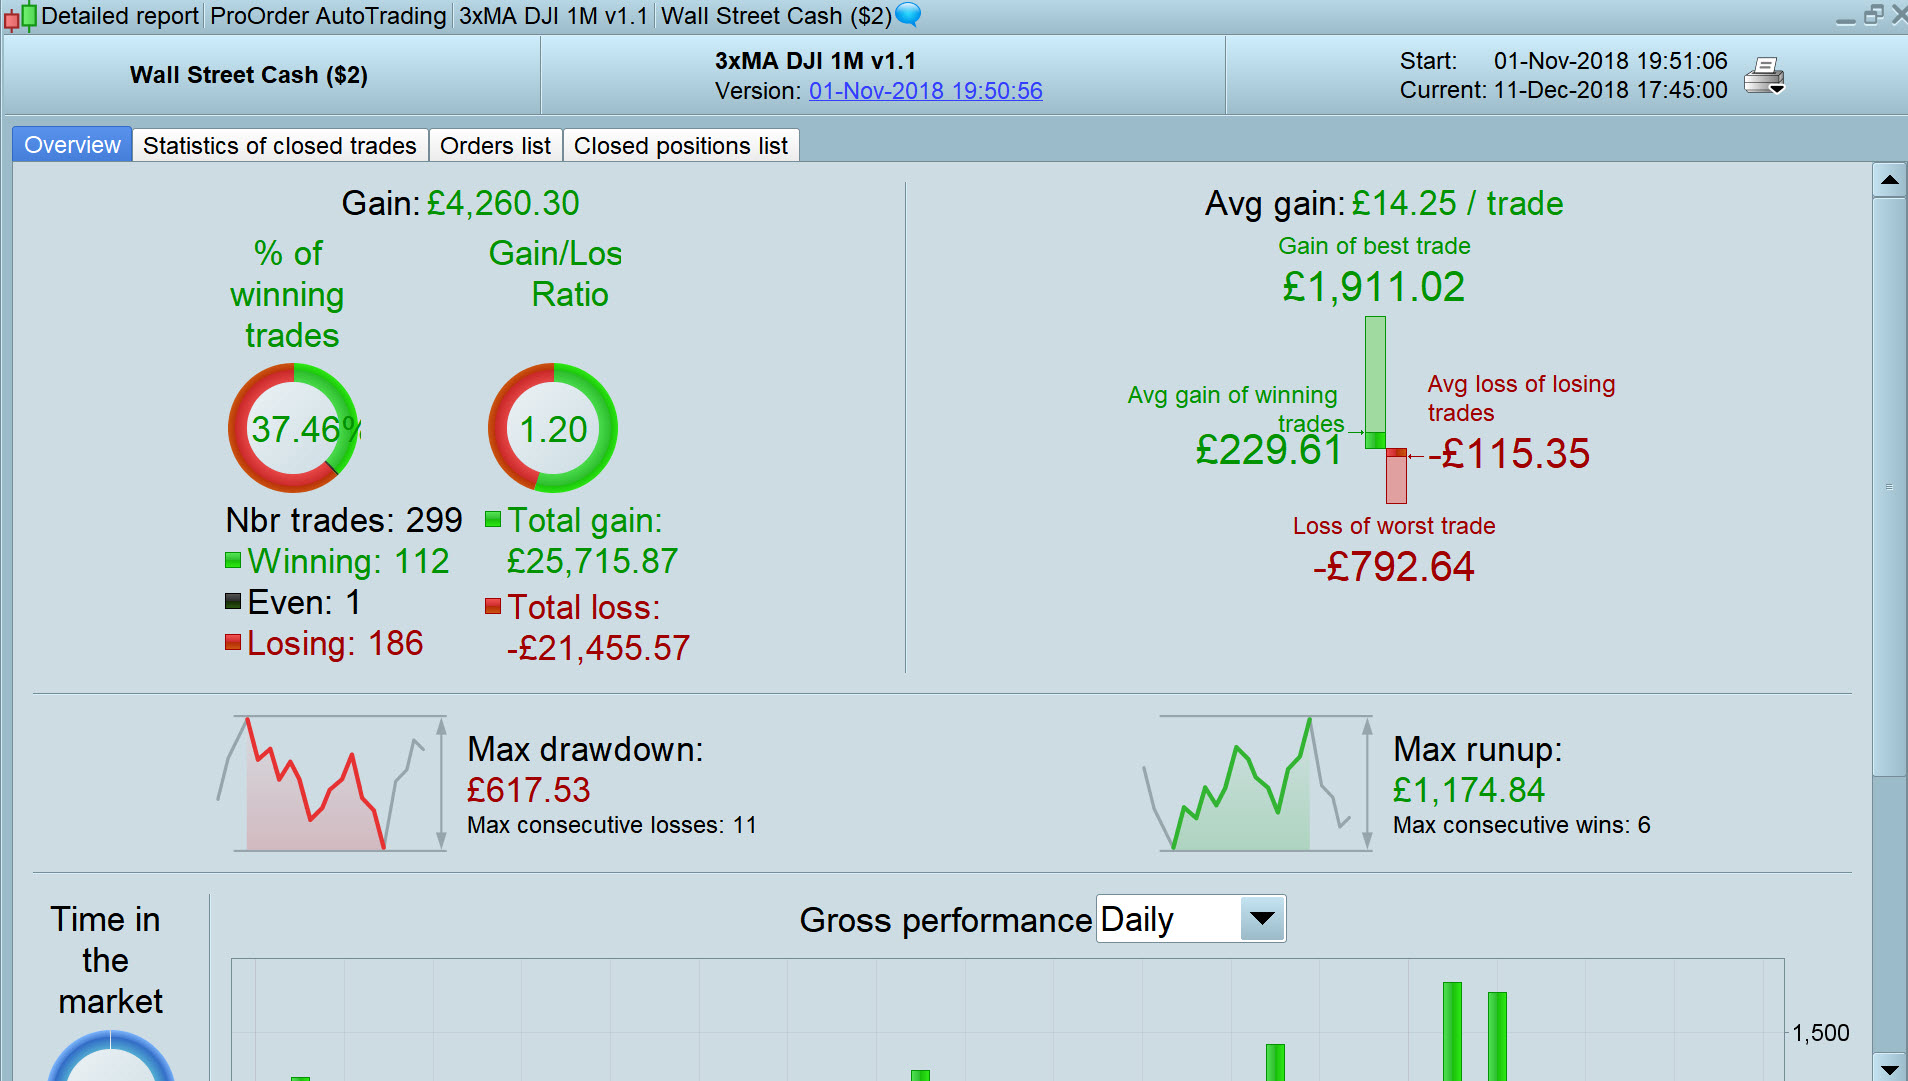
- Draw – 1 shows Max Drawdown as £617.53 over 11 consecutive trades.
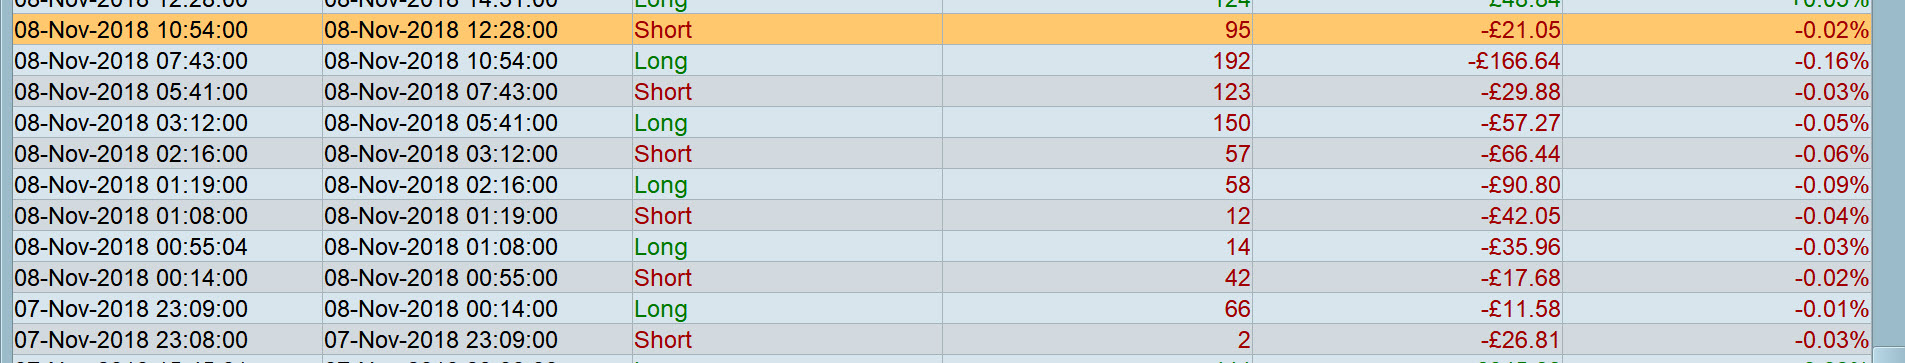
- Draw – 2 shows the 11 consecutive trades, which add up to Loss = £566!
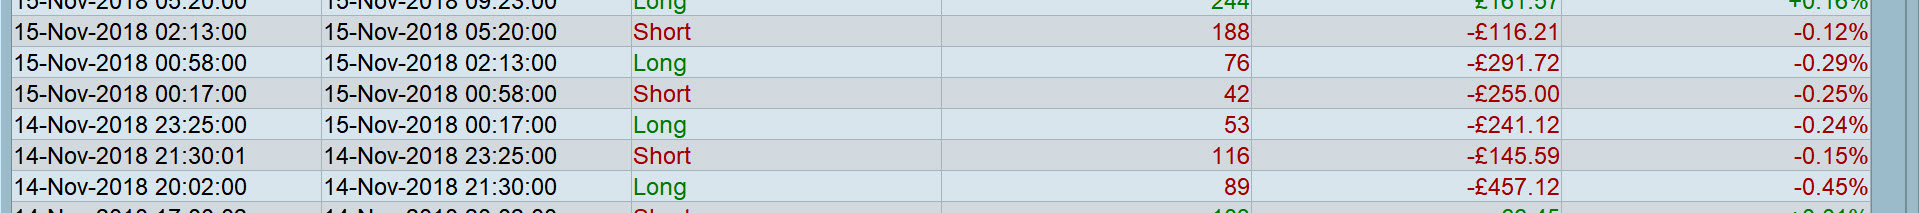
- Draw – 3 shows 6 consecutive trades that add up to Loss = £1,505
So what does Max Drawdown mean? It can’t mean the max amount lost in a run of trades? £617.53 isn’t the max amount I lost as Draw – 3 shows that the max amount I lost in a run of trades is £1,505??
Have you ever done a similar exercise as above? What conclusions did you come to please?
I don’t know what your SL is but, apart from DRAWDOWN calculations documented in the PDF manual (I remember you suggested a modification to Nicolas), your strategy may end up with a minimal gain or loss, still go through a huge partial loss only mitigated in the end by a distant SL. I mean that if you set a SL to 300 pips, then your trade can go wrong up to 299 pips (that’s money you need to have, plus required margin, on your account), then end up gaining just 10! You must not consider how much you have lost or gained, but how much you could have lost!
You must not consider how much you have lost or gained, but how much you could have lost!
I agree, but when the Max Drawdown shown in the overall results – 617.53 – is less than half my actual drawdown (over 6 trades) of £1505 then it leaves me thinking the Max Drawdown calculation (in overall results) has to be wrong and / or is very misleading?
The equity curve for the 6 trades / £1505 loss does appear to fit the definition of Drawdown in the PRT Manual (which still hadn’t been corrected when I checked a few days ago).
In my mind maximum draw down should be how big your maximum loss would have been at any point.
So that is your biggest negative equity from closed trades at any point + the maximum loss of the any open trade at that point.
Draw down percentage should be calculated based on starting equity in my mind rather than on the equity at the time the maximum draw down occurred this way we know that if we started with a capital of £10000 and max draw down was £6000 or 60% across all our test data then the strategy would have survived no matter if we had started it just before the £6000 draw down occurred.
I don’t pay too much attention to PRT’s draw down calculations for the above reason and because they are always wrong unless you refresh the results window!
We had a discussion about it here:
Backtest sorting by lowest drawdown
You could use my code snippet in all back tests to ensure that you only get results from tests with acceptable draw down from start capital. It also speeds up back testing.
All good stuff, thank you guys, but I still can’t come to terms with / find Max Drawdown useful when
£617.53 is shown / defined as a potential maximum drawdown
when
actual drawdown of 6 consecutive trades is £1505 ??
PS I did refresh the results window to get Max Drawdown of £617.53 as shown in my Draw 1 attachment in my OP.
In my mind maximum draw down should be how big your maximum loss would have been at any point.
I guess I am seeing it the same way as you Vonasi and therefore it leaves me wondering why PRT even bother posting a useless / meaningless Max Drawdown figure at all??
GraHal – your evidence makes me think that they looked for the longest run of losing trades and then called that maximum draw down!
longest run of losing trades and then called that maximum draw down!
Yeah as in the maximum number of consecutive losing trades … in my example this being 11 x losing trades which just happens to give £617.53 … which is nowhere near the maximum £££’s loss I experienced from 6 x consecutive losing trades which was £1505.
Apologies for repeating myself, but it may be useful for others doing a quick scan of this Thread in the future.
So Max Drawdown as quoted in the Overview Tab for the Performance of a System is likely to be not much use for assessing a System robustness.
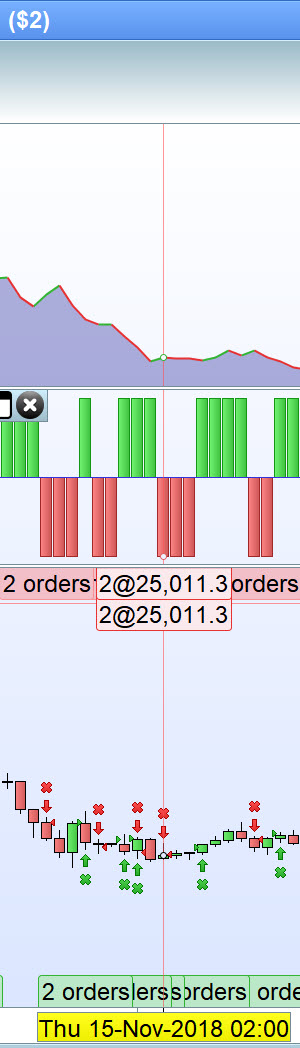
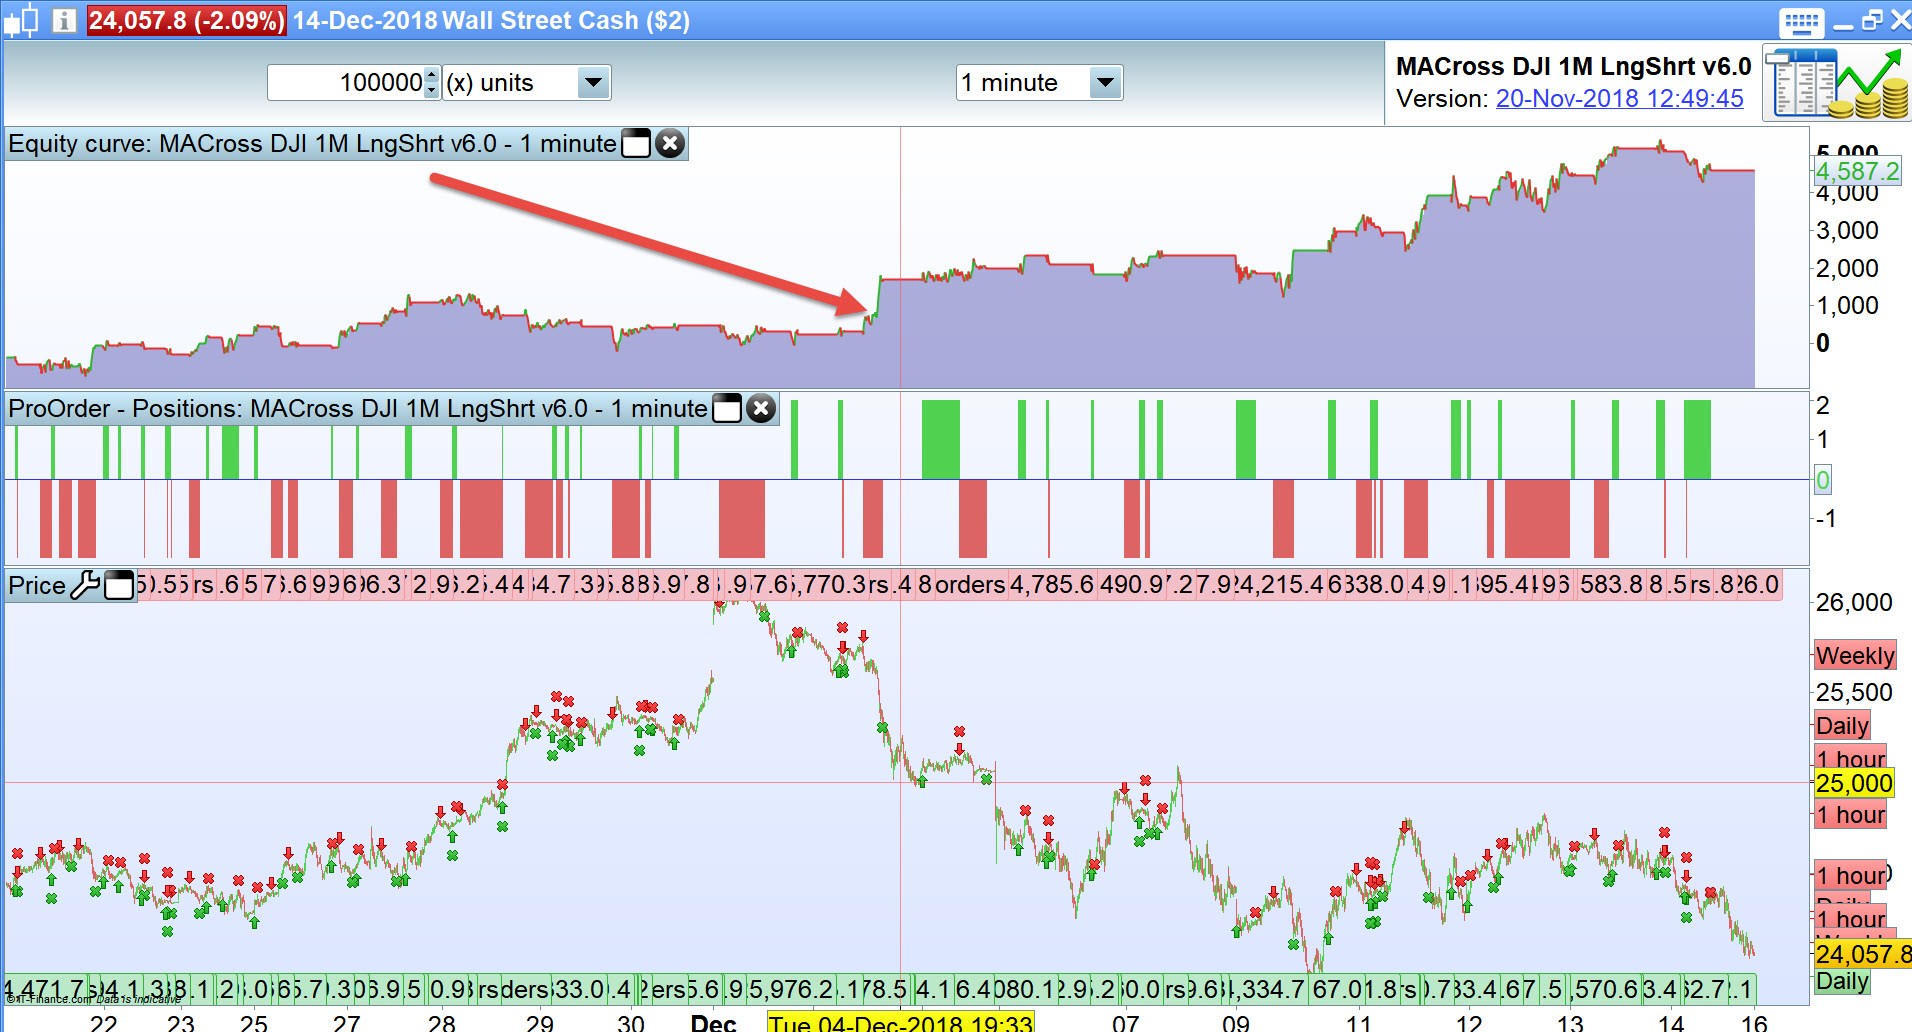
It may be better to do – as I did – and look closely at the equity curve for the System to spot the largest drop in Gain. Then find these consecutive Losses on the Tab – Closed Positions List and work out a more accurate Max Drawdown using a calculator.
Or for a useful quick and dirty figure use the horizontal cross hair at max and min of the largest drop in gain and read off the equity drop on the right hand scale.
I sure hope Max Drawdown will be reborn as a useful / meaningful tool in Version 11!
PS Same useless logic (not) must also apply to MAX RUN UP!
Or for a useful quick and dirty figure use the horizontal cross hair at max and min of the largest drop in gain and read off the equity drop on the right hand scale.
Exactly what I do as I do not trust the report figures.
Our expectations for v11 are getting pretty big. I hope it lives up to them.
GraHal,
The way I thought the MaxDD figures were calculated in PRT can´t explain the case you are exposing.
IMO, the two figures: MAXDRAWDOWN and NºCONSECUTIVE LOSSES don´t have to be related necessarily. The first is the biggest difference between a Max point and a Min consecutive point in the equity curve at any period of the curve, but between this MAX and MIN points there can be any number of winers and loosers trades, so the NºCONSECUTIVE LOSSES not necessarily has to be in this MAX-MIN period. It´s hard to explain in words, maybe and example.
This is the list of consecutive trades in a system:
#Trade P/L of the trade TOTAL P/L of the system
1 +5 +5
2 -10 -5
3 +5 0
4 -40 -40
5 +5 -35
6 -10 -45
7 -10 -55
8 -10 -65
With this system and the way I thougt the DD worked it should say in the report:
MaxDD: 45 (from trade 1 to 4)
Nº Consecutive Losses: 3 (from trade 6 to 8)
And note this two figures come from different trades at all
But as I said this doesn´t explain your case !?
I agree @TempusFugit that how you describe is how Rundown / Runup is defined in the PRT Manual.
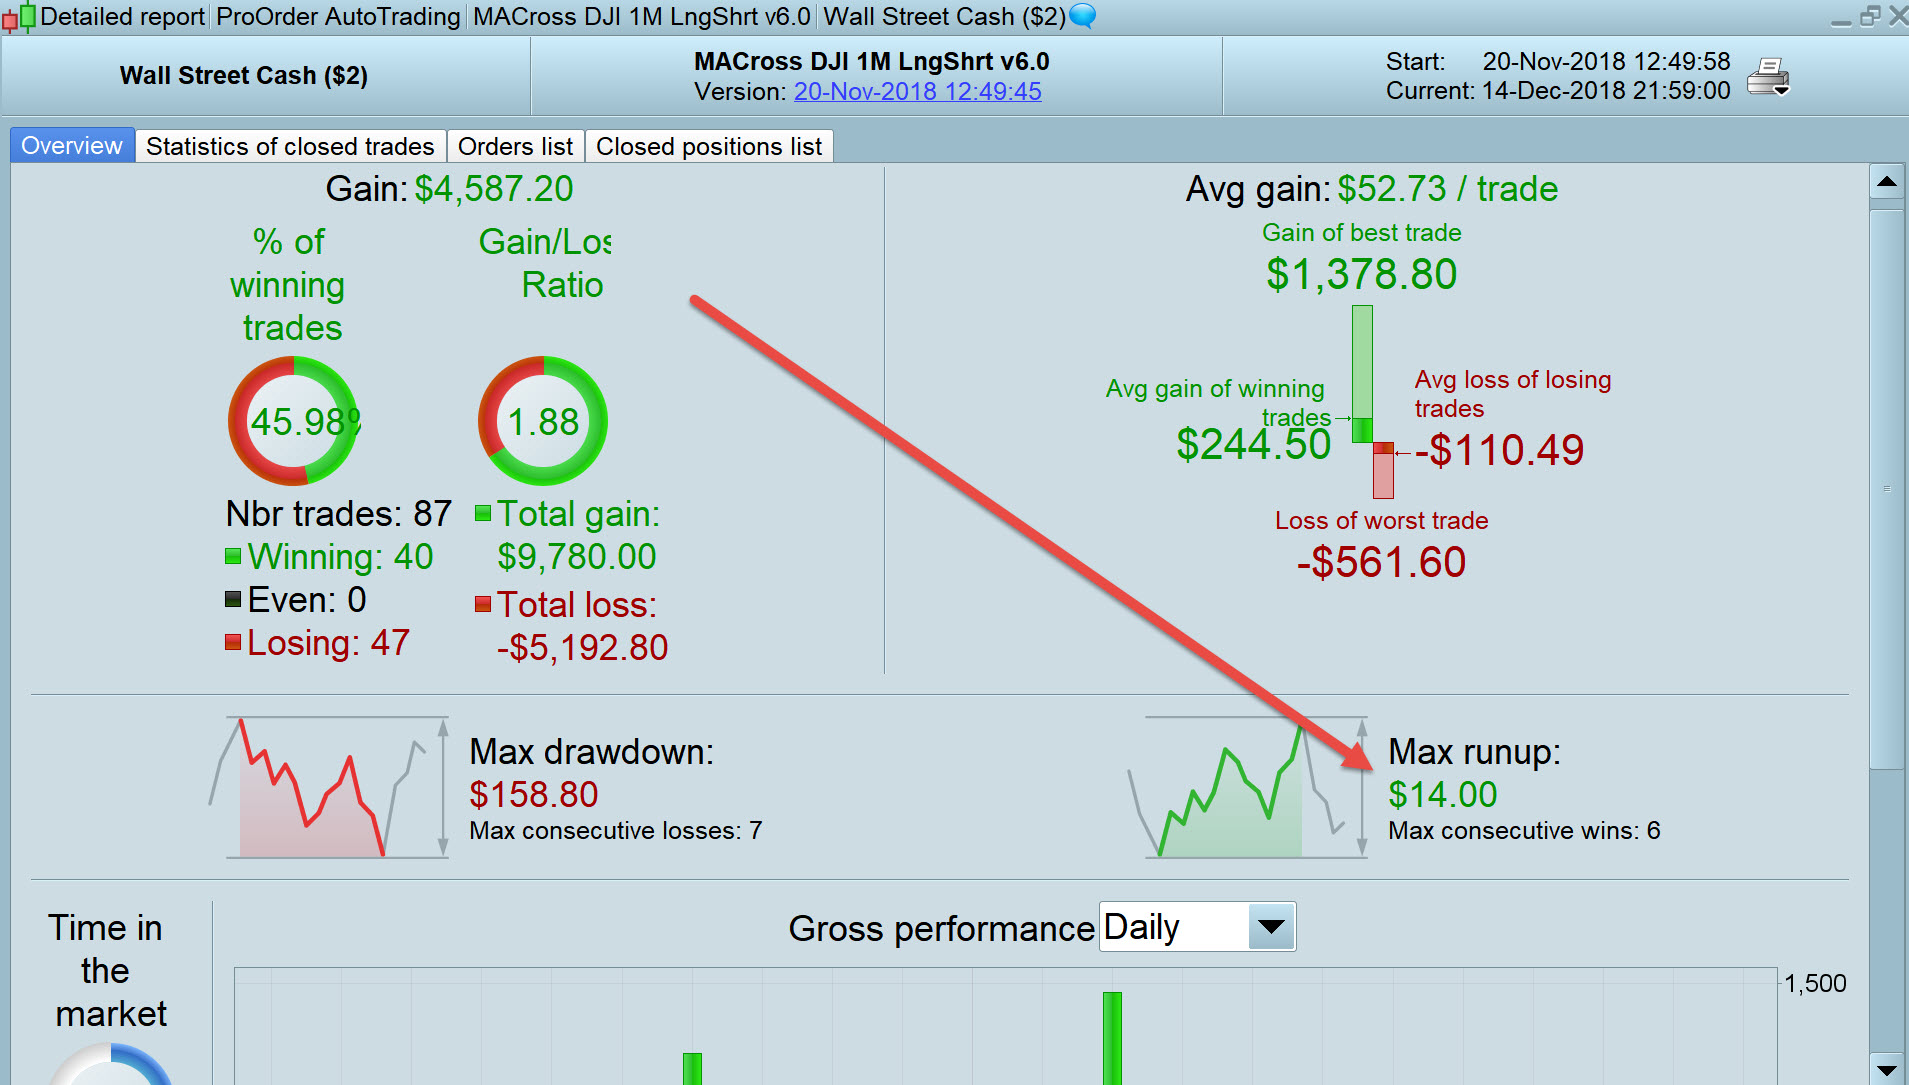
But the calculation / figure that appear on the Performance Report for Systems must NOT be in accordance with the definition in the Manual … see attached and where clearly the biggest run up as seen from the equity curve … is $1440 (using cross hairs) and gain of best trade $1378 (from Performance Report) compared with $14 Max Run up on the Performance Report.
PRT Support @Jakub … have you got any comments on this please??
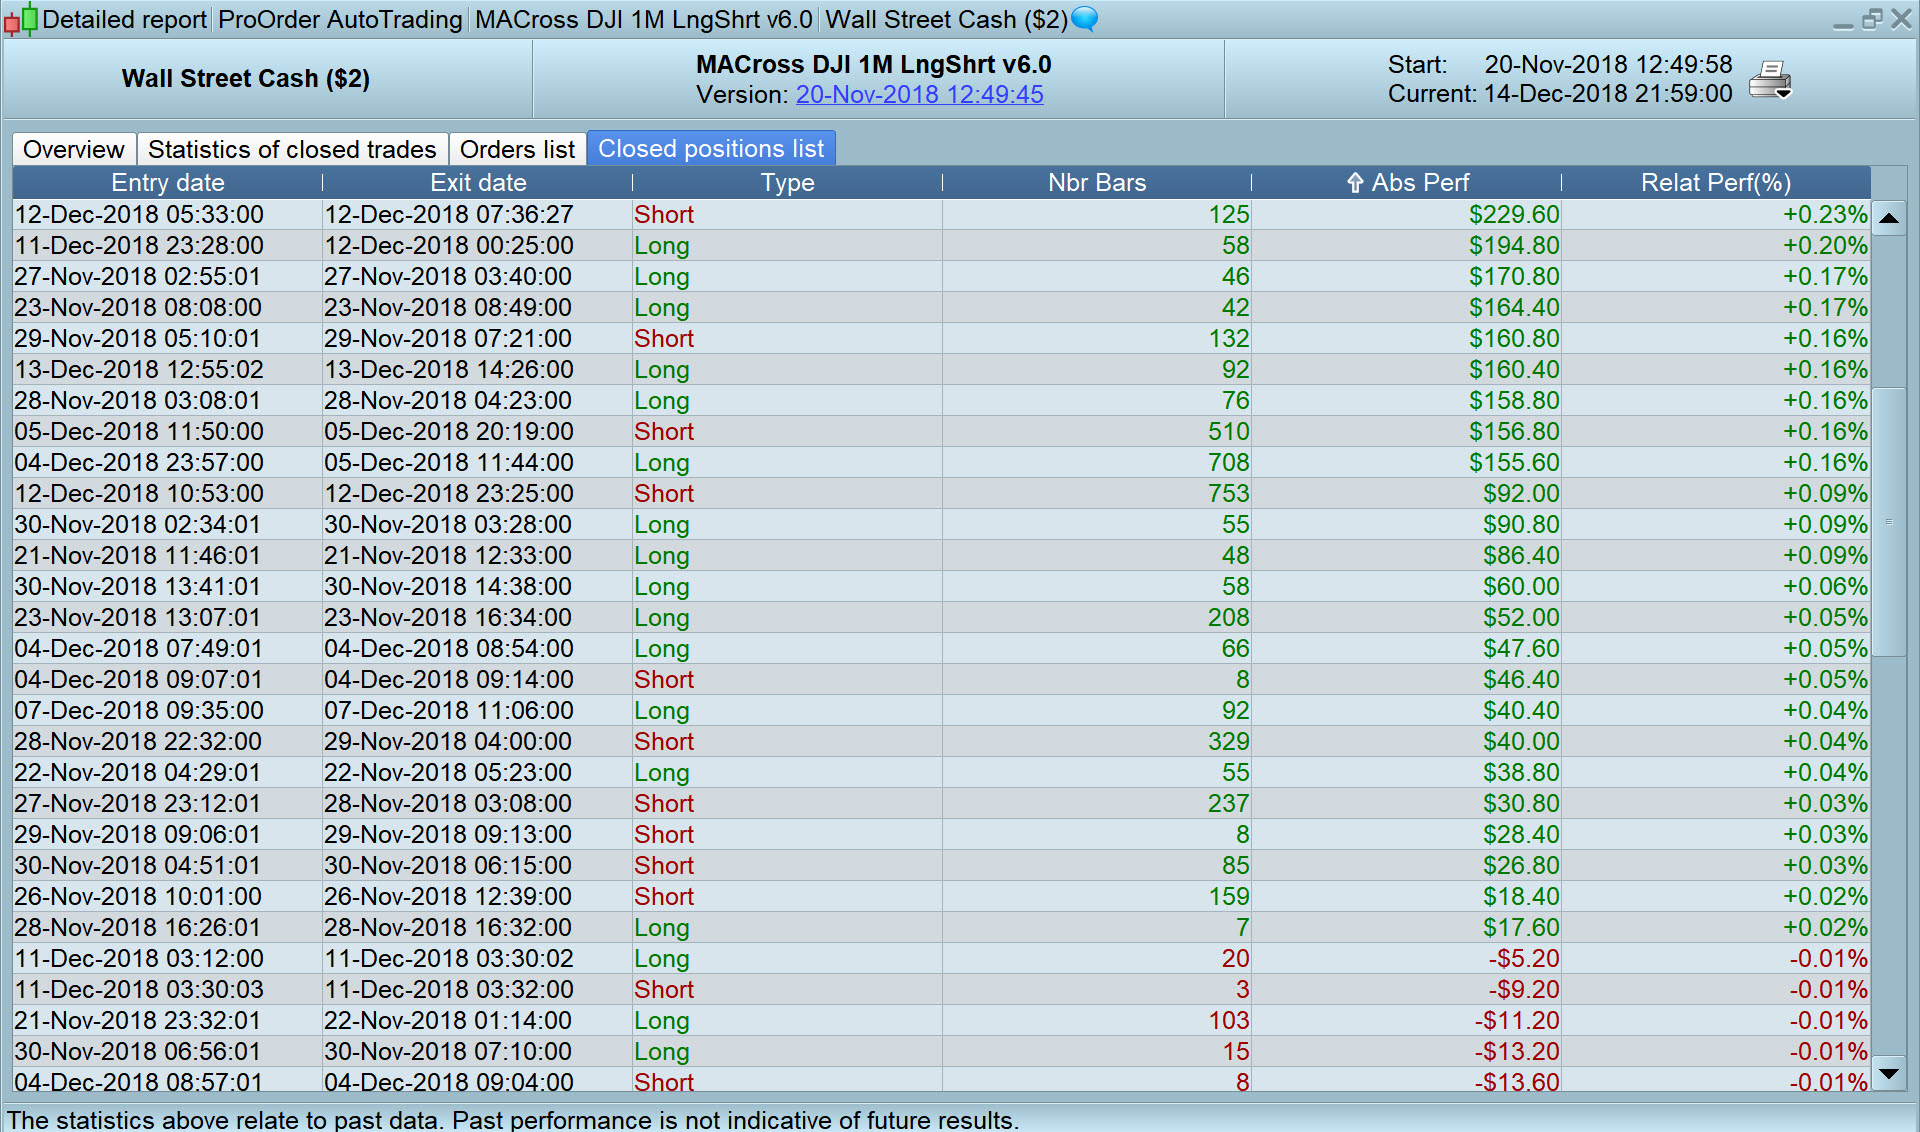
I bet if you found 6 wins in a row they would add up to $14. It might be worth checking the closed positions list just to eliminate this possibility.
I tried no luck then sorted by Gain and the lowest gain is $17.60.
I even looked for 6 consecutive trades – win or lose – that added up to $14 … couldn’t find!
No sense / logic to the figures shown for Run up, in this instance anyway?
As for being useful … complete waste of space where something useful could be shown instead ?
Roll on Version 11!!??
I keep imagining you on your tod typing away in your Yacht out of the water ??? HAHAHAHHA
I keep imagining you on your tod typing away in your Yacht out of the water ??? HAHAHAHHA
She’s not quite as big as that one! Very windy today so waves are crashing over the harbour wall just in front of the boat. Every crashing wave makes the boat wobble and the wind is doing its own bit of boat wobbling too. Still after seventeen years aboard it all feels perfectly normal now.