Bard
BardParticipant
Master
Thanks very much for converting the 3D candles to Ehler’s Universal Oscillator, @ALE
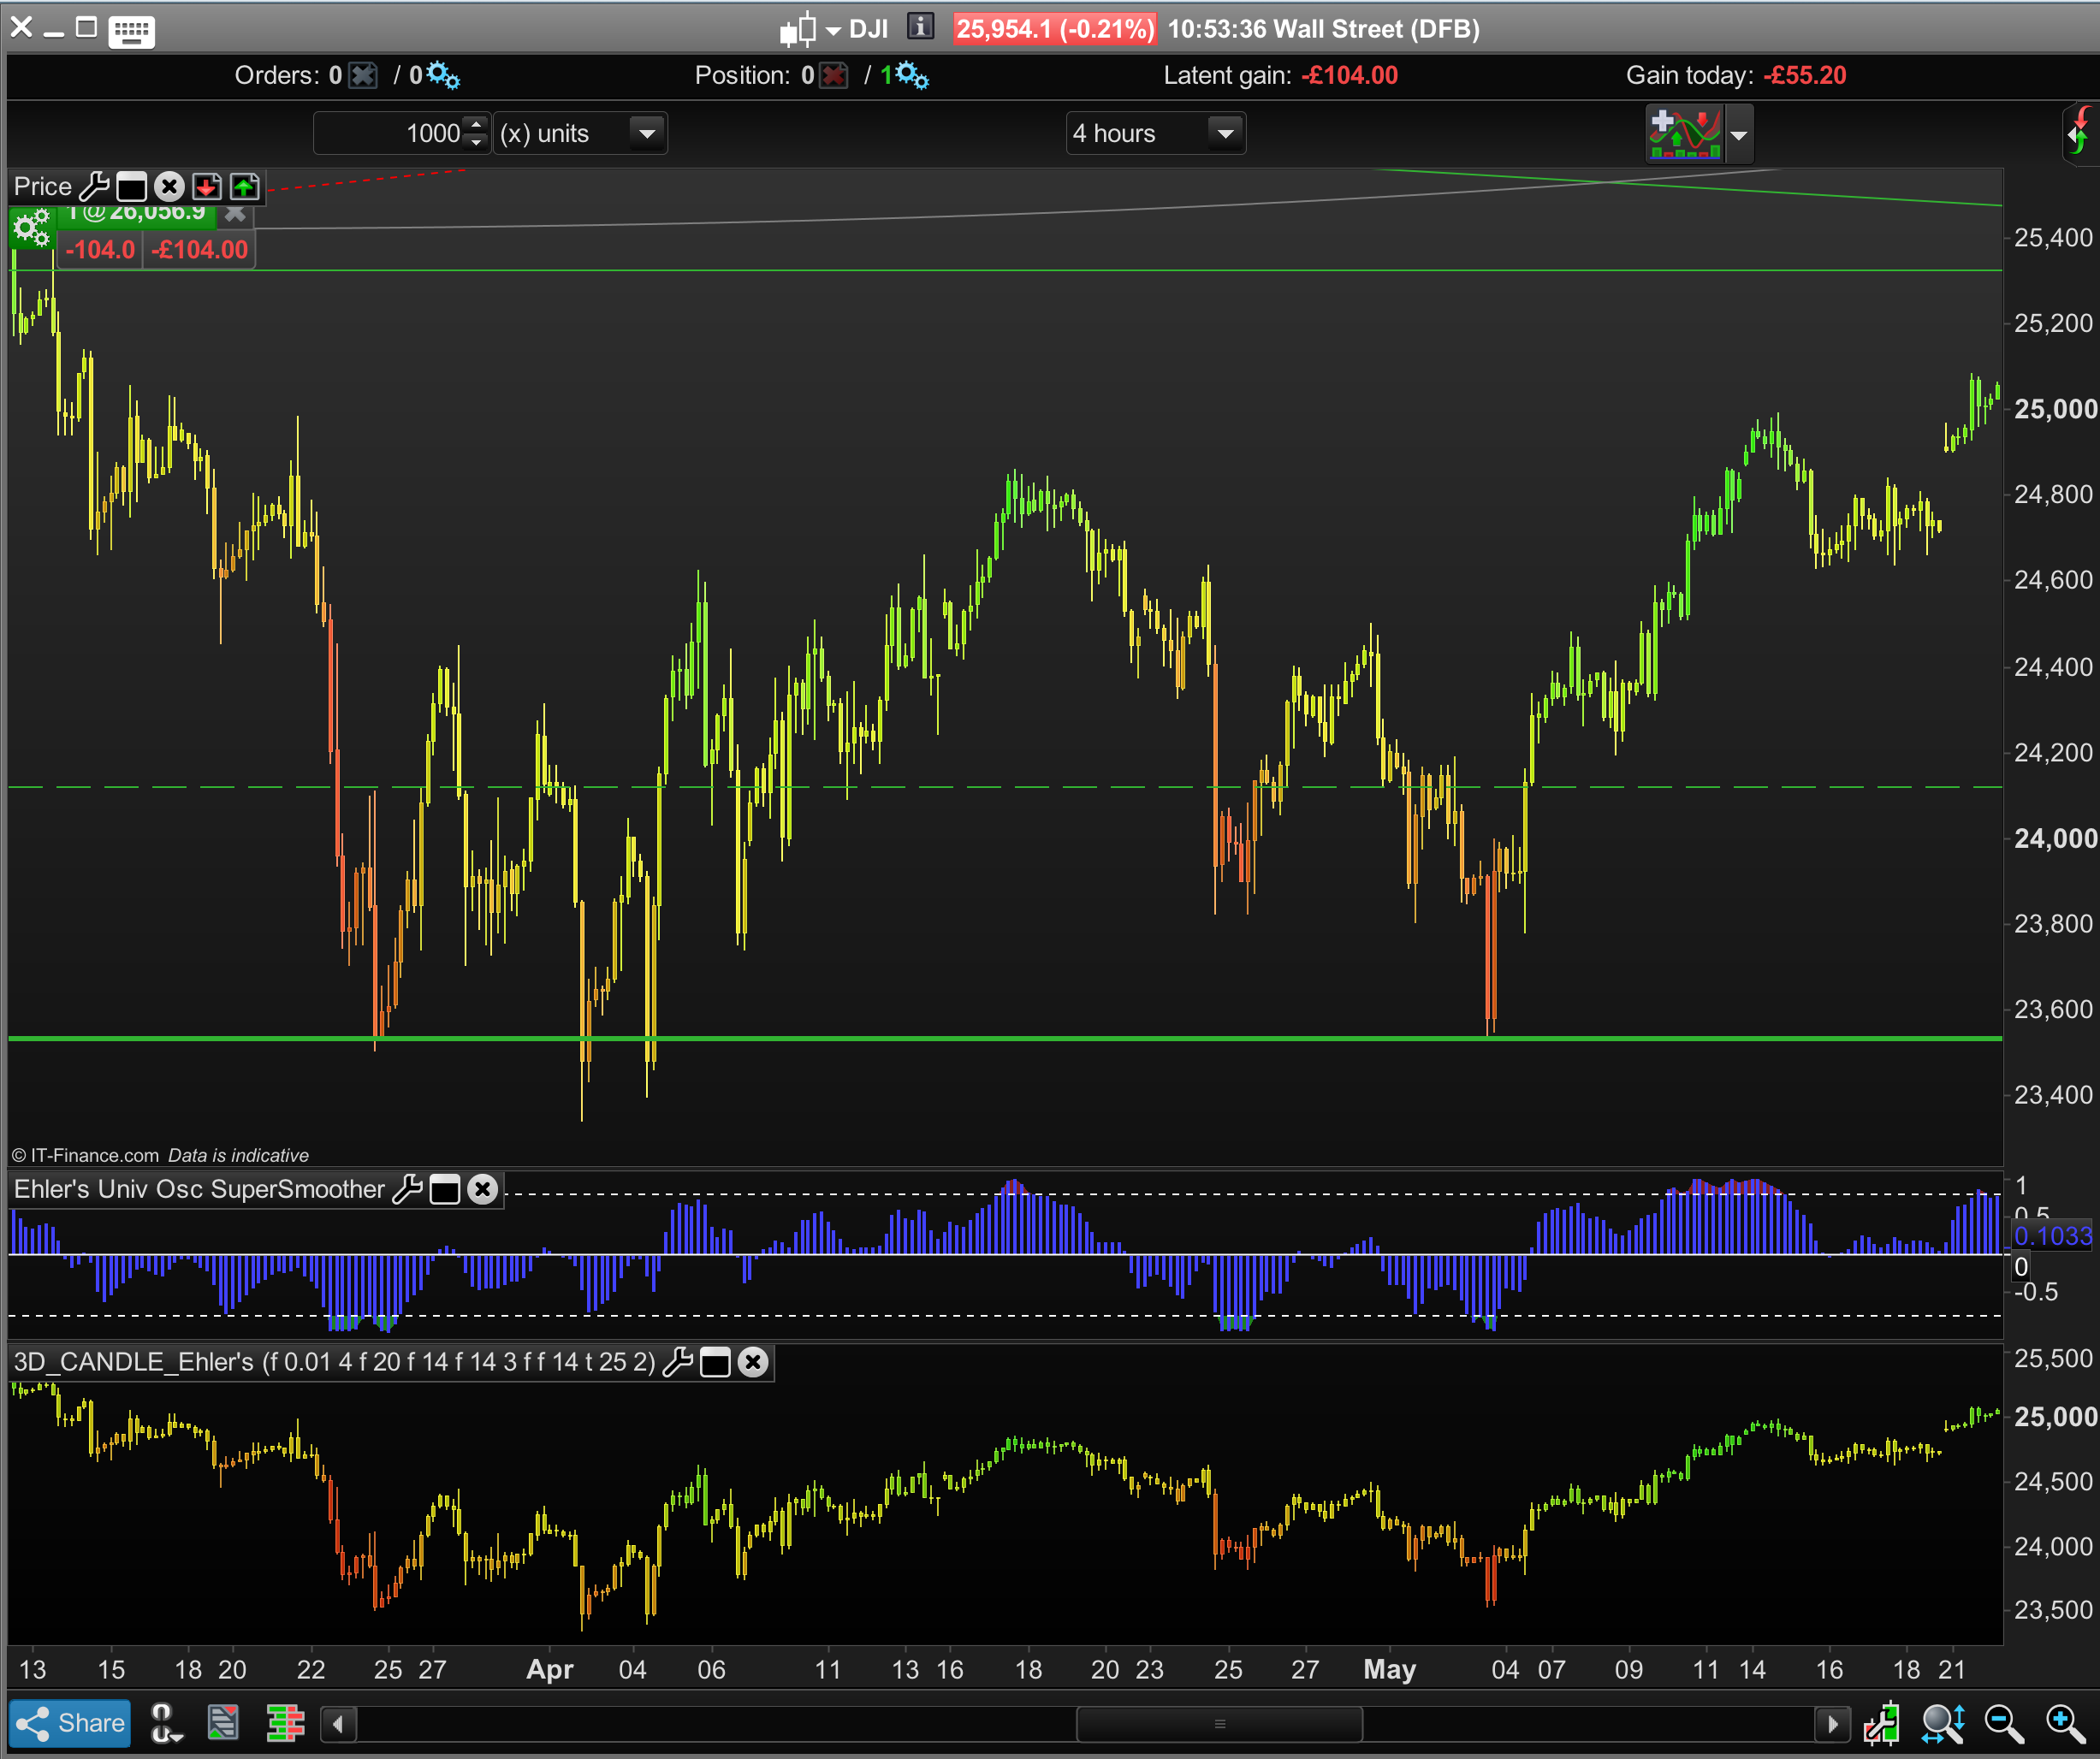
One question, why when I add the Ehler’s version of the 3D indicator (via the charts top right “add indicator” button) does the indicator have the Dow Jones price and is not bound between +1 and -1 ? Pls see screenshot.
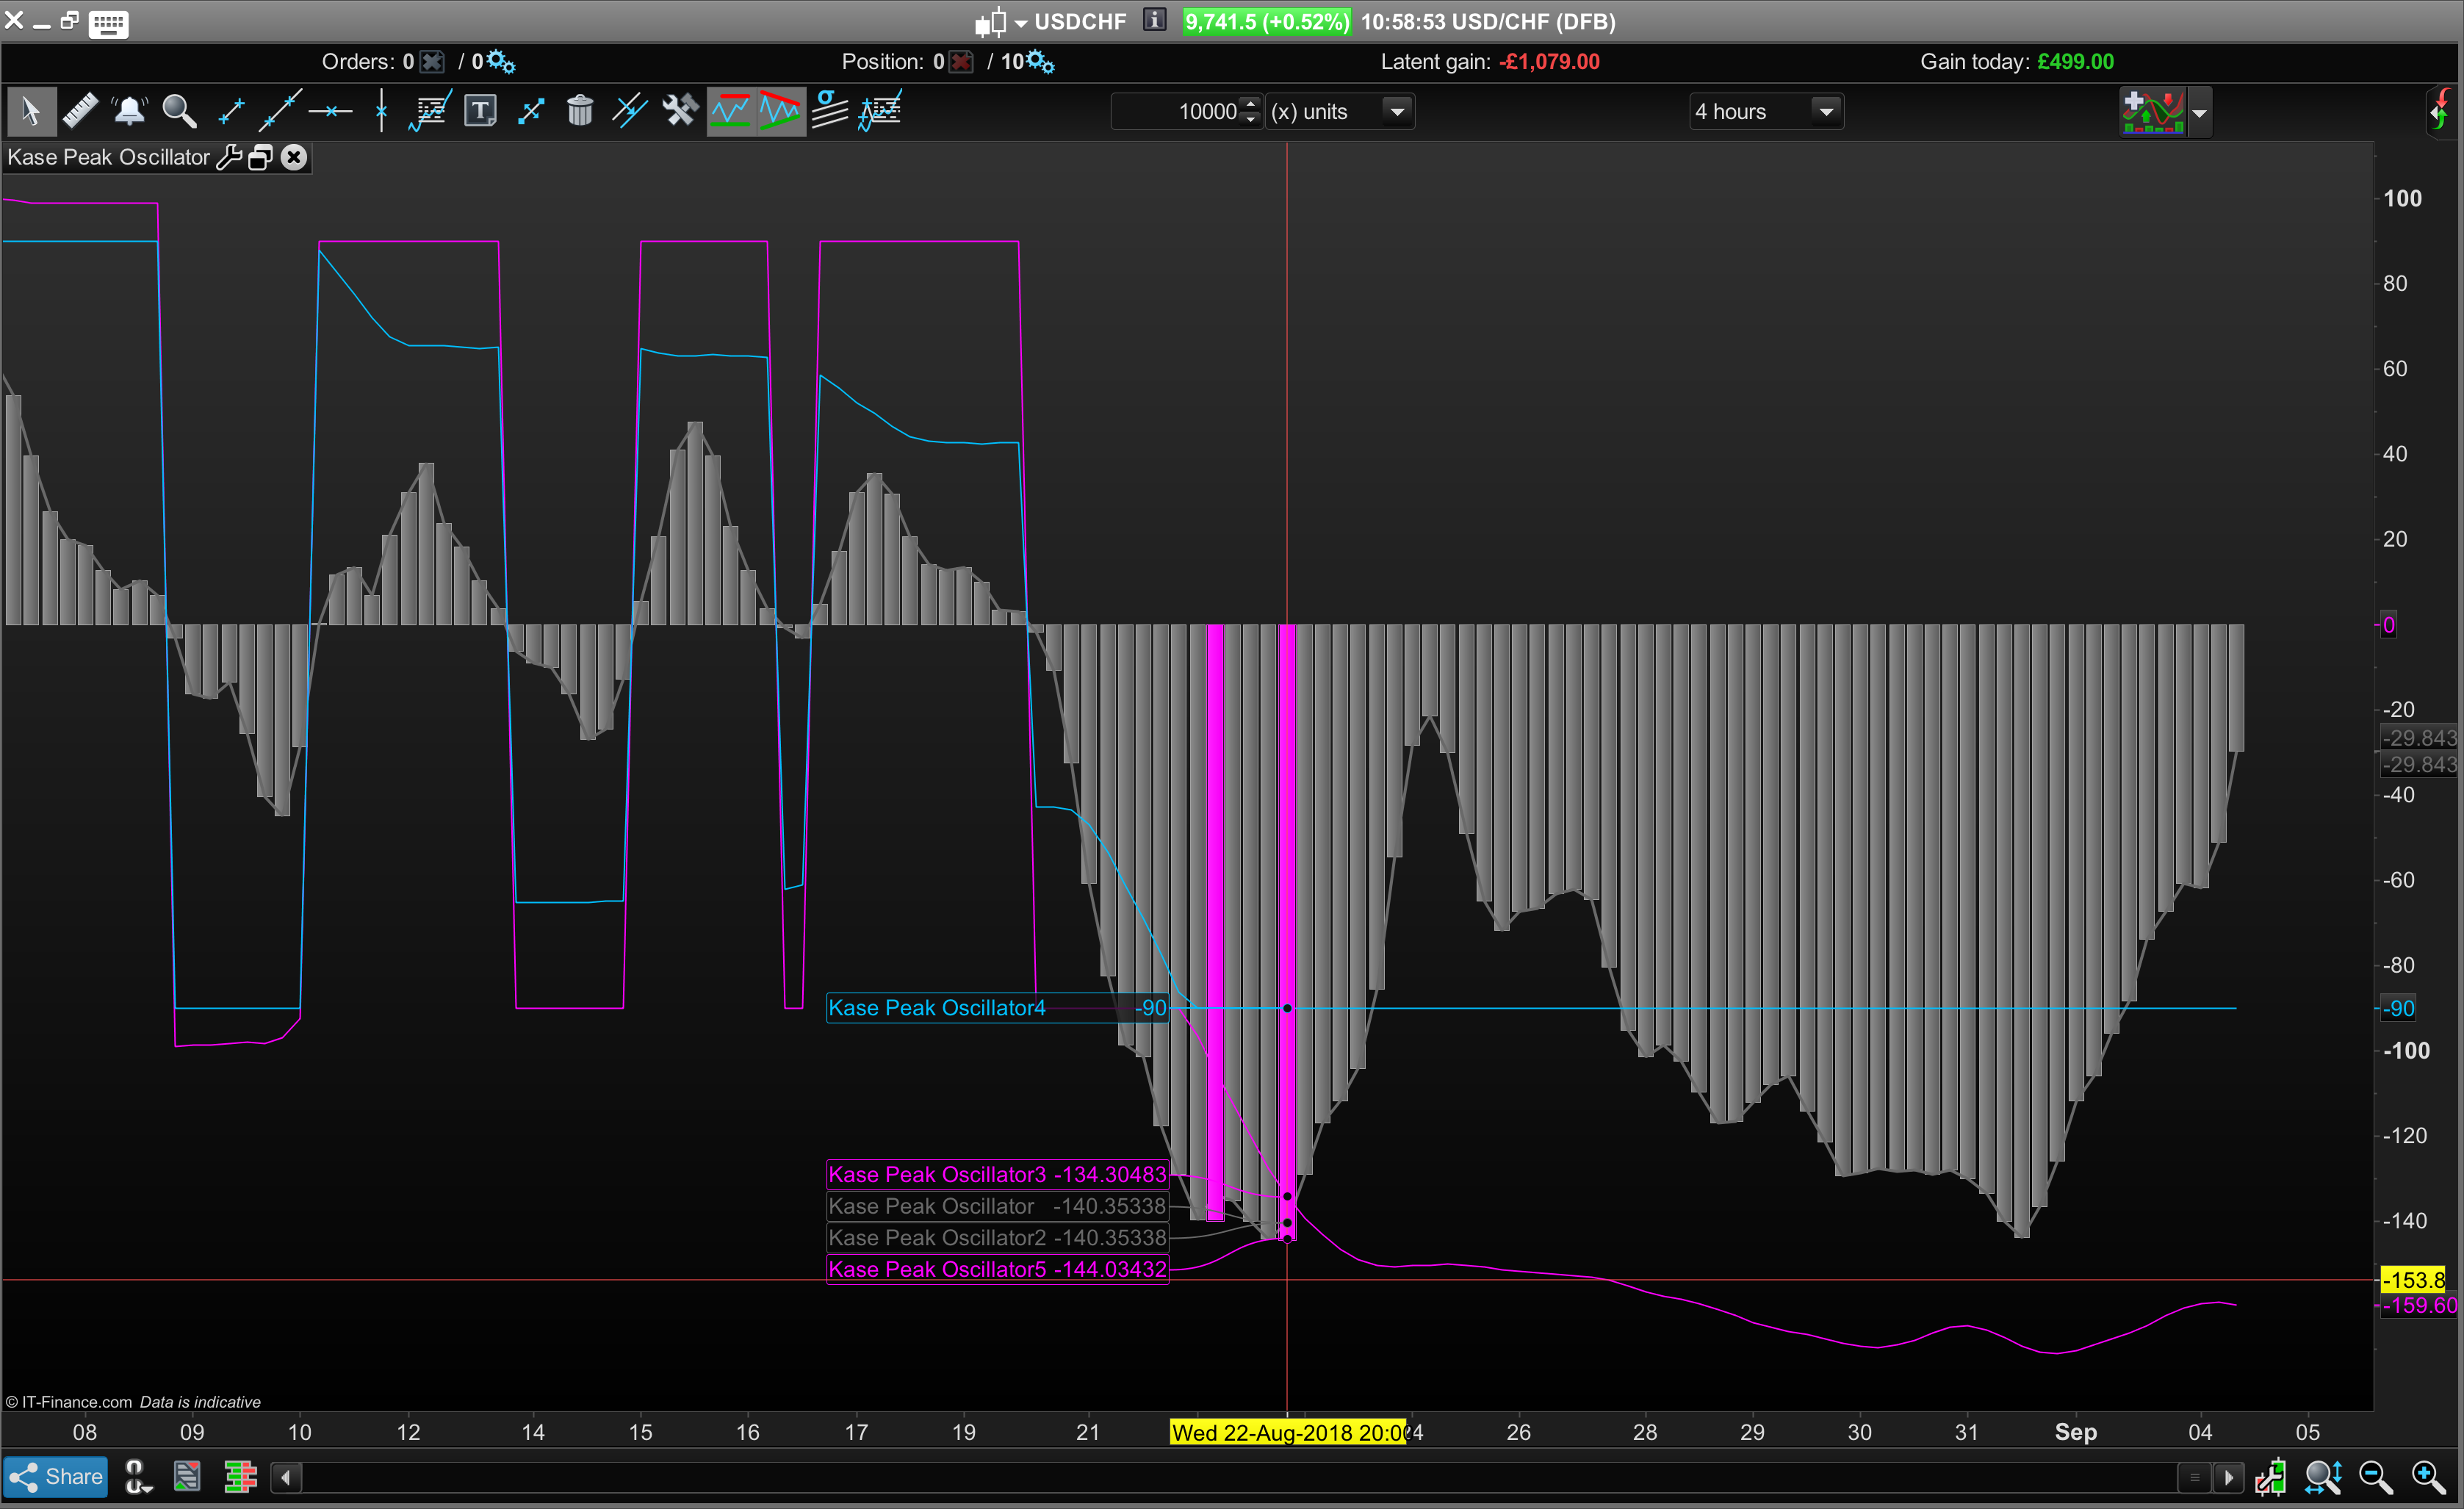
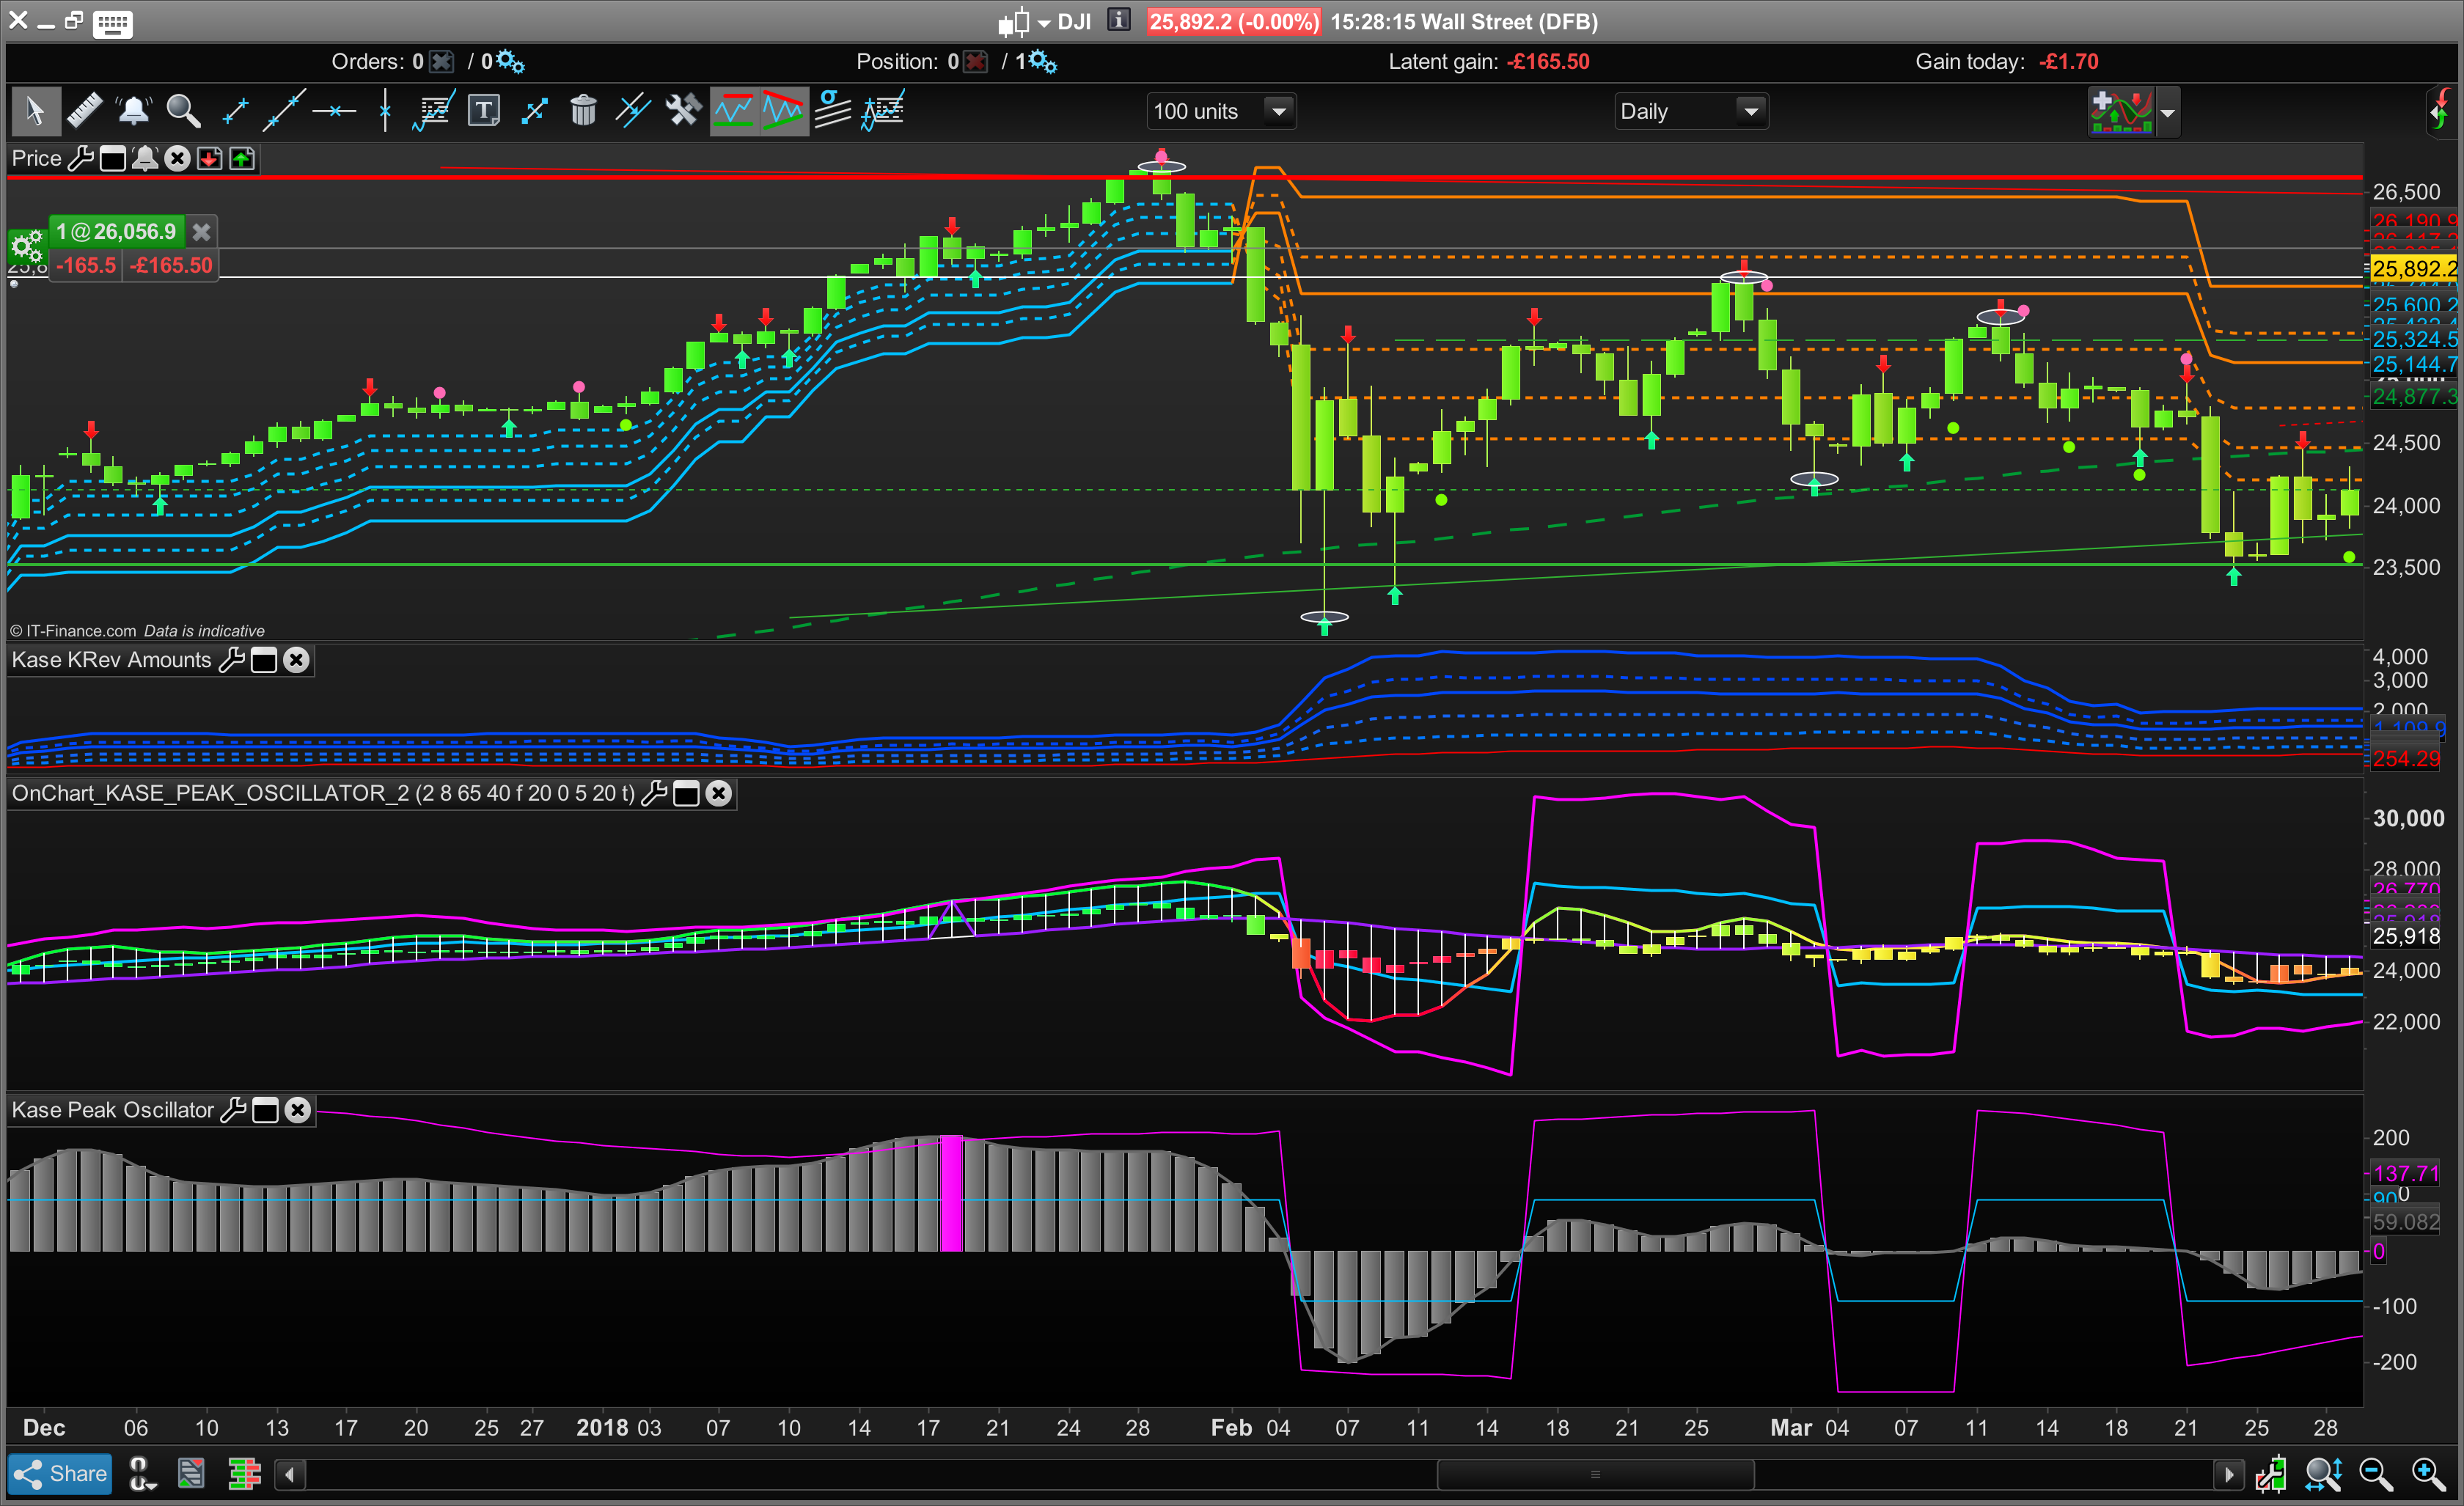
With the Kase Peak Oscillator is it possible to plot colours on the candles in relation to the grey histogram of the oscillator but also have the pink Peak Outs drawn in as well? Ultimately it would be good to have the pink and blue lines drawn in as well (Kase Peak Osc 3 and 4). Pls see screenshot.
Thanks once again for providing an instantly visible overbought and oversold indicator!
 ALE
ALEModerator
Master
Do you want Universal indicator with colours?
ALEModerator
Master
about kase oscillator I’ll try to code it
Thank
Ale
 Fr7
Fr7Participant
Master
Hola
Por favor encuentre la versión con código Universal.
Por favor, hágamelo saber como le gustaría interpretar el indicador kase,
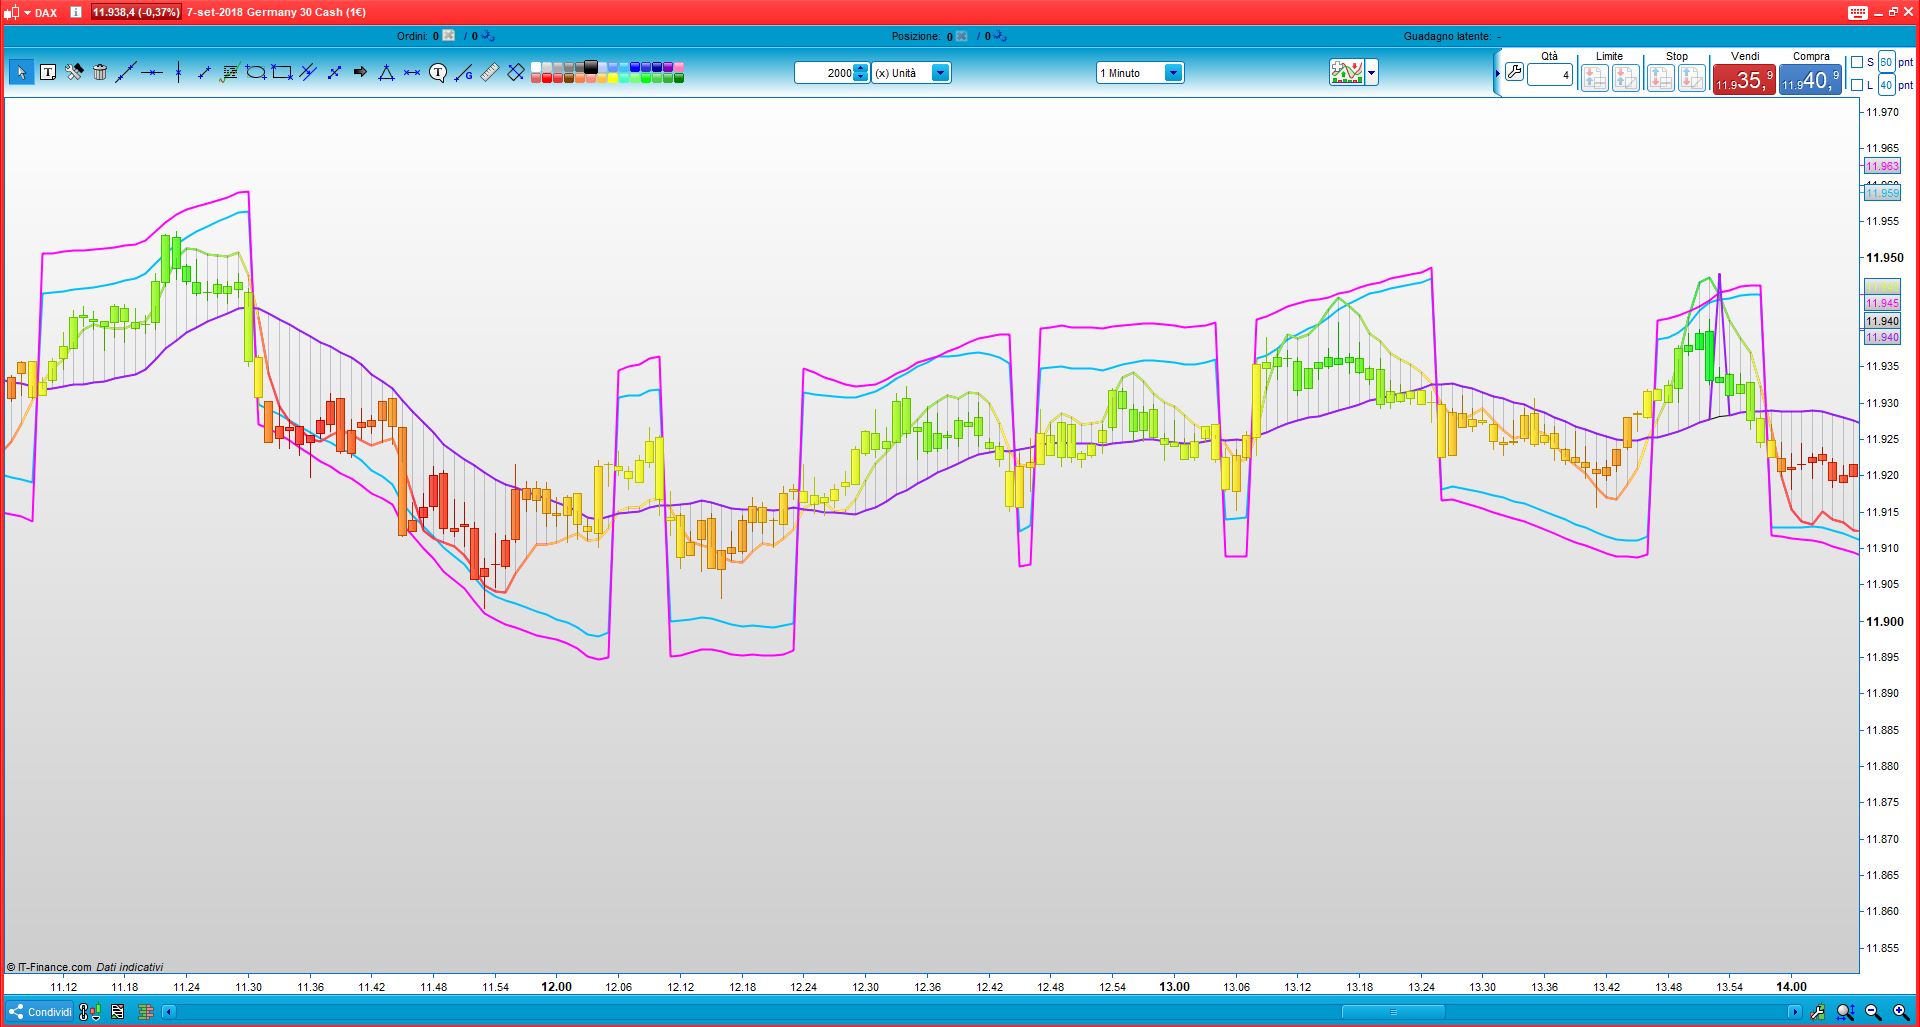
Could I put the 3D_candle indicator in the form of an oscillator like in its image?
You have only published it in the form of candles ….
thanks
ALEModerator
Master
Please Fr7 write in english and repeat your question I don’t understand
Thanks
Fr7Participant
Master
Could you put the 3D_candle indicator in the form of an oscillator like in its image?
thanks
BardParticipant
Master
Very nice @ALE, thank you, you’ve done a great job, as the screenshot shows:
BardParticipant
Master
Hi Fr7, The file you need is above you in this thread #79749: UNIVERSAL-COLOUR-_JOHN_EHLERS.itf
BardParticipant
Master
Realised I didn’t tag you in my answer above, @Fr7
ALEModerator
Master
Hello Bard,
please let me know if it’s ok for you..
PS
AtrPeriod must be setting for each Time frame as follow:
Time Frame 1 D – Setting ATRperiod=20
Time Frame 4 H – Setting ATRperiod=10
Time Frame 1 H – Setting ATRperiod=4
Time Frame 30 m – Setting ATRperiod=2
Time Frame 15 m – Setting ATRperiod=2
Time Frame 5 m – Setting ATRperiod=2
Time Frame 1 m – Setting ATRperiod=1
Ciao
Ale
BardParticipant
Master
Incredible @Ale! Thanks you so much for doing this – it really does enhance the Kase Peak Oscillator so that now it is very easy to see if you are in oversold, flat or overbought territory.
I was wondering a few things:
How you determined the ATR values for different timeframes posted above?
Is it possible to colour a pink Peak Out as per my image below?
Also is it possible to make the candle/histogram taller like the Kase PO?
Lastly can it be made as a stand alone indicator at the bottom of a chart, or better, perhaps add it to the 3D Candle multi indicator?
Amazing work, really very much appreciated!
ALEModerator
Master
Hello Bard,
It’s a pleasure for me..
have you an example about this request?:”Lastly can it be made as a stand alone indicator at the bottom of a chart?”What do u mean?
ALEModerator
Master
Hello
Please let me know if it’s for you.
Pink Peak out became a blu bar.
Tks
BardParticipant
Master
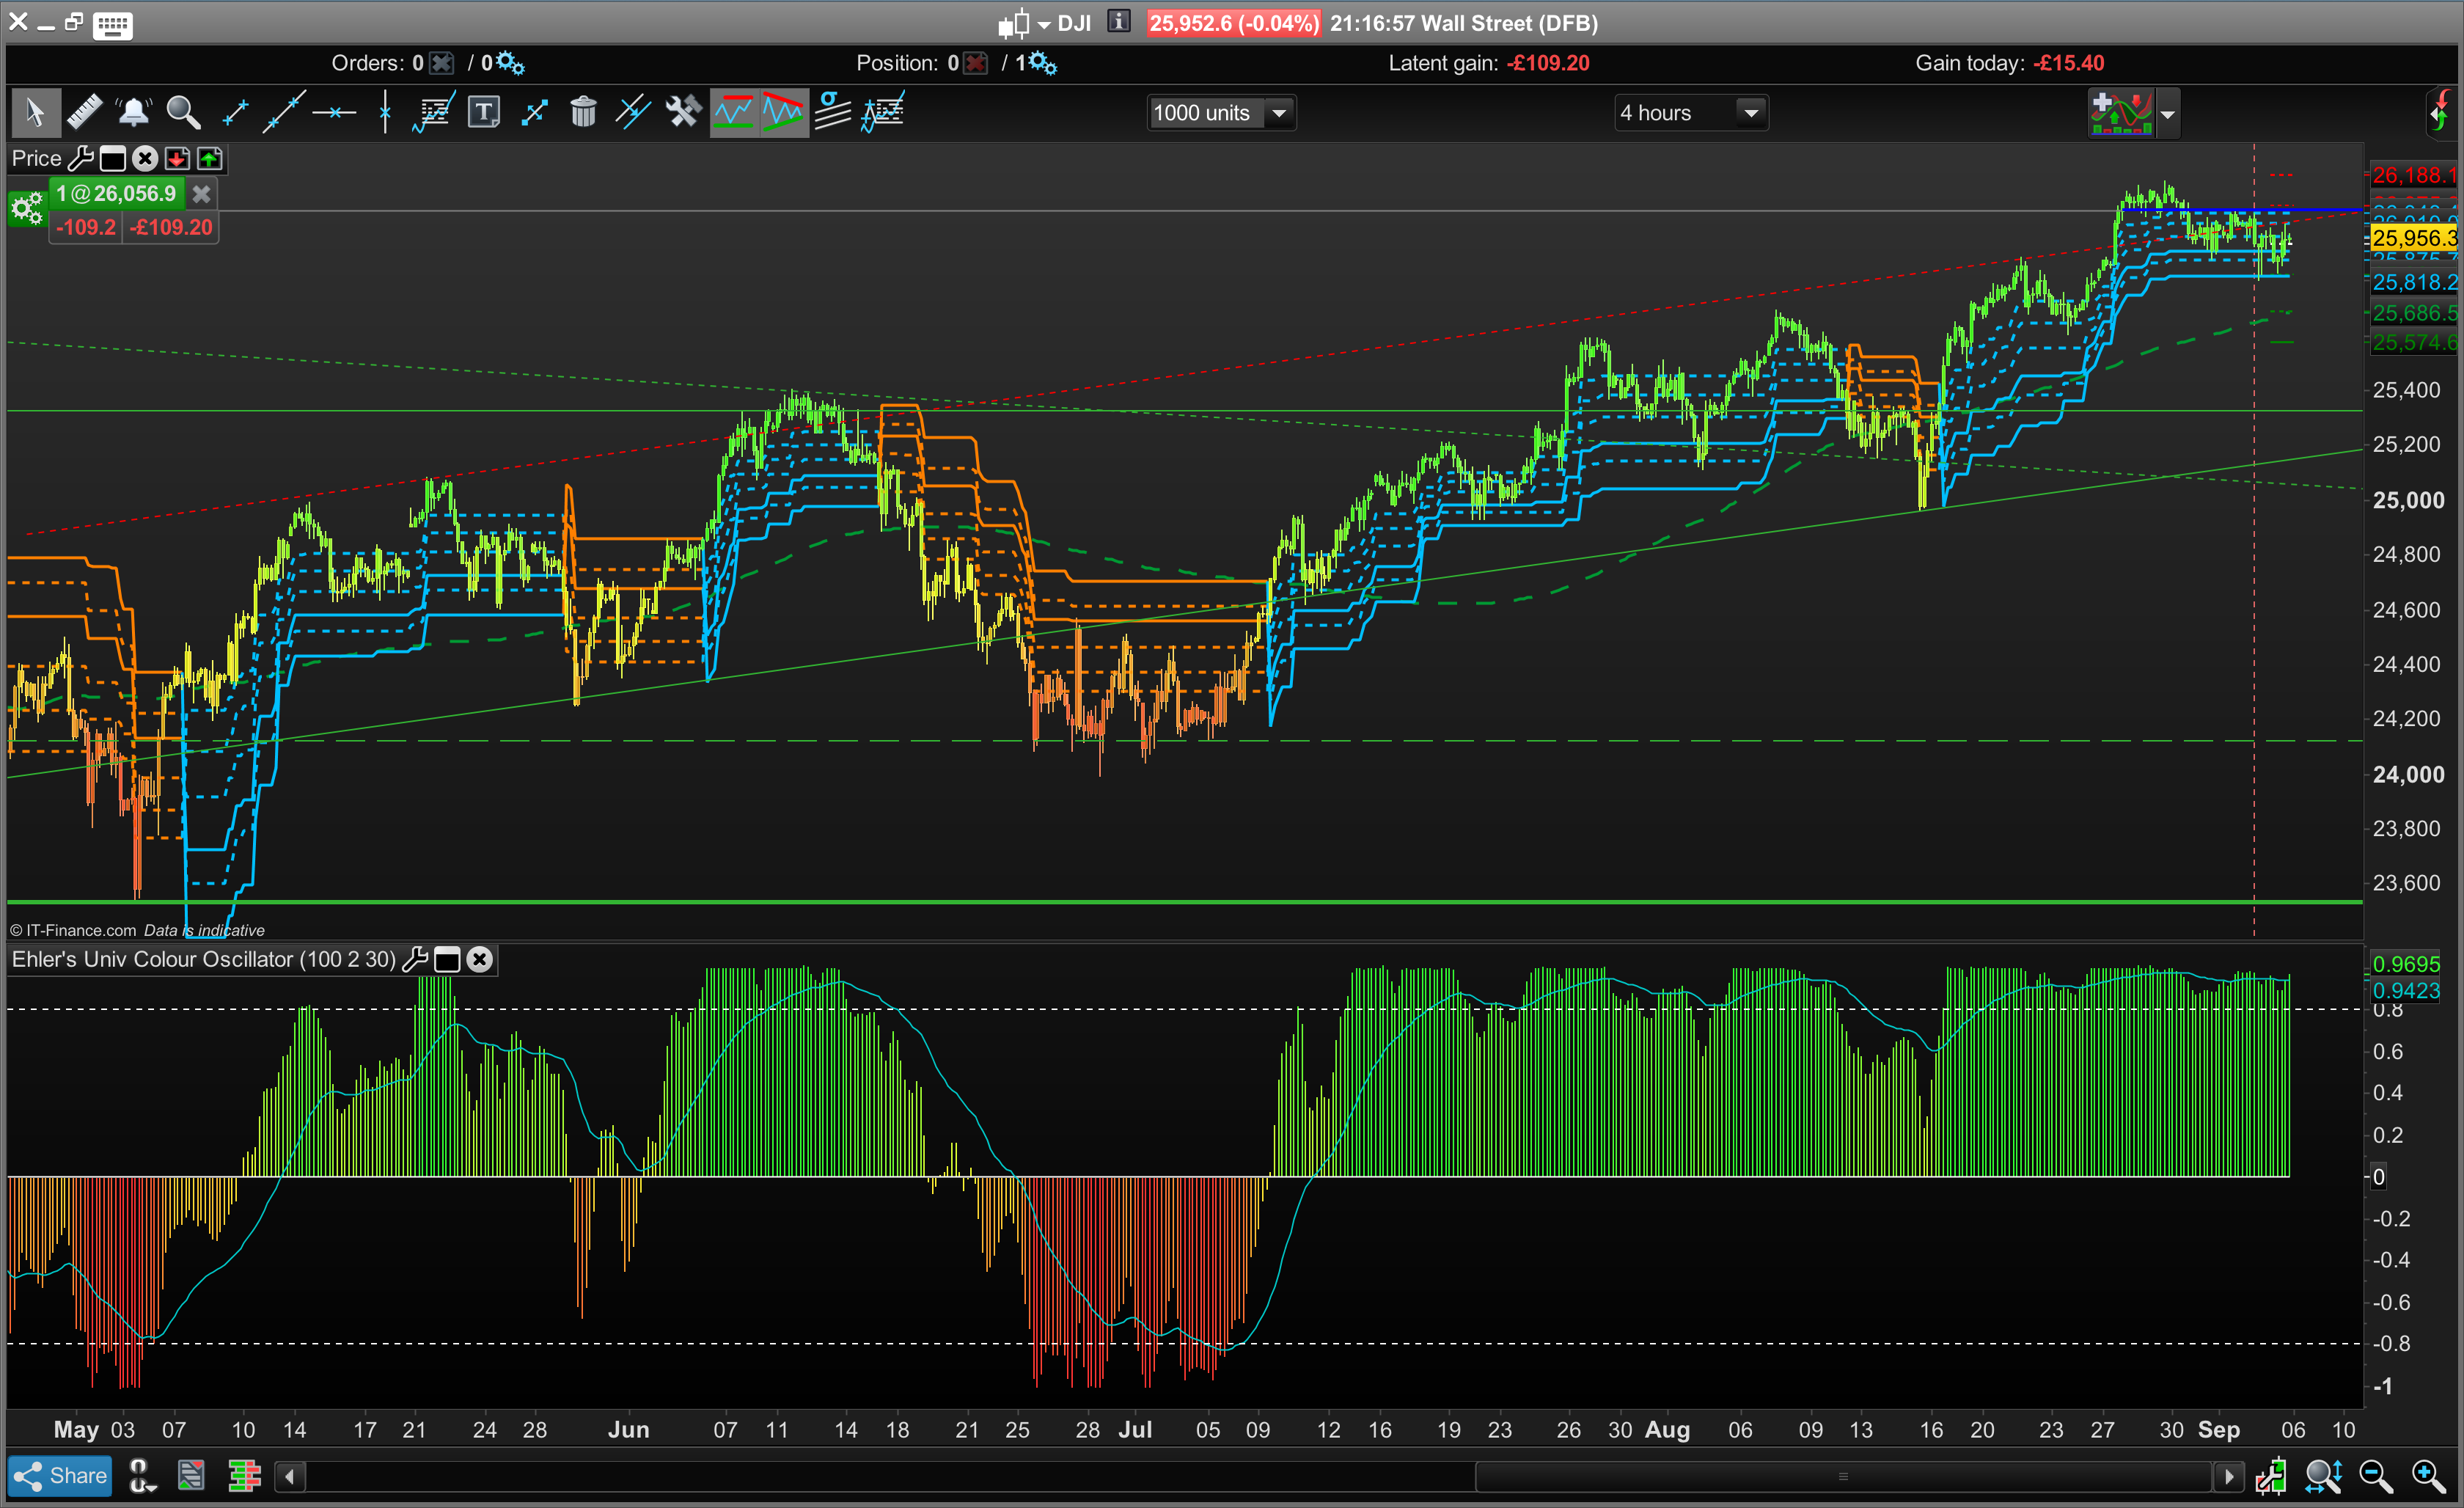
Sorry @Ale, “stand alone indicator at the bottom of a chart” meant: A coloured Kase Peak Oscillator that is fixed to the flat zero line (x-axis) like the original grey histogram version and not floating. I see you’ve kindly already added the KPO to the 3D Candle multi indicator. What a brilliant indicator!
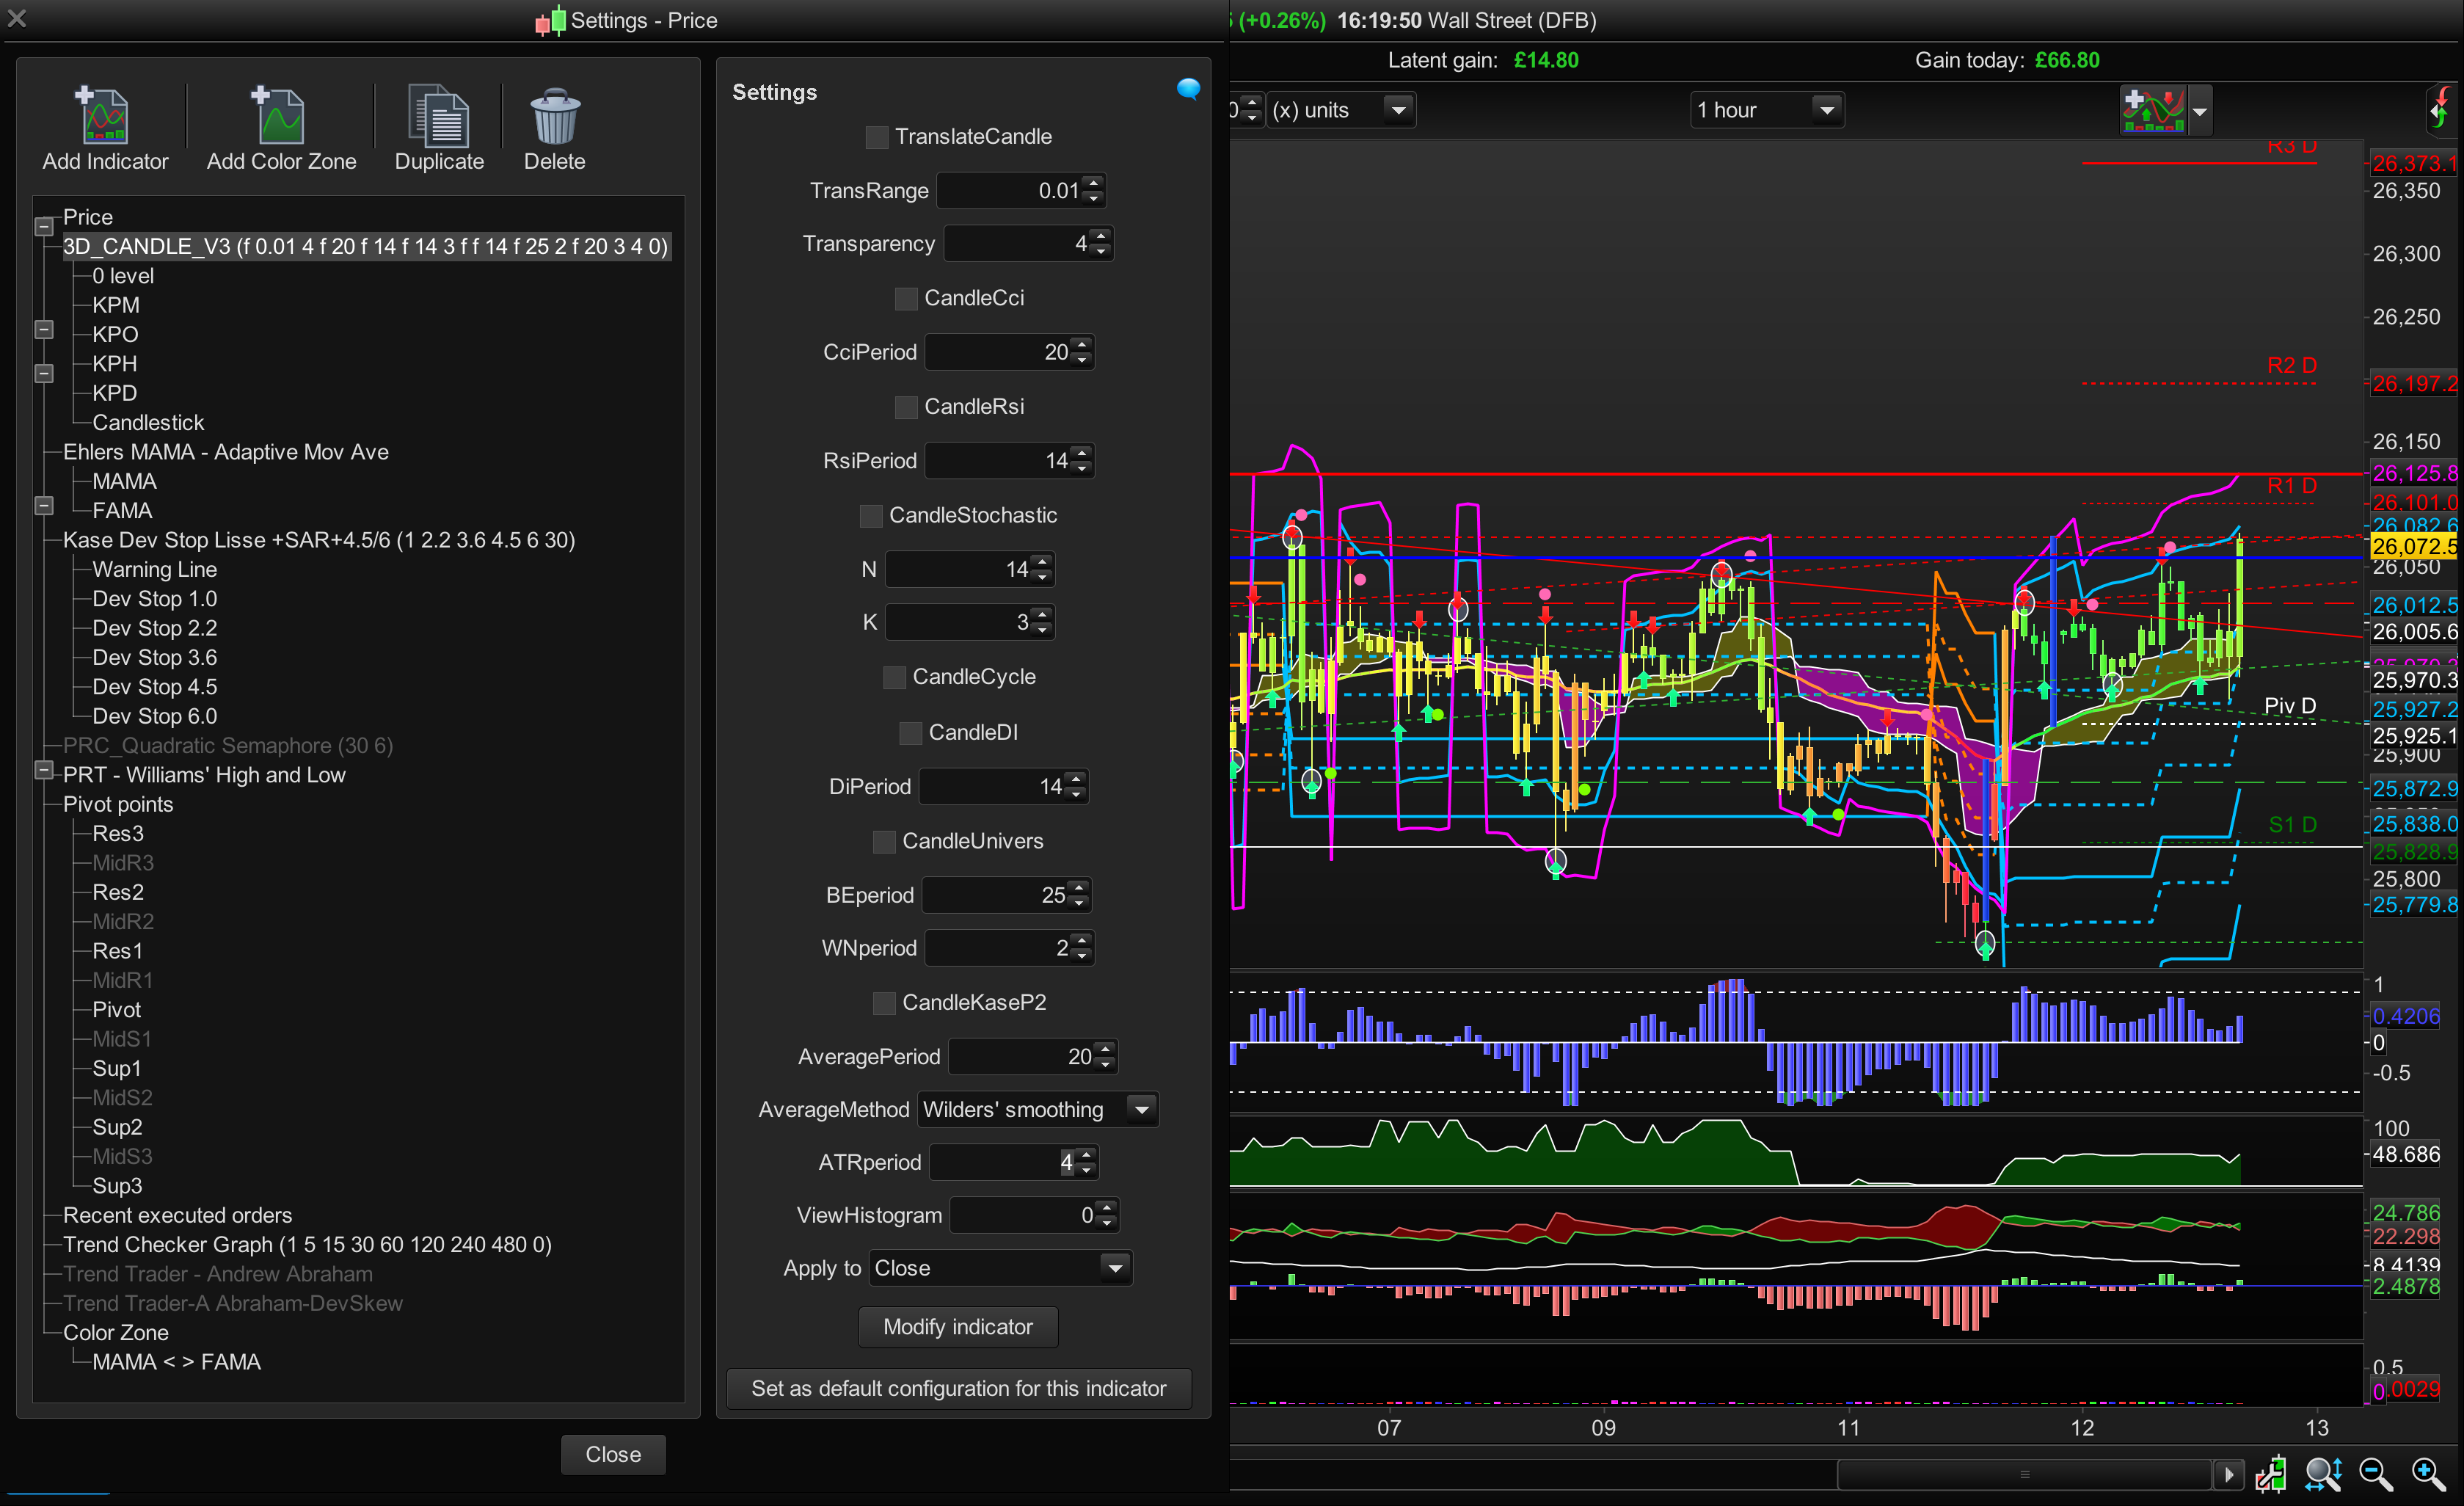
Just one thing, I unselected the CandleKaseP2 tick box but the blue and purple Kase Peak Out Lines are still showing on the Price chart, is the only way to remove them to set the ATR to zero? (pls see image)
Also how did you determine the ATR values for different timeframes though?
And, is it my imagination, or is each histogram/candle shorter in height on the OnChart_KASE_PEAK_OSCILLATOR_2.itf version than the original Kase Peak Osc in the screenshot in post #80183 above?
Once again you’ve done a great job here.
Thanks Bard