I made a modification to my 1-2-3 Pivots Support and Resistance Lines indicator that can be found here:
1-2-3 Pivots Support and Resistance Lines
I’m not sure if it is a significant enough new version for a new library post so I will just post it here and add a link to the original indicators comments (unless Nicolas thinks it should be in the library?)
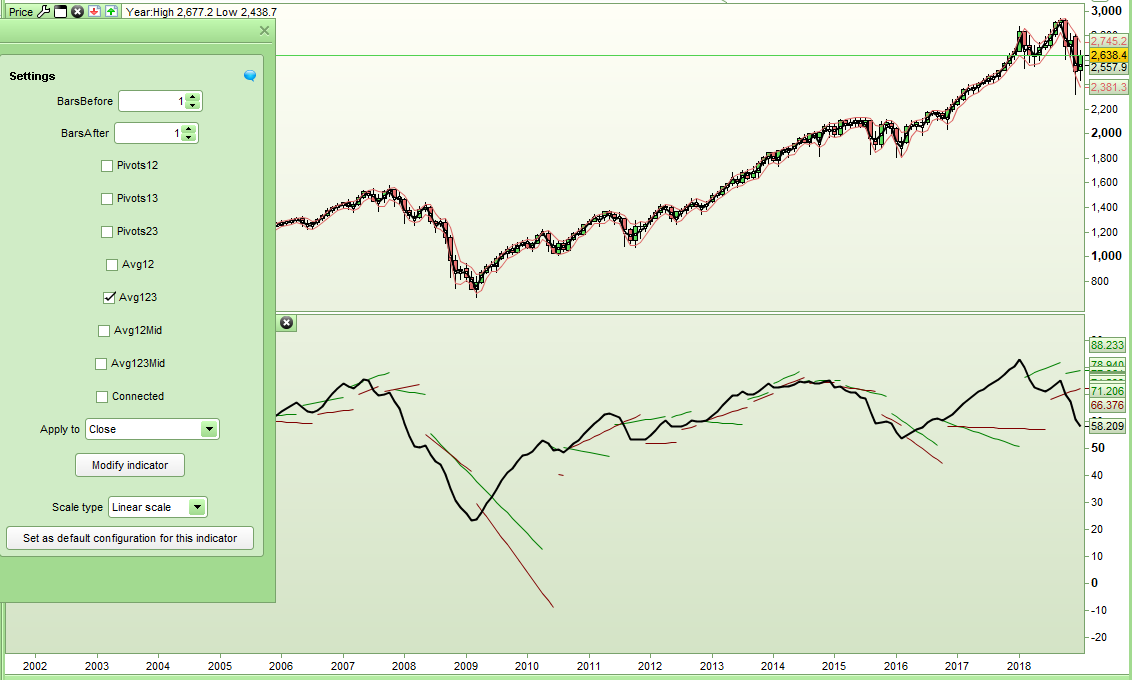
This new version allows you to plot the support and resistance lines (and averages of them) that are based on the last three high and last three low points on to an indicator rather than onto price. Just change the indicator in line 18 to the indicator of your choice. In the example here it is a fast average of RSI[14] but if you want a different indicator then change it to MyIndicator = Stochastic[5,10] for example.
Breakout of support and resistance lines by an indicator can indicate a change of direction or the start of a new trend. The slope of the lines can be used to spot divergence between an indicator and price. Hopefully this new version of my indicator will be useful to someone.
Here is the ITF file:
[attachment file=”Pivots123 Sup Res On Indicator.itf”]
[attachment file=89419]
…and the code:
//Pivots123 Support and Resistance Lies On Indicator
//By Vonasi
//20190123

//DEFPARAM CalculateOnLastBars = 1000

//BarsAfter = 1
//BarsBefore = 1
//Pivots12 = 1
//Pivots13 = 1
//Pivots23 = 1
//Avg12 = 1
//Avg123 = 1
//Avg12Mid = 1
//Avg123 = 1
//Connected = 1

MyIndicator = exponentialaverage[5](RSI[14](customclose)) // Replace the indicator here with the indicator of your choice.

BarLookBack  = BarsAfter + 1
IF MyIndicator[BarsAfter] < lowest[BarsBefore](MyIndicator)[BarLookBack] THEN
IF MyIndicator[BarsAfter] = lowest[BarLookBack](MyIndicator) THEN
Support  = MyIndicator[BarsAfter]
ENDIF
ENDIF
IF MyIndicator[BarsAfter] > highest[BarsBefore](MyIndicator)[BarLookBack] THEN
IF MyIndicator[BarsAfter] = highest[BarLookBack](MyIndicator) THEN
Resistance = MyIndicator[BarsAfter]
ENDIF
ENDIF

cr12 = 0
cr13 = 0
cr23 = 0
cs12 = 0
cs13 = 0
cs23 = 0
csave3 = 0
crave3 = 0
csave2 = 0
crave2 = 0
cave3mid = 0
cave2mid = 0

if pivots12 then
cr12 = 255
cs12 = 255
endif

if pivots13 then
cr13 = 255
cs13 = 255
endif

if pivots23 then
cr23 = 255
cs23 = 255
endif

if avg123 then
crave3 = 255
csave3 = 255
endif

if avg12 then
crave2 = 255
csave2 = 255
endif

if avg123mid then
cave3mid = 255
endif

if avg12mid then
cave2mid = 255
endif

if resistance <> resistance[1] then
hi3 = hi2
hi2 = hi1
hi3index = hi2index
hi2index = hi1index
hi1 = MyIndicator[BarsAfter]
hi1index = BarIndex[BarsAfter]

if not connected then
cr12 = 0
cr13 = 0
cr23 = 0
crave3 = 0
crave2 = 0
cave2mid = 0
cave3mid = 0
endif
endif

if support <> support[1] then
lo3 = lo2
lo2 = lo1
lo3index = lo2index
lo2index = lo1index
lo1 = MyIndicator[BarsAfter]
lo1index = BarIndex[BarsAfter]

if not connected then
cs12 = 0
cs13 = 0
cs23 = 0
csave3 = 0
csave2 = 0
cave2mid = 0
cave3mid = 0
endif
endif

//12
if hi2 > hi1 then
nexthi12 = hi1 - (((hi2 - hi1) / (hi1index - hi2index)) * (barindex - hi1index))
endif

if hi2 < hi1 then
nexthi12 = hi1 + (((hi1 - hi2) / (hi1index - hi2index)) * (barindex - hi1index))
endif

if lo2 > lo1 then
nextlo12 = lo1 - (((lo2 - lo1) / (lo1index - lo2index)) * (barindex - lo1index))
endif

if lo2 < lo1 then
nextlo12 = lo1 + (((lo1 - lo2) / (lo1index - lo2index)) * (barindex - lo1index))
endif

//13
if hi3 > hi1 then
nexthi13 = hi1 - (((hi3 - hi1) / (hi1index - hi3index)) * (barindex - hi1index))
endif

if hi3 < hi1 then
nexthi13 = hi1 + (((hi1 - hi3) / (hi1index - hi3index)) * (barindex - hi1index))
endif

if lo3 > lo1 then
nextlo13 = lo1 - (((lo3 - lo1) / (lo1index - lo3index)) * (barindex - lo1index))
endif

if lo3 < lo1 then
nextlo13 = lo1 + (((lo1 - lo3) / (lo1index - lo3index)) * (barindex - lo1index))
endif

//23
if hi3 > hi2 then
nexthi23 = hi2 - (((hi3 - hi2) / (hi2index - hi3index)) * (barindex - hi1index))
endif

if hi3 < hi2 then
nexthi23 = hi2 + (((hi2 - hi3) / (hi2index - hi3index)) * (barindex - hi1index))
endif

if lo3 > lo2 then
nextlo23 = lo2 - (((lo3 - lo2) / (lo2index - lo3index)) * (barindex - lo1index))
endif

if lo3 < lo2 then
nextlo23 = lo2 + (((lo2 - lo3) / (lo2index - lo3index)) * (barindex - lo1index))
endif

nextloave3 = (nextlo12 + nextlo13 + nextlo23)/3
nexthiave3 = (nexthi12 + nexthi13 + nexthi23)/3
nextloave2 = (nextlo12 + nextlo13)/2
nexthiave2 = (nexthi12 + nexthi13)/2
ave123mid = (nexthiave3 + nextloave3)/2
ave12mid = (nexthiave2 + nextloave2)/2

RETURN nexthi12 coloured(0,128,0,cr12) style(line,1) as "Resistance12", nextlo12 coloured (128,0,0,cs12) style(line,1) as "Support12", nexthi13 coloured(0,128,0,cr13) style(line,1) as "Resistance13", nextlo13 coloured (128,0,0,cs13) style(line,1) as "Support13", nexthi23 coloured(0,128,0,cr23) style(line,1) as "Resistance23", nextlo23 coloured (128,0,0,cs23) style(line,1) as "Support23", nexthiave3 coloured(0,128,0,crave3) style(line,1) as "Resistance Average 1-2-3", nextloave3 coloured (128,0,0,csave3) style(line,1) as "Support Average 1-2-3", nexthiave2 coloured(0,128,0,crave2) style(line,1) as "Resistance Average 1-2", nextloave2 coloured (128,0,0,csave2) style(line,1) as "Support Average 1-2", ave123mid coloured (0,0,255,cave3mid) style(line,1) as "Average Mid 1-2-3", ave12mid coloured (0,0,255,cave2mid) style(line,1) as "Average Mid 1-2", MyIndicator style(line,2) as "My Indicator"