Hi there,
Lately I am having serious doubts about the confidence of the backtest results in PRT. Mainly because I found significant differences in backtests that shouldn´t exist. For instance between real and demo results, in backtest and also in proorder trading. I understand that it´s normal to have some differences but I am talking about serious differences in different systems. Also when I share some systems with a friend that lives in a different timezone, even changing the hours accordingly the difference in results are too high.
Do you experience same kind of things? Because if I can´t belive the backtest results then my systems are worthless
For instance between real and demo results, in backtest
Do you mean differences between Backtest on your Live Platform and Backtest on your Demo Platform? Are both Platforms same settings, time zone and spread etc?
Why not post screen shots of the differences and (better still) post the code so one of us could also backtest on our Live and Demo Platforms and compare with yours?
Just ideas to move your issue forward a bit?
Hi Grahal,
Yes, differences between Live and Demo Platforms. I haven´t checked all my systems, but some of them have small differences and others biggers, with everything the same of course (system, period, spread…)
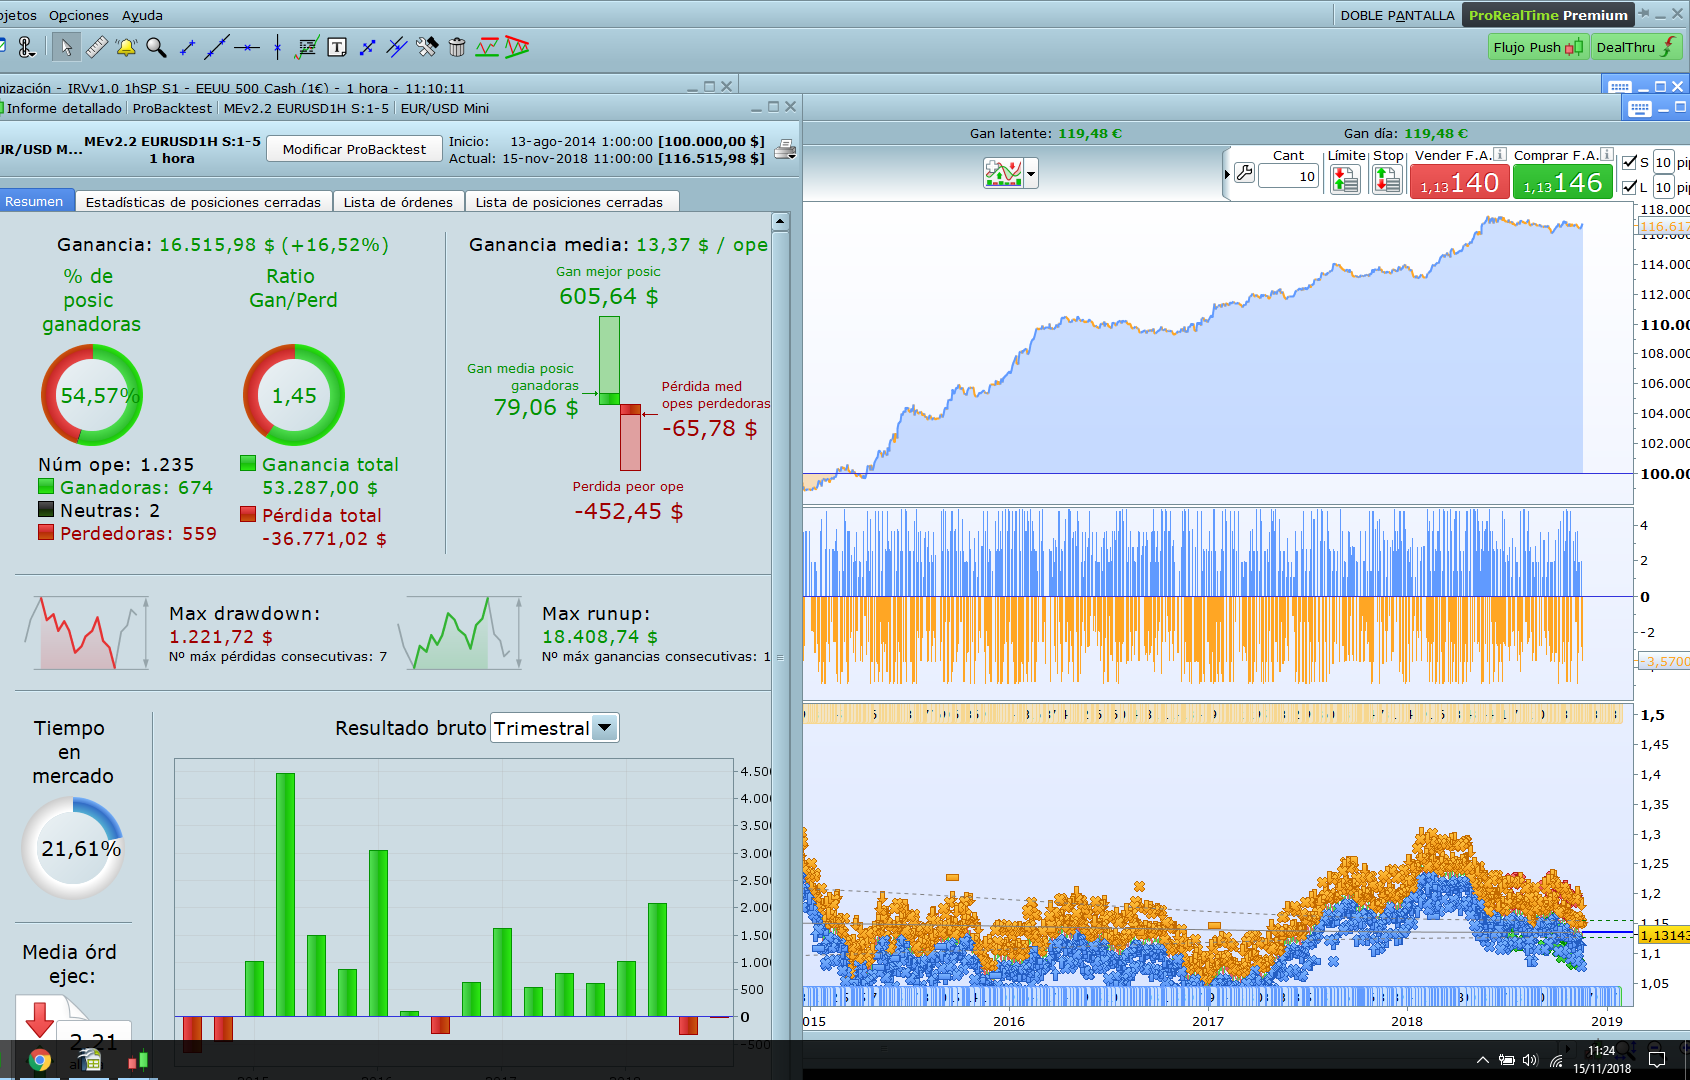
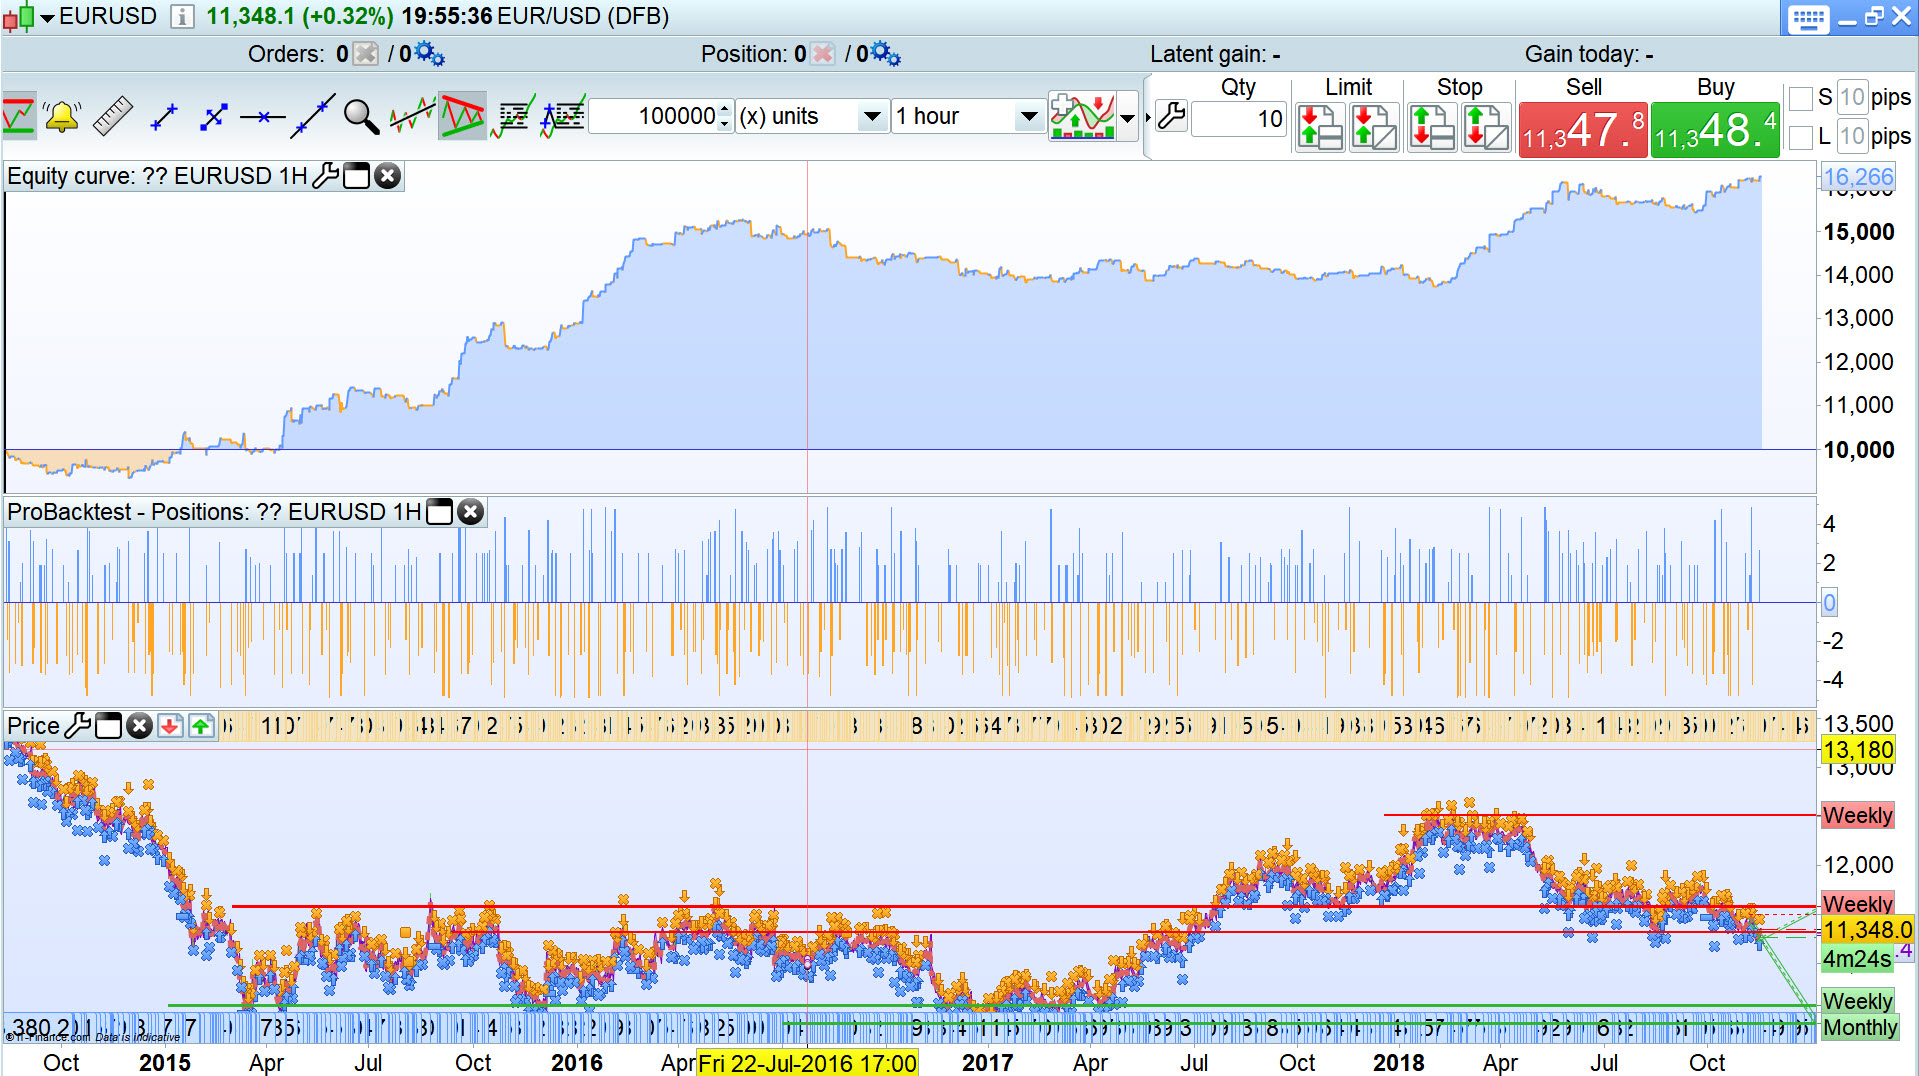
For instance these are the results in Live and Demo for the same system,timezoneperiod/spread…
This is the code and my timezone is UTC+00:00 Europe/London
///Sistema ME (Market Edge)
//EURUSD 1H v2.2
//Por TempusFugit
//Ultima revisión: 14-11-2018
////////////////////////////////////////////////
// System parameters
DEFPARAM CumulateOrders = False
DEFPARAM PRELOADBARS = 2000

//VARIABLES
HL = 16 //Hora Entrada Largos
HLS = 20 //Hora Salida Largos
HS = 7 //Hora Entrada Cortos
HSS= 13//Hora Salida Cortos
LongStopPercentage = 0.65
LongProfitPercentage = 1.1
ShortStopPercentage = 1.9
ShortProfitPercentage = 0.65
RSL = 85//LIMITE PARA FILTRO RSI-MOMENTUM LARGOS
RSS = 70//LIMITE PARA FILTRO RSI-MOMENTUM CORTOS
m = 7 //PRIMERA CIFRA DEL MACD PARA FIJAR TENDENCIA
XMACD = -0.25 //LIMITE VALOR MACD PARA FILTRAR TENDENCIA

// GESTION POSICION
POSITIONSIZEINCREASE = 1.4//MULTIPLICADOR PARA TODAS LAS POSICIONES.
RSIMAXSIZE = 1.6//Max incremento posicion por RSI-Momentum
SHORTINCREASE = 1//Multiplicador para posiciones cortas
LIMITEPERDIDAS = 99999 //SI LLEGA A ESTA CANTIDAD DE PERDIDAS EL SISTEMA SE PARA
REDUCIRPOSICION = 0.75 //MULTIPLICADOR DE LA POSICION SI EL BENEFICIO ESTA POR DEBAJO DE SU MEDIA
NMAPS = 500 //PERIODOS DE LA MEDIA PARA CALCULAR SI SE REDUCE POSICION. MAYOR O MENOR SEGUN LO ACTIVO QUE SEA EL SISTEMA Y DEL TIMEFRAME
PERCENTCROSSMA = 0 //PORCENTAJE QUE TIENE QUE SUPERAR EL SPROFIT A SU MEDIA PARA REDUCIR LA POSICION


IF STRATEGYPROFIT<-LIMITEPERDIDAS THEN
QUIT
ENDIF

//CALCULO SOBRECORMPRA/SOBREVENTA
OVERBOUGHT = RSI[2](close)>RSL
OVERSOLD = RSI[2](close)<100-RSS

//CALCULO TENDENCIA ALCISTA/BAJISTA
b = round(m*26/12)
c = round(m*9/12)
NOBEAR = MACDline[m,b,c](close)>XMACD/100
NOBULL = MACDline[m,b,c](close)<-XMACD/100

//////////////////POSITION SIZE\\\\\\\\\\\\\\\\\\\\\\
//Position Size by WeekDay.Media de 1.5 por día
IF CurrentDayOfWeek=1 THEN
LPDAY=0
SPDAY=1
ELSIF CurrentDayOfWeek=2 THEN
LPDAY=1
SPDAY=0
ELSIF CurrentDayOfWeek=3 THEN
LPDAY=1.9
SPDAY=1.9
ELSIF CurrentDayOfWeek=4 THEN
LPDAY=1.8
SPDAY=1.8
ELSIF CurrentDayOfWeek=5 THEN
LPDAY=1.8
SPDAY=1.8
ENDIF

//Position Size by RSI2
XRSI = RSI[2](close)

IF 100-XRSI>=80 THEN
LPSRSI = RSIMAXSIZE
ELSIF 100-XRSI>=70 THEN
LPSRSI = RSIMAXSIZE*0.75
ELSIF 100-XRSI>=60 THEN
LPSRSI = RSIMAXSIZE*0.50
ELSE
LPSRSI=0
ENDIF

IF XRSI>=80 THEN
SPSRSI = RSIMAXSIZE
ELSIF XRSI>=70 THEN
SPSRSI = RSIMAXSIZE*0.75
ELSIF XRSI>=60 THEN
SPSRSI = RSIMAXSIZE*0.50
ELSE
SPSRSI=0
ENDIF

//Cálculo de tamaño de posición
sp = strategyprofit
IF strategyprofit*(1+(PERCENTCROSSMA/100))<Average[NMAPS](sp) THEN
LPOSITIONSIZE = REDUCIRPOSICION*POSITIONSIZEINCREASE*(LPDAY+LPSRSI)
SPOSITIONSIZE = SHORTINCREASE*REDUCIRPOSICION*POSITIONSIZEINCREASE*(SPDAY+SPSRSI)
ELSE
LPOSITIONSIZE = POSITIONSIZEINCREASE*(LPDAY+LPSRSI)
SPOSITIONSIZE = SHORTINCREASE*POSITIONSIZEINCREASE*(SPDAY+SPSRSI)
ENDIF

//////////////CONDICIONES ENTRADA/SALIDA/////////////
LongEntry = Hour=HL
LongEntry = LongEntry AND NOT OVERBOUGHT
LongEntry = LongEntry AND NOBEAR
LongEntry = LongEntry AND DAYOFWEEK<>1
//LongEntry = LongEntry AND close>99999999999

ShortEntry = Hour=HS OR (BARINDEX-TRADEINDEX>4 AND Hour=HS+2)
ShortEntry = ShortEntry AND NOT OVERSOLD
ShortEntry = ShortEntry AND NOBULL
ShortEntry = ShortEntry AND DAYOFWEEK<>2
ShortEntry = ShortEntry AND DAY<>1 AND DAY<>2 AND DAY<>24 AND DAY<>29 AND DAY<>31
//ShortEntry = ShortEntry AND close>99999999999

IF LongEntry  THEN
BUY LPOSITIONSIZE CONTRACTS AT close LIMIT
SET STOP LOSS LongStopPercentage*CLOSE/100
SET TARGET PROFIT LongProfitPercentage*CLOSE/100
ENDIF

If LongOnMarket AND Hour>=HLS THEN
SELL AT close LIMIT
ENDIF

IF ShortEntry THEN
SELLSHORT SPOSITIONSIZE CONTRACTS AT close LIMIT
SET STOP LOSS ShortStopPercentage*CLOSE/100
SET TARGET PROFIT ShortProfitPercentage*CLOSE/100
ENDIF

IF ShortOnMarket AND Hour>=HSS THEN
EXITSHORT AT close LIMIT
ENDIF
I forgot… for EUR/USD 1h, spread 0,9
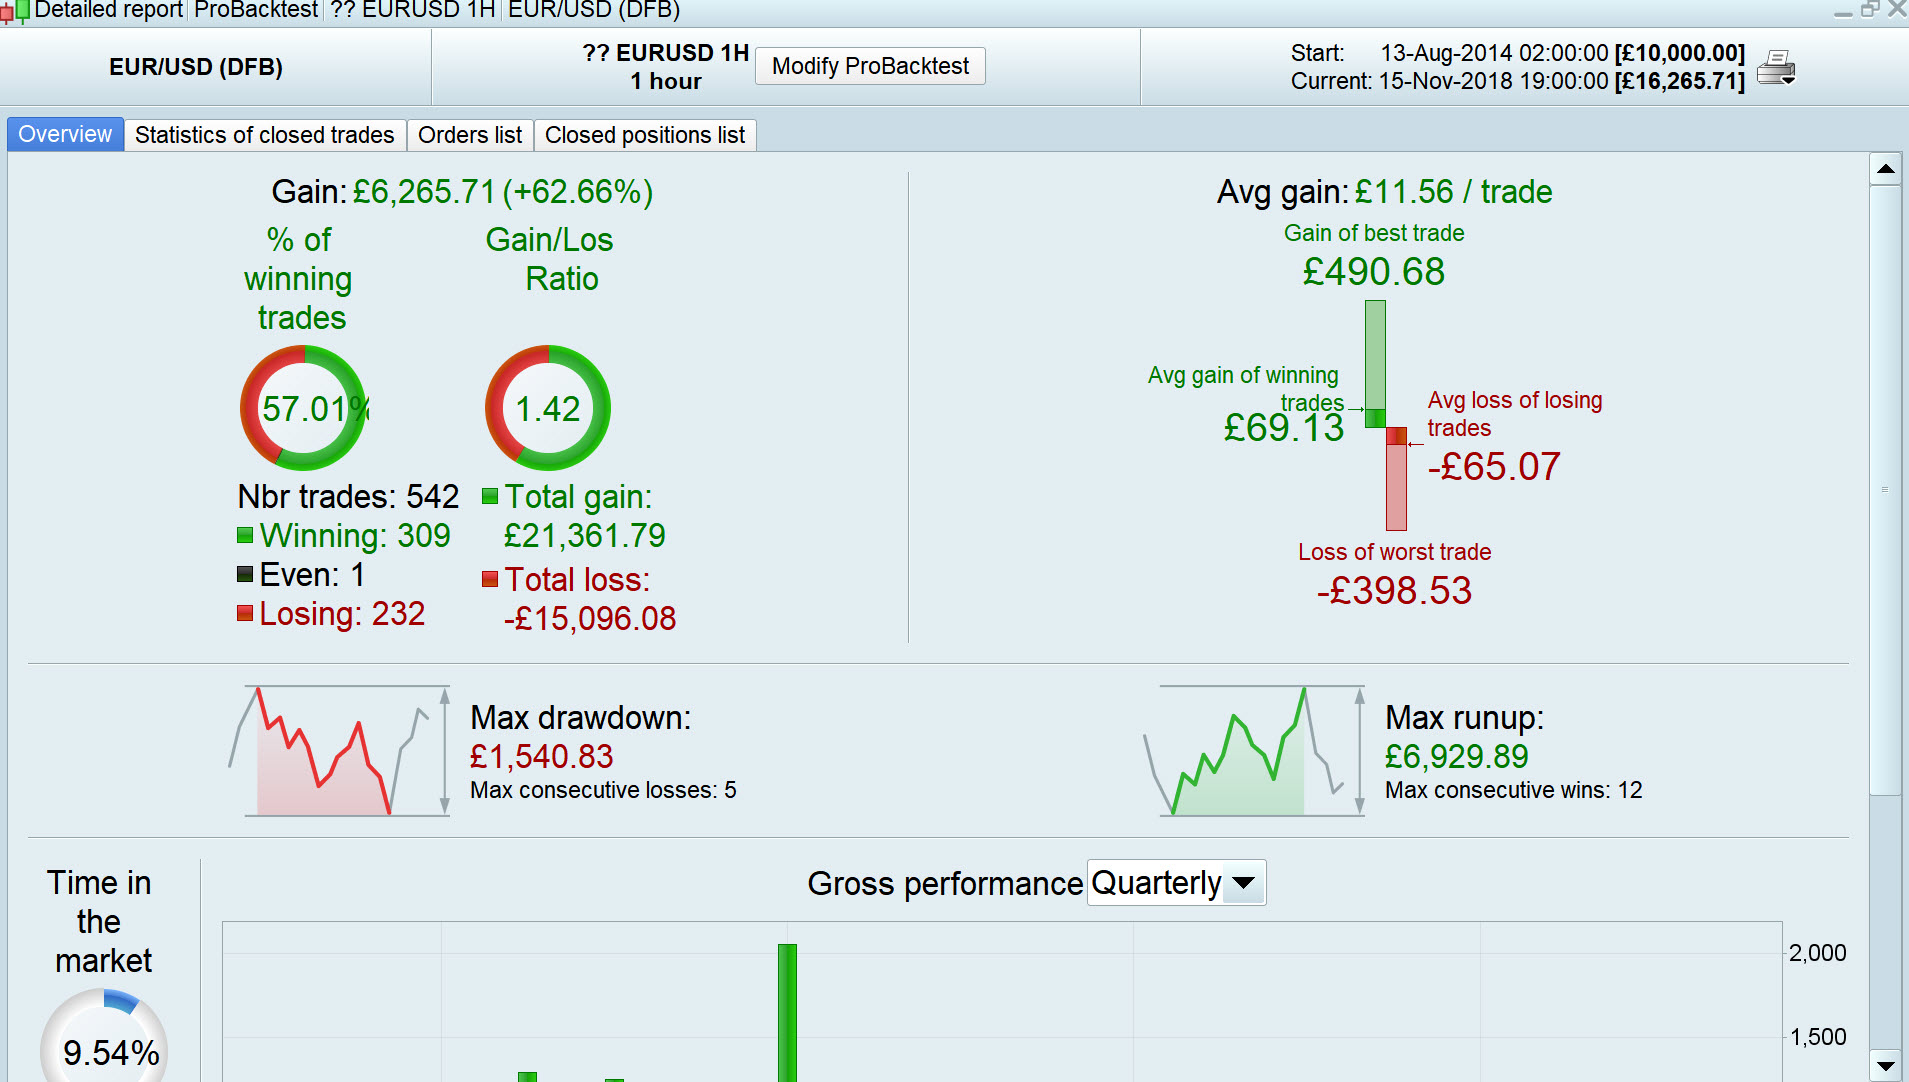
On my Demo Platform on EURUSD 1H with spread = 0.9 100k bars I get results attached … number of trades < half what you get!
The plot thickens, I am thinking what might be the reason.
I cannot test on Live sorry as I have my Live Platform disabled.
Because of these inconsistencies now I am running some systems both in Demo and Live at the same time and as expected there are some differences in the results of the trades (no exactly the same prices of entry/exit –> normal/expected) but also a few trades that doesn´t match between Live/Demo (WHY???). Very few days running both systems so I can tell yet how often or if it occurs only in some systems but I can tell that it happens.
Am I the only one with these inconsistencies?
Am I the only one with these inconsistencies?
I doubt it very much, but others are not checking the same inconsistency that you are?
We are all trying to deal with other inconsistencies … roll on Version 11.3 and this will be all behind us (I bet NOT!? 🙁 )
I see clearly at same period GraHal differences between demo and live in orders.
meaning it’s opening a buy while the criteria not match. Demo works fine…