I have developed an indicator using v10.3, very simple, but its my first one!
what i am trying to do is now create the screener, however its not coming back with what i would expect. I want to screen new breakouts, so where the condition today exists, whereas yesterday it didn’t. although weekly, so this week vs last week
here is the screener:
myMSI2 = call MSI2
Con1 = myMSI2 = 1 and myMSI2[1] = 0.5

screener[con1]
the indicator is here
MyHigh = Highest[20](high)
MyLow = Lowest[40] (low)
//Ichimoku
Tenkansen = (highest[9](high)+lowest[9](low))/2
Kijunsen = (highest[26](high)+lowest[26](low))/2
SpanA = (tenkansen[26]+kijunsen[26])/2
SpanB = (highest[52](high[26])+lowest[52](low[26]))/2
//MA Settings
MyMA = WilderAverage[30](close)


Long1 = High>MyHigh[1]
Long2 = close > SpanA and close > SpanB
Long3 = Close>Close[1] and close>MyHigh[1]
Long4 = Close>MyMA
Stage2 = Long1 and Long2 and Long3 and Long4

Stage3 = Close<MyMA and Direction[1]=1

Short1 = Close<MyLow[1]
Short2 = close < SpanA and close < SpanB
Short3 = Close<Close[1] and close<MyLow[1]
Stage4 = Short1 and short2 and short3

Stage1 = Close>MyMA and Direction[1]=-1

if stage2 then
direction=1
elsif stage3 then
direction=0.5
elsif stage4 then
direction=-1
elsif stage1 then
direction=-0.5
endif

return direction as "MSI"
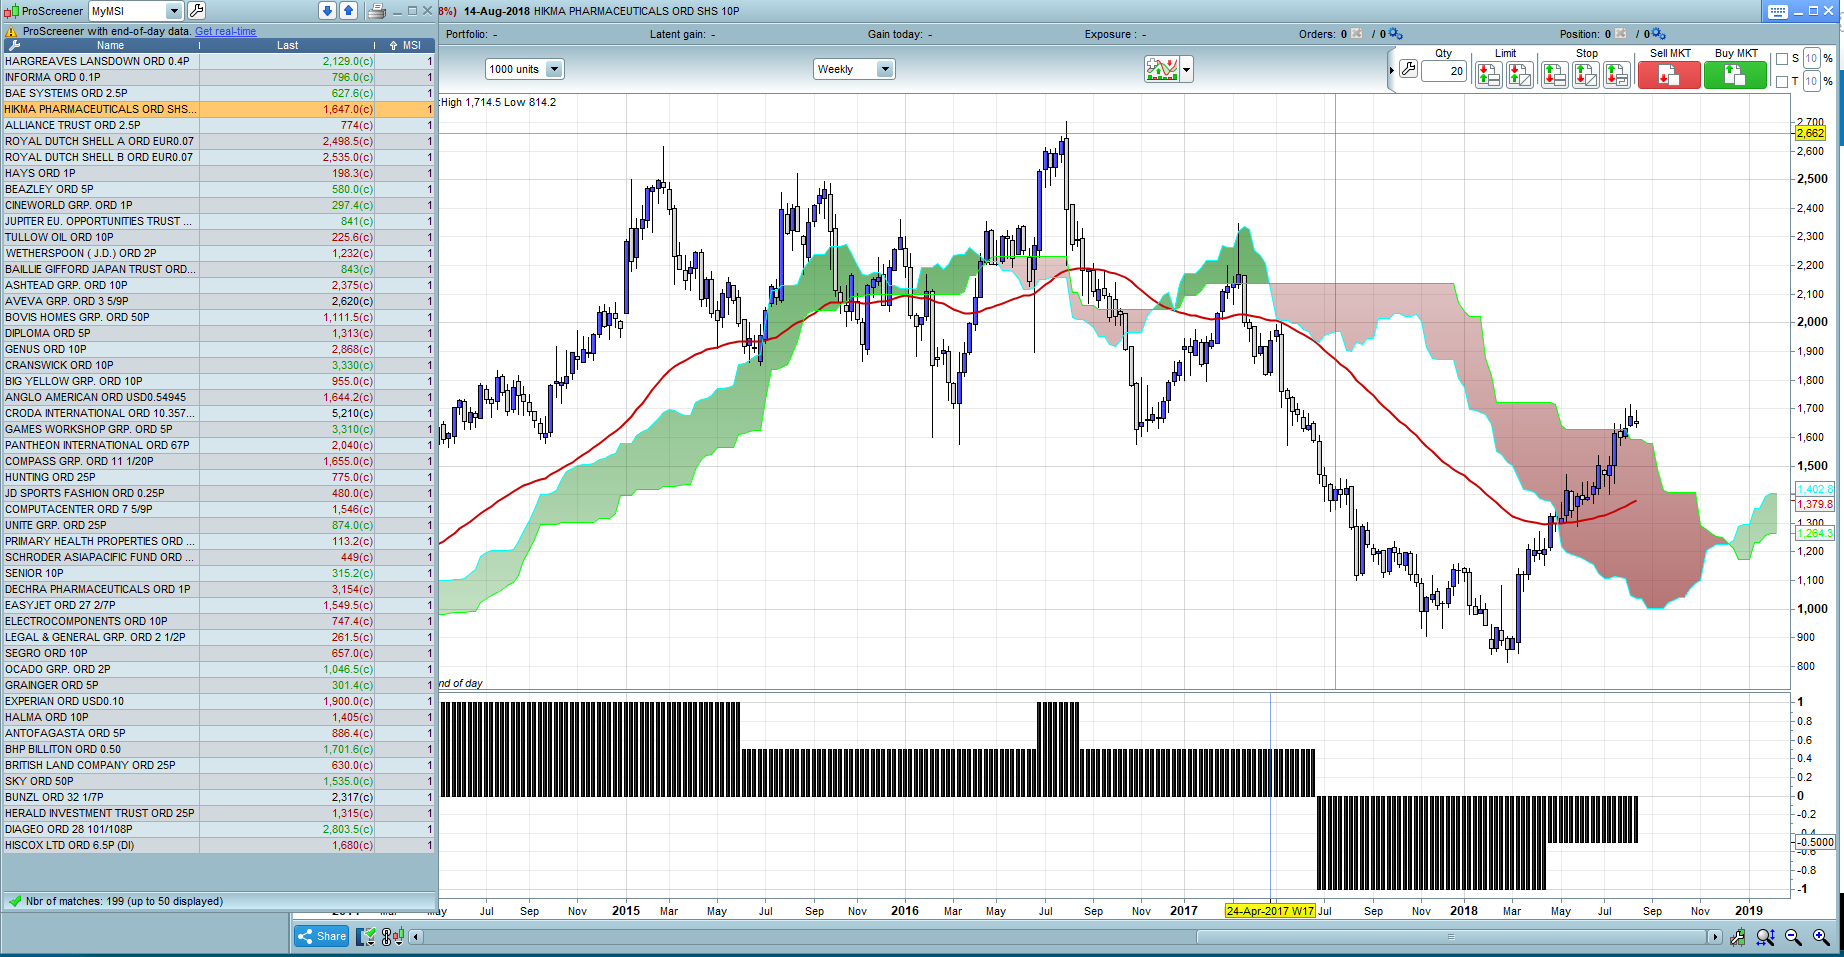
the indicator when plotted has a 1,0.5, -0.5 or -1 value. Im just trying to pick up the 1 where last week it wasn’t however im getting back items where there is no 1 but still 0.5
[attachment file=78038]
could someone help where im going wrong?
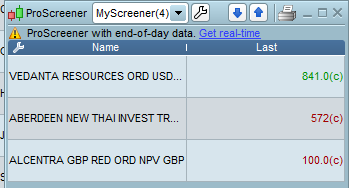
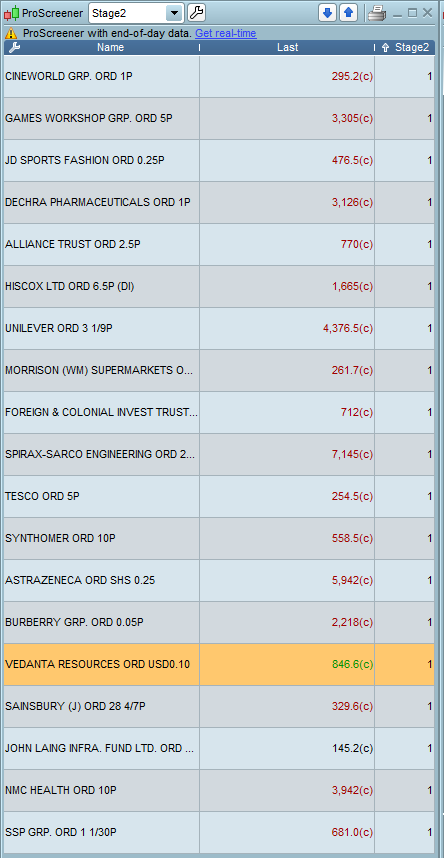
If I run the screener on the predefined UK stocks list, using the weekly selection criteria my results are attached:
none of them fit the criteria of the screener.
Does ProRealTime just not like the weekly criteria?[attachment file=”screener results.PNG”]
It works, but only few results are returned.
Try to san ALL instruments to see how many results you get, in different TFs.
I suggest that you use your indicator as a strategy and debug it with ProOrder, changing GRAPHed variables to watch all of them:
MyHigh    = Highest[20](high)
MyLow     = Lowest[40](low)
//Ichimoku
Tenkansen = (highest[9](high)+lowest[9](low))/2
Kijunsen  = (highest[26](high)+lowest[26](low))/2
SpanA     = (tenkansen[26]+kijunsen[26])/2
SpanB     = (highest[52](high[26])+lowest[52](low[26]))/2

//MA Settings
MyMA      = WilderAverage[30](close)

Long1     = High>MyHigh[1]
Long2     = close > SpanA and close > SpanB
Long3     = Close>Close[1] and close>MyHigh[1]
Long4     = Close>MyMA

Stage2    = Long1 and Long2 and Long3 and Long4

Stage3    = Close<MyMA and Direction[1]=1

Short1    = Close<MyLow[1]
Short2    = close < SpanA and close < SpanB
Short3    = Close<Close[1] and close<MyLow[1]
Stage4    = Short1 and short2 and short3

Stage1    = Close>MyMA and Direction[1]=-1

if stage2 then
direction=1
elsif stage3 then
direction=0.5
elsif stage4 then
direction=-1
elsif stage1 then
direction=-0.5
endif

graph MyHigh
graph MyLow
graph MyMA
graph close
graph high

buy at -close limit
the last line is a dummy one required by ProOrder.
So I created the probacktest, and graphed the indicator, and it buys and sells exactly where it should
the screener just cant pick up the right information however
I am keeping it nice and simple to just return where the condition is true, in this case where the indicator value is -0.5
it returns a stock where its -1
probacktest works perfectly, just the screener cant work it out
this time I also included everything within the screener rather than “calling” it and still incorrect results
any ideas?
As an indicator it returns all values and they are pletted correctly under the chart.
Using the same code as a screener, simply replacing return with screener:
screener [direction] (direction as "Dir")
only returns 1 and 0.5!
I launched it on a 1-minute TF, to watch any fast update, but I did not see other that 1’s and 0.5’s.
Yes, and when you request to just bring back all with a 1, it brings back -0.5!
I want to look for changes, just as probuilder was able to handle, when direction =1 and direction[1]=0.5
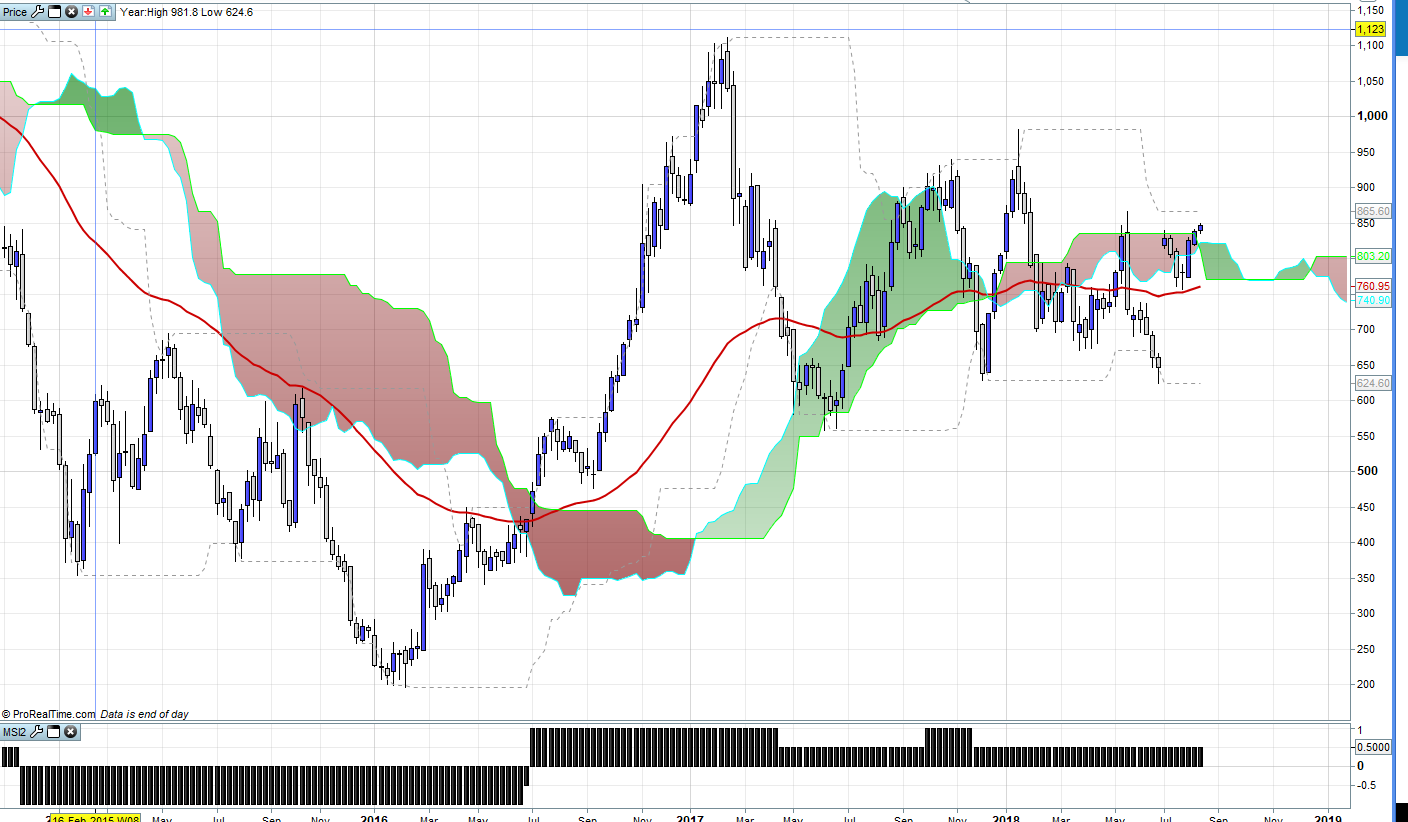
[attachment file=78153]
here the screener thinks I’m on a 1, whereas the indicator shows the correct value, which is -0.5
in fact they all show as 1
[attachment file=78167]
any help would be appreciated
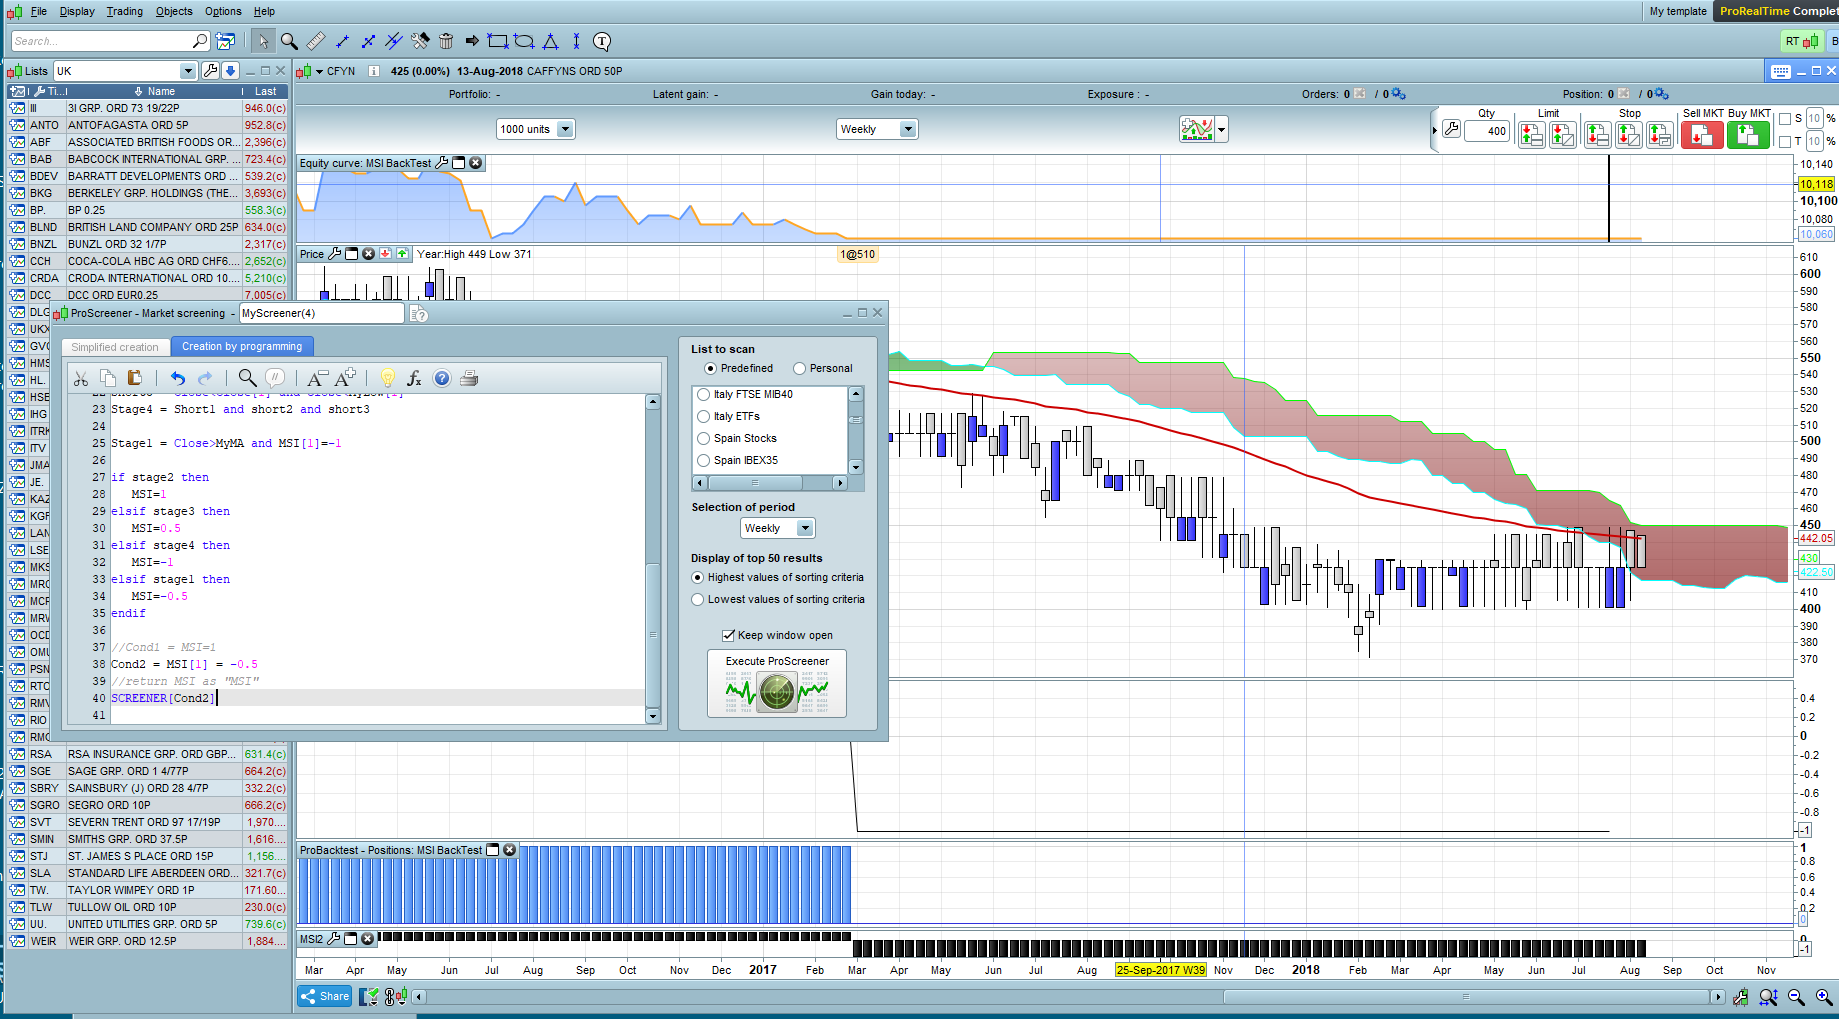
OK, decided to try again and perhaps narrow down where the screener is going wrong and wanted to just test any standard code in case it was my own poor coding being such a novice.
the below screener looks at 4 conditions, and it still brings back incorrect results from standard code
MyHigh = Highest[20](high)
//MyLow = Lowest[40] (low)
//Ichimoku
Tenkansen = (highest[9](high)+lowest[9](low))/2
Kijunsen = (highest[26](high)+lowest[26](low))/2
SpanA = (tenkansen[26]+kijunsen[26])/2
SpanB = (highest[52](high[26])+lowest[52](low[26]))/2
//MA Settings
MyMA = WilderAverage[30](close)


Long1 = High>MyHigh[1]
Long2 = close > SpanA and close > SpanB
Long3 = Close>Close[1] and close>MyHigh[1]
Long4 = Close>MyMA
Stage2 = Long1 and Long2 and Long3 and Long4

SCREENER [Stage2] (Stage2 AS "Stage2")
PRTs screener is not able to bring back the correct results even from standard code
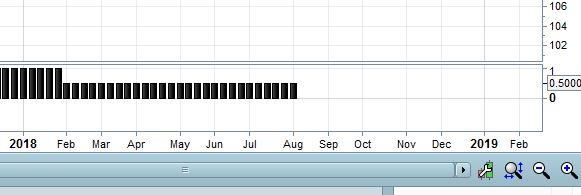
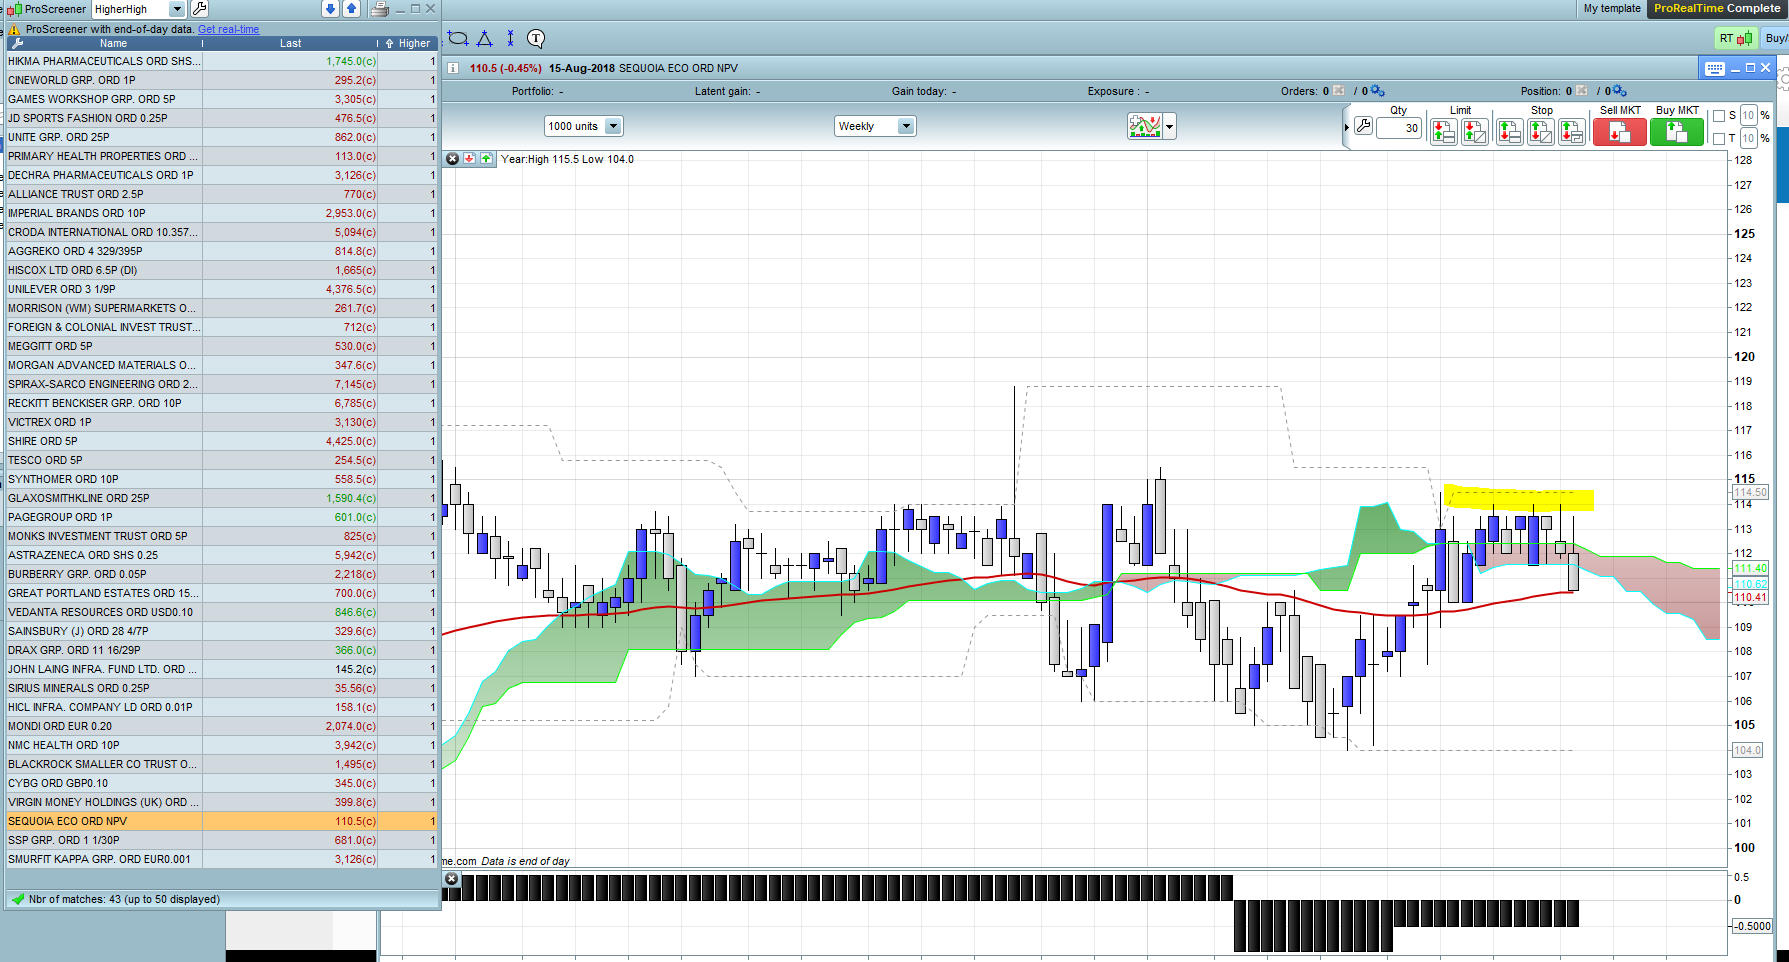
in the attached chart, the high is clearly not greater than last week’s high, so Long 1 isn’t satisfied and Long3 also isn’t satisfied
I’ve overlaid the donchian channel, highest high for 20 periods. it brings back Vedanta as saying its higher than last period, whereas it clearly isnt
so its not certainly not my indicator that is the issue. Nobody else has similar results?
lets make it real simple just one condition..
MyHigh = Highest[20](high)

Long1 = High>MyHigh[1]
SCREENER [Long1] (Long1 AS "Higher")
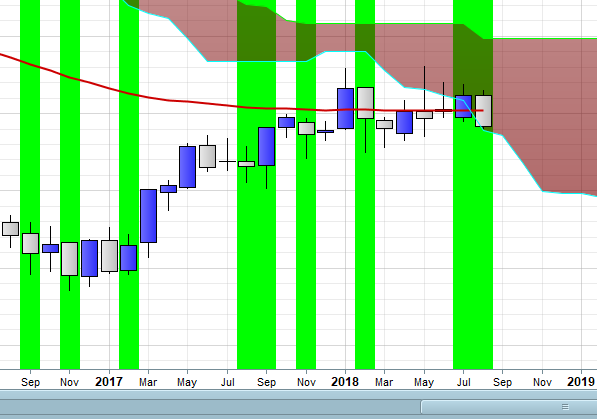
on the weekly screener for predefined UK200 stocks..brings back some very odd results. definitely not higher!
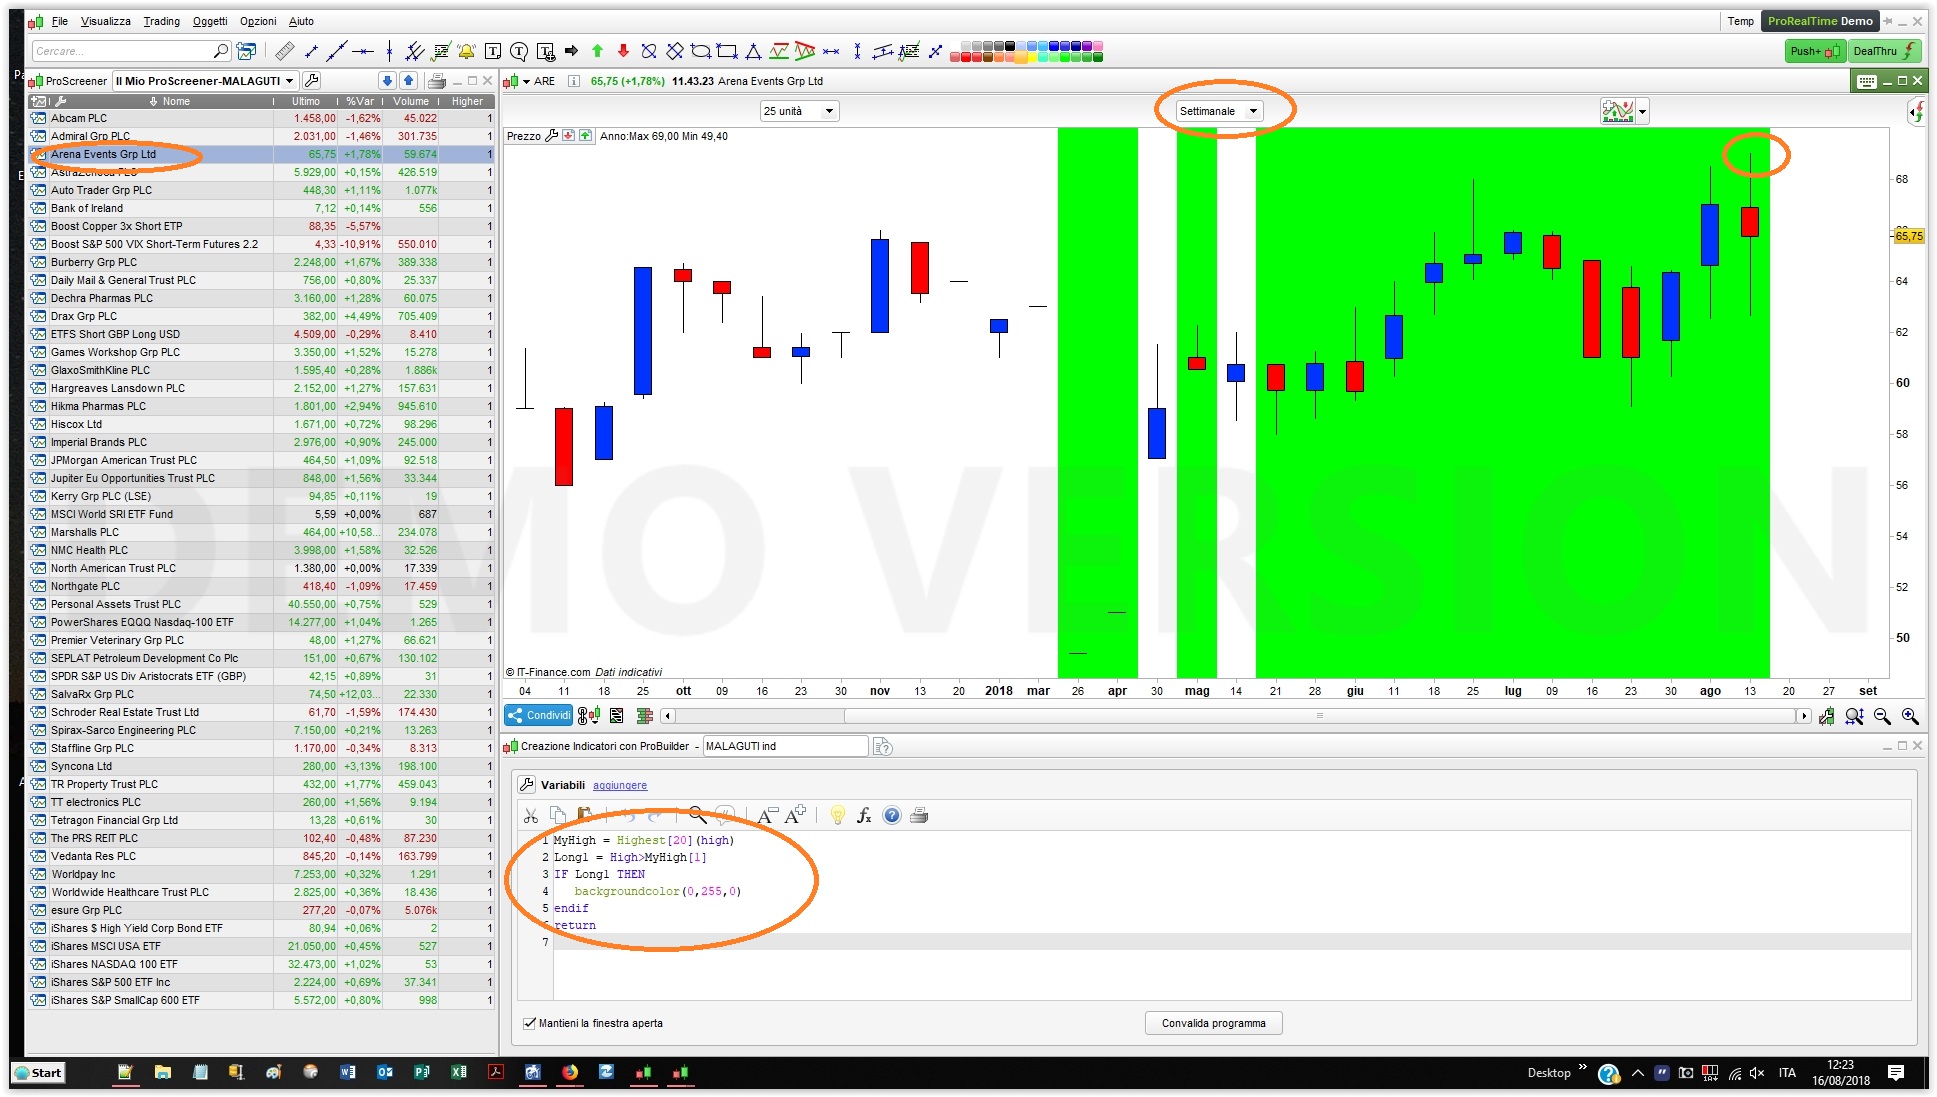
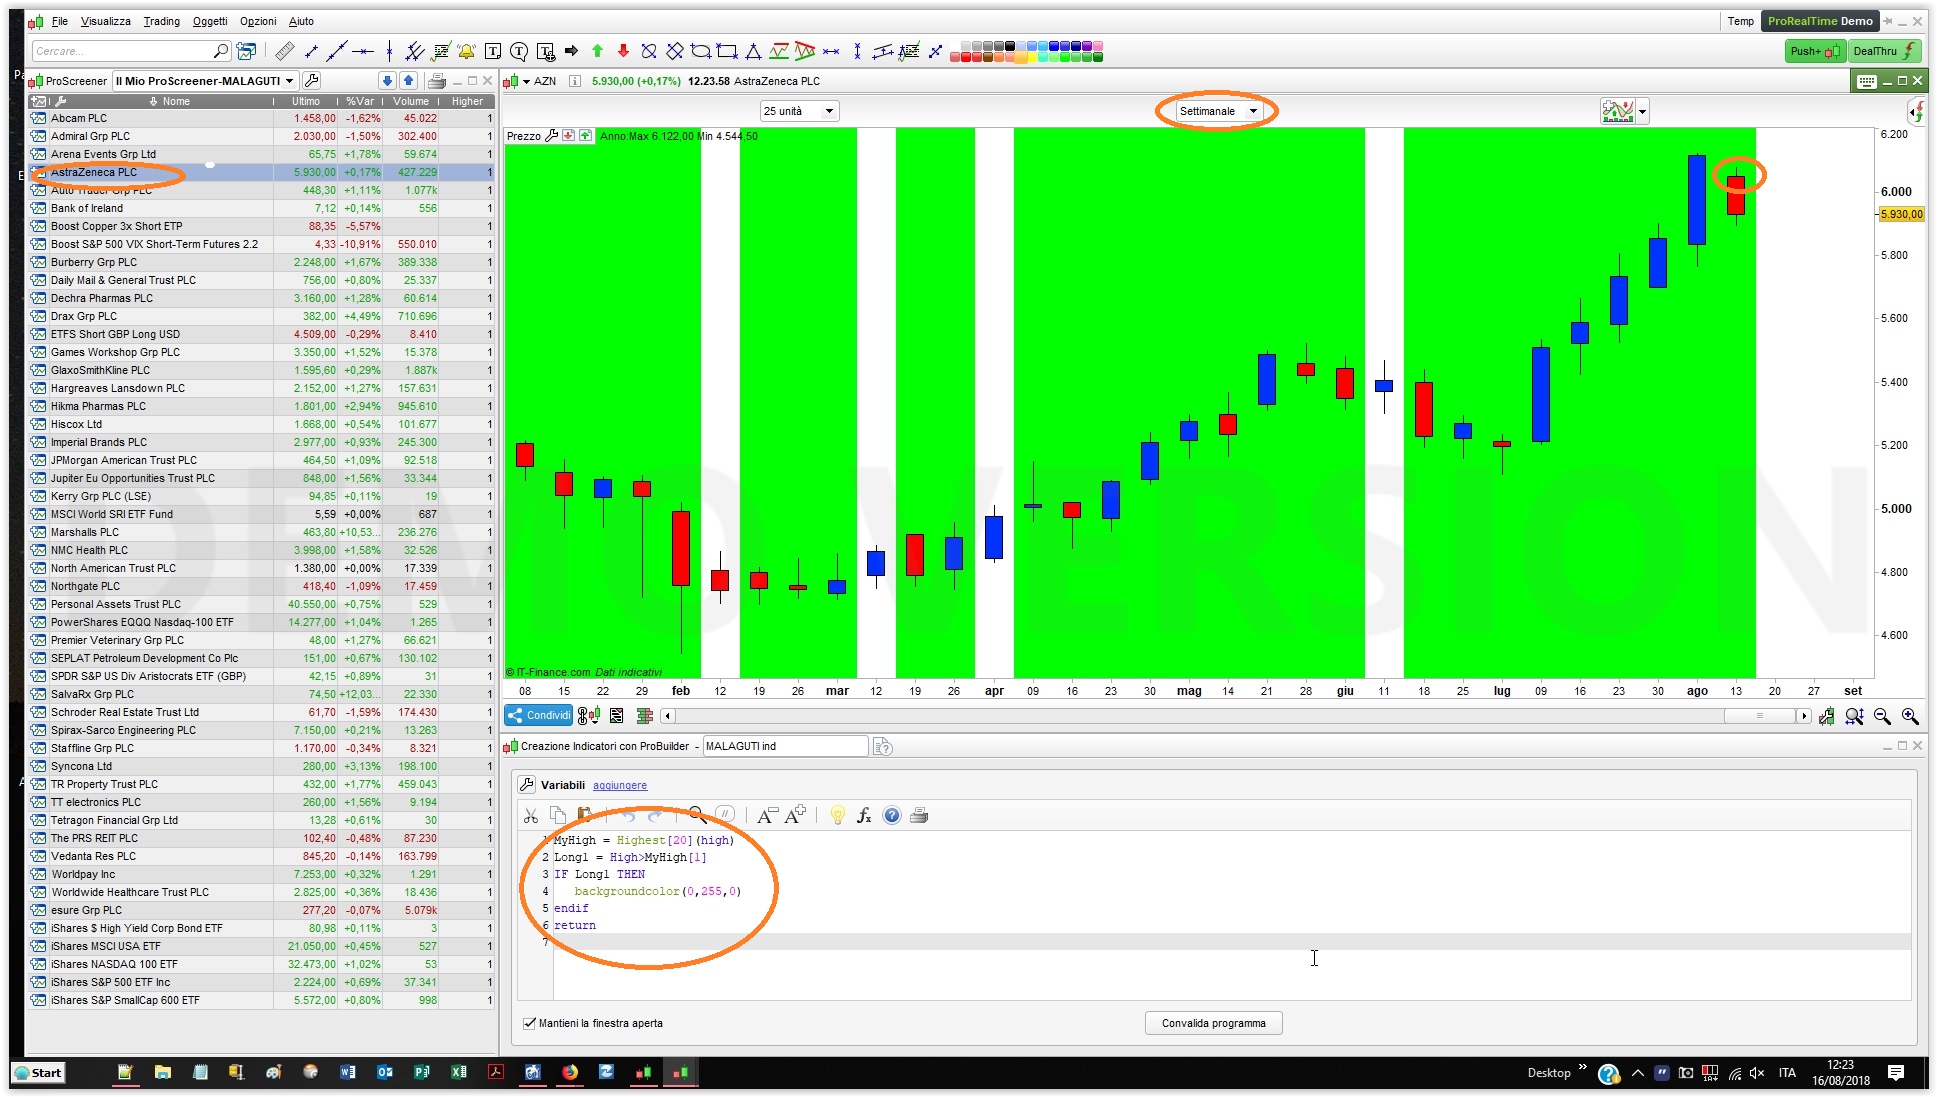
Converting you screener to an indicator colouring the background when the result is true
MyHigh = Highest[20](high)
Long1 = High>MyHigh[1]
IF Long1 THEN
   backgroundcolor(0,255,0)
endif
return
then launching your scan on UK stocks (weekly TF), results can be seen from attached pics, the first one is correct while the second one isn’t.
The only explanation is that you are using end-of-day data, because the screener, as well as the indicator, are both correct if you don’t look at the current bar!
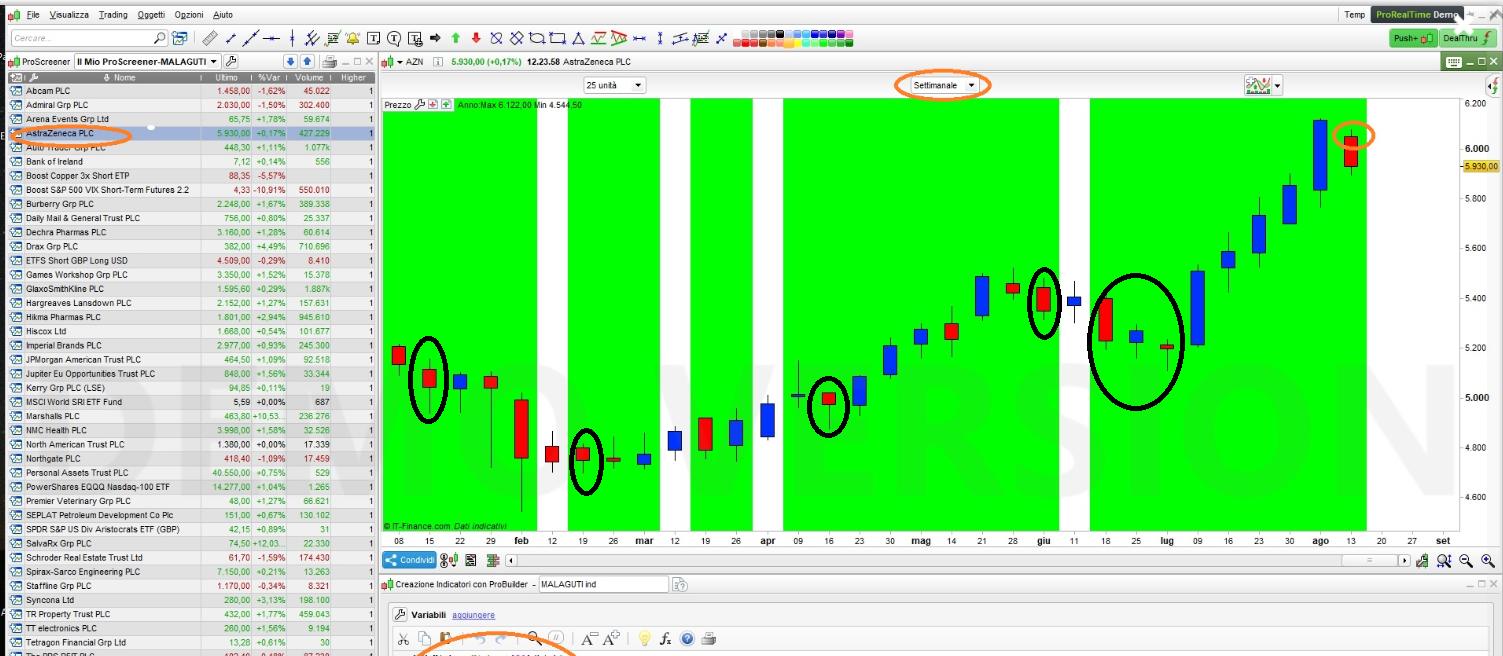
Well… I’m afraid there’s something wrong elsewhere, because that does not explain why in my first screenshot, on July 16th or 23rd…, the background is coloured while there’e no NEW high!
Thanks Roberto, yes I’ve just marked up where it shouldn’t have occurred. It is odd. and I do just use just end of day, as I’m only interested in weekly timeframes
I’ve raised a support ticket but I do appreciate your responses, and at least confirms I’m not losing my mind!
The plot thickens…
Long = low<low[1]
if long then
backgroundcolor (0,255,0)
endif
return long
wanting to check now very very simple indicator checking one high to another or one low to another, I’m finding that PRT isn’t updating the indicator. ie if I switch from one timescale to another I get incorrect results, unless I go into modify an indicator and then choose to re-apply the same indicator. its almost as though when switching that PRT isn’t catching up when switching and reading the code
attachment 1 is supposed to highlight just where the low is lower than last period, compared to the exact same indicator after ive modified the indicator and added the indicator to the chart again.
its the exact same timeframe, same chart, two different results after reapplying
ive tried closing down the indicator, after creating it. but I wonder is this why the screener is coming back with the odd results..