Leo
LeoParticipant
Veteran
Hi all,
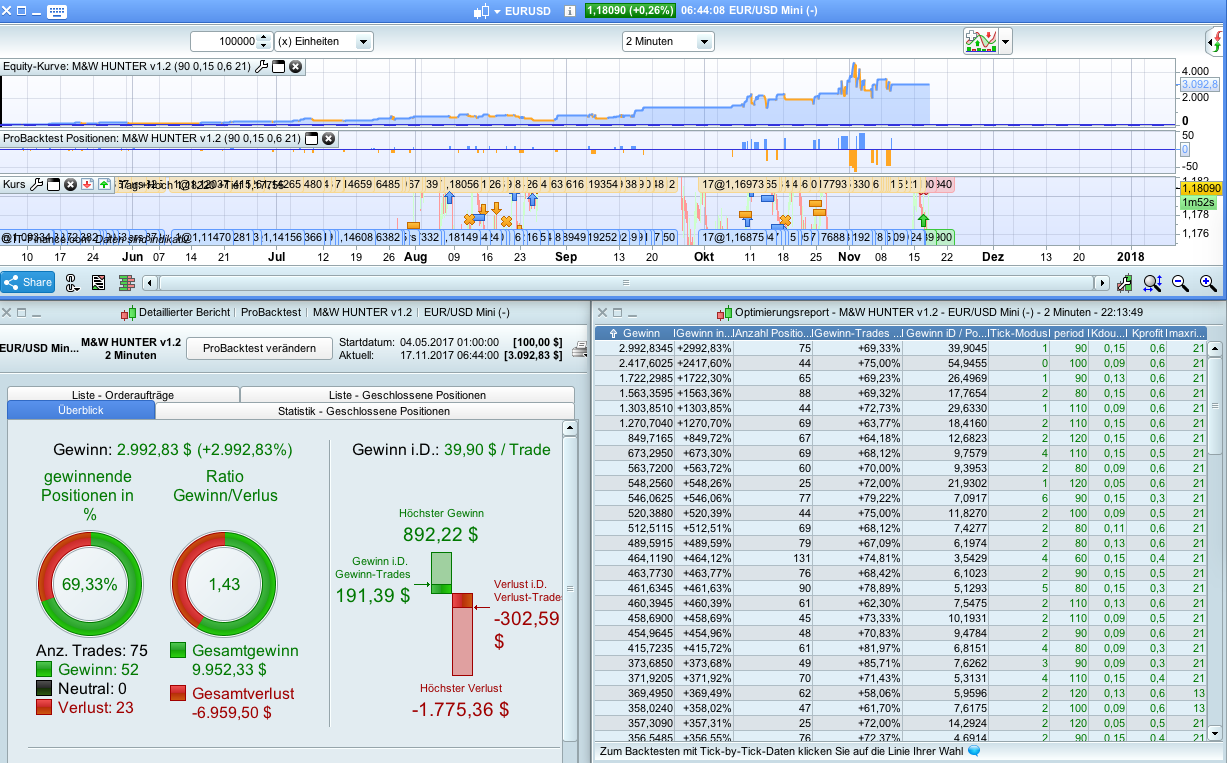
I decide to open a new topic because I need help with the strategy I created using my methodology and my style of algorithmic trading (few money per trade to risk, small time frame, mini contract in IG).
After a while studying the double to and double bottom detected by this code https://www.prorealcode.com/prorealtime-market-screeners/double-top-double-bottom-screener/. I realized that I only know that I don’t know anything.
So here is what I got: I open a long order and a short order just below and above a double top/low. When the order are activated i.e. the double bottom/top is either activated or annulated the market almost always move quickly because (I think) because there are many order placed just in that area.
The strategy take very small profits many often but when it loses…. It loses a lot!
I trade this in real life and winning two out of two but I am not happy because I need two win 4 times for compensate a possible future loss. That’s why I do not upload the strategy to the library.
I hope all of you can help me with this endeavour.
Thanks
//M&W HUNTER
//Autor: LEO

DEFPARAM CumulateOrders = false // Cumulating positions deactivated
DEFPARAM PreLoadBars = 3000 //cargar informacion


//VARIABLES TO BE OPTIMIZED
//PERIOD=20    //Period for analysis
//Kdouble=0.2 //Factor for defining what is double top or bottom
//maxrisk0=13 //pips per trade to risk
//Kprofit=0.5 // proportion of profit target

maxrisk=maxrisk0+(n-1)*2
totalrisk=4*maxrisk*PIPVALUE //for stop the robot if things are going bad

spread=0.7
IF TIME < 060000 THEN //(germany time)
spread=2*spread
ELSIF TIME>213000 THEN //(germany time)
spread=2*spread
ENDIF

//Robot Working Time (Germany)
IF TIME>020000 and TIME < 220000 THEN
ontime=1
ELSE
ontime=0
ENDIF

////// RISK CONTROL IF THINGS ARE GOING WONDERFULL  //////
n = 1 + (strategyprofit / (77*pipvalue))
n = round(n * 100)
n = n / 100
n = max(1,n)


//    >>>>>>>>>   M&W patterns   <<<<<<

WMA=weightedaverage[period](close)

//Smoothed curve of Leo Moving Average
IF BARINDEX > period THEN
smoothWMA=weightedaverage[period](WMA)
ELSE
smoothWMA=undefined
ENDIF

// << Storage of minimums and maximums >>
once mintemp=low
once posmintemp=1
once maxtemp=high
once posmaxtemp=1

IF BARINDEX>2 THEN
// the value 0.7 is to ensure that the donchian channel is faster than the curves analysis (this value to be checked)
IF low < lowest[round(0.75*period)](low[1]) THEN
mintemp=low //minimum temporal
posmintemp=BARINDEX //postition of minimum temporal
ENDIF
IF high > highest[round(0.75*period)](high[1]) then
maxtemp=high //maximum temporal
posmaxtemp=BARINDEX //position maximum temporal
ENDIF
ENDIF

//  << Detecting and locating a local minimums >>
//  Where the WMA is crossing the smoothed WMA, there is a maximum or minimum nearby
//  If there is a new local min/max, the preivus one is stored in de varible B... (before)
once LEVMIN=low
once POSLEVMIN=1
once LEVMAX=high
once POSLEVMAX=1
once bullcross=0
once bearcross=0

IF BARINDEX > PERIOD THEN //For avoid computer errors
bullcross=WMA crosses over smoothWMA
bearcross=WMA crosses under smoothWMA
ENDIF


IF bullcross and POSLEVMIN<>posmintemp  THEN
BLEVMIN=LEVMIN        //previus local minimum is saved
BPOSLEVMIN=POSLEVMIN
LEVMIN=mintemp
POSLEVMIN=posmintemp
support=LEVMIN
ENDIF

// --> Detecting and locating a local maximum
IF bearcross and POSLEVMAX<>posmaxtemp THEN
BLEVMAX=LEVMAX       //previus local maximum is saved
BPOSLEVMAX=POSLEVMAX
LEVMAX=maxtemp
POSLEVMAX=posmaxtemp
resistance=LEVMAX
ENDIF

once support=low
once resistance=high
support=min(low,support)
resistance=max(high,resistance)


// << DETECTING DOUBLE TOP OR BOTTOMS  >>

once WidthDoubleTop = high-low
once WidthDoubleBottom = high-low
once Wpattern=0
once Mpattern=0


//  <<<<<<  Double bottoms   >>>>>>>>>

//looking for the top between two local minimums
IF bullcross THEN
doublebottomtop=high[BARINDEX-POSLEVMIN+1] // we start looking for the top in between two local minimums
//POSdoublebottomtop=BARINDEX-POSLEVMIN+1
FOR i = (BARINDEX-POSLEVMIN+1) to (BARINDEX-BPOSLEVMIN-1) DO
IF high[i] > doublebottomtop THEN
doublebottomtop=high[i]
//POSdoublebottomtop=BARINDEX-i
ENDIF
NEXT
WidthDoubleBottom = doublebottomtop-(BLEVMIN+LEVMIN)/2 // (top betwen local minimums) - (average of the las two local minimums)
IF abs(BLEVMIN-LEVMIN) < Kdouble*WidthDoubleBottom THEN
// we have a double bottom
Wpattern=1
else
Wpattern=0
ENDIF
ENDIF

//   <<<<<<<<<<  Double tops    >>>>>>>

//looking for the bottom between two local maximums
IF bearcross THEN
doubletopbottom=low[BARINDEX-POSLEVMAX+1]
//POSdoubletopbottom=BARINDEX-POSLEVMAX+1
FOR i = (BARINDEX-POSLEVMAX+1) to (BARINDEX-BPOSLEVMAX-1) DO
IF low[i] < doubletopbottom THEN
doubletopbottom=low[i]
//POSdoubletopbottom=BARINDEX-i
ENDIF
NEXT
WidthDoubleTop=(BLEVMAX+LEVMAX)/2 -doubletopbottom
IF abs(BLEVMAX-LEVMAX) < Kdouble*WidthDoubleTop THEN
// we have a double top
Mpattern=1
else
Mpattern=0
ENDIF
ENDIF

//    <<<<<<<<<<  DOUBLE BOTTOM FOR TRADING  >>>>>>>>
once entrylong=undefined
once entryshort=undefined

myATR=AverageTrueRange[2*period](close)

IF Wpattern=1 THEN
IF close > (doublebottomtop+myATR) or close < (LEVMIN-0.5*myATR) THEN
Wpattern=0 //  <<<< double bottom has been activated or it was cancelled >>>>>
ELSE
//Here we trade
entrylong = max(doublebottomtop,high)+spread*pipsize/2
entryshort= min(LEVMIN,low)-0.5*myATR-spread*pipsize/2
stoploss = min(maxrisk,WidthDoubleBottom/pipsize+1.5*spread)
StopProfit= WidthDoubleBottom/pipsize*Kprofit

IF NOT LongOnMarket AND ontime=1 THEN
BUY n CONTRACTS AT entrylong STOP
SET STOP pLOSS stoploss
SET TARGET pPROFIT StopProfit
ENDIF

IF NOT ShortOnMarket AND ontime=1 THEN
SELLSHORT n CONTRACTS AT entryshort STOP
SET STOP pLOSS stoploss
SET TARGET pPROFIT StopProfit
ENDIF
ENDIF
ENDIF

//    <<<<<<<<<<  DOUBLE TOP FOR TRADING  >>>>>>>>
IF Mpattern=1 THEN
IF close < (doubletopbottom-myATR) or close > (LEVMAX+0.5*myATR) THEN
Mpattern=0 //double top has been activated or it was cancelled
ELSE
//Here we trade
entrylong = max(LEVMAX,high)+0.5*myATR+spread*pipsize/2
entryshort= min(doubletopbottom,low)-spread*pipsize/2
stoploss = min(maxrisk,WidthDoubleTop/pipsize+1.5*spread)
StopProfit= WidthDoubleTop/pipsize*Kprofit

IF NOT LongOnMarket AND ontime=1 THEN
BUY n CONTRACTS AT entrylong STOP
SET STOP pLOSS stoploss
SET TARGET pPROFIT StopProfit
ENDIF

IF NOT ShortOnMarket AND ontime=1 THEN
SELLSHORT n CONTRACTS AT entryshort STOP
SET STOP pLOSS stoploss
SET TARGET pPROFIT StopProfit
ENDIF

ENDIF
ENDIF

IF longonmarket then

IF close < support[1] THEN //+0.3*(resistance-support)
SELL AT MARKET
ENDIF

IF TIME > 224500 and DayOfWeek=5 then
SELL AT MARKET
ENDIF
endif

IF shortonmarket then

IF close > resistance[1] THEN //-0.3*(resistance-support)
EXITSHORT AT MARKET
ENDIF

IF TIME > 224500 and DayOfWeek=5 then
EXITSHORT AT MARKET
ENDIF
endif

//Quit the robot if things are going bad
Q=MAX(Q,(STRATEGYPROFIT/pipvalue/n))
R=Q-STRATEGYPROFIT/pipvalue/n
IF R > totalrisk THEN
QUIT
ENDIF

IF STRATEGYPROFIT < (-1*totalrisk) THEN
QUIT
ENDIF
LeoParticipant
Veteran
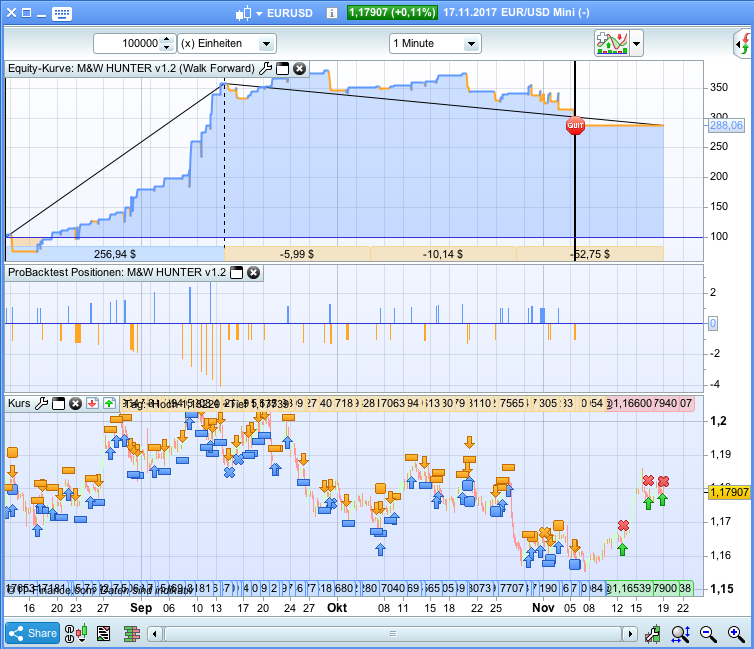
Here a WF of the system at 1min time frame…. thats why I need your help to improve this system
hey leo,
i have this IN REAL! Thanks!
so, it was luck or is this the cash cow we all are looking for? 😉
LeoParticipant
Veteran
Cool!
so, it was luck or is this the cash cow we all are looking for?
This is what I work everyday for 🙂
I hope still working for you. I am not fully satisfied though, because most of the time the price target of a doble bottom is not fully fullfill. This strategy I post make me win like 3 times in a row and with only one fail it deletes the profit of the last two.
Maybe as an entry and then you control manually the position can be very profitable.
or… let’s improved it together!
Hi Leo
Based on having watched charts for years, I have often times noticed that legitimate double tops tend to make a higher high (tops) or lower low (bottoms) on the second top or bottom than the first. The average close of the second top however if measured across the candle directly before the new high (tops) and low (bottoms) along with the candle that printed the actual high or low is usually lower (for tops) or higher (for bottoms).
Maybe you can try building that into your screener and/or code and see if it improves results?
Hi @
Leo , looks good!
I guess you know your Optimising is at 2 min TF and your WF is at 1 min TF?
If I start with £10K Capital, what do I need to change in the code to remove the Quit at around £100? Or change Quit to £10K and just let it run??
I’ve tried a few changes, but so I don’t lose interest (short attention span! 🙂 ) it be easier if you tell me (and others).
Thank You
GraHal
It’s okay, I think I have it!
There are so many linked / referred values that’s why I was losing patience, but I changed total risk to 10000 and it ceases the Quit. Now I can continue investigations.
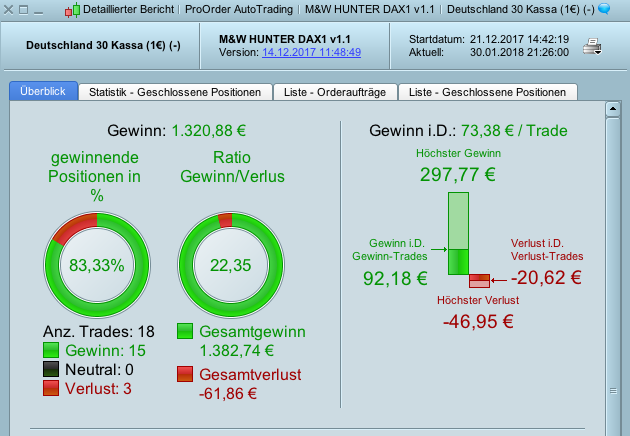
Attached is what I get so far.
maxrisk=maxrisk0+(n-1)*2
totalrisk=10000//4*maxrisk*PIPVALUE //for stop the robot if things are going bad
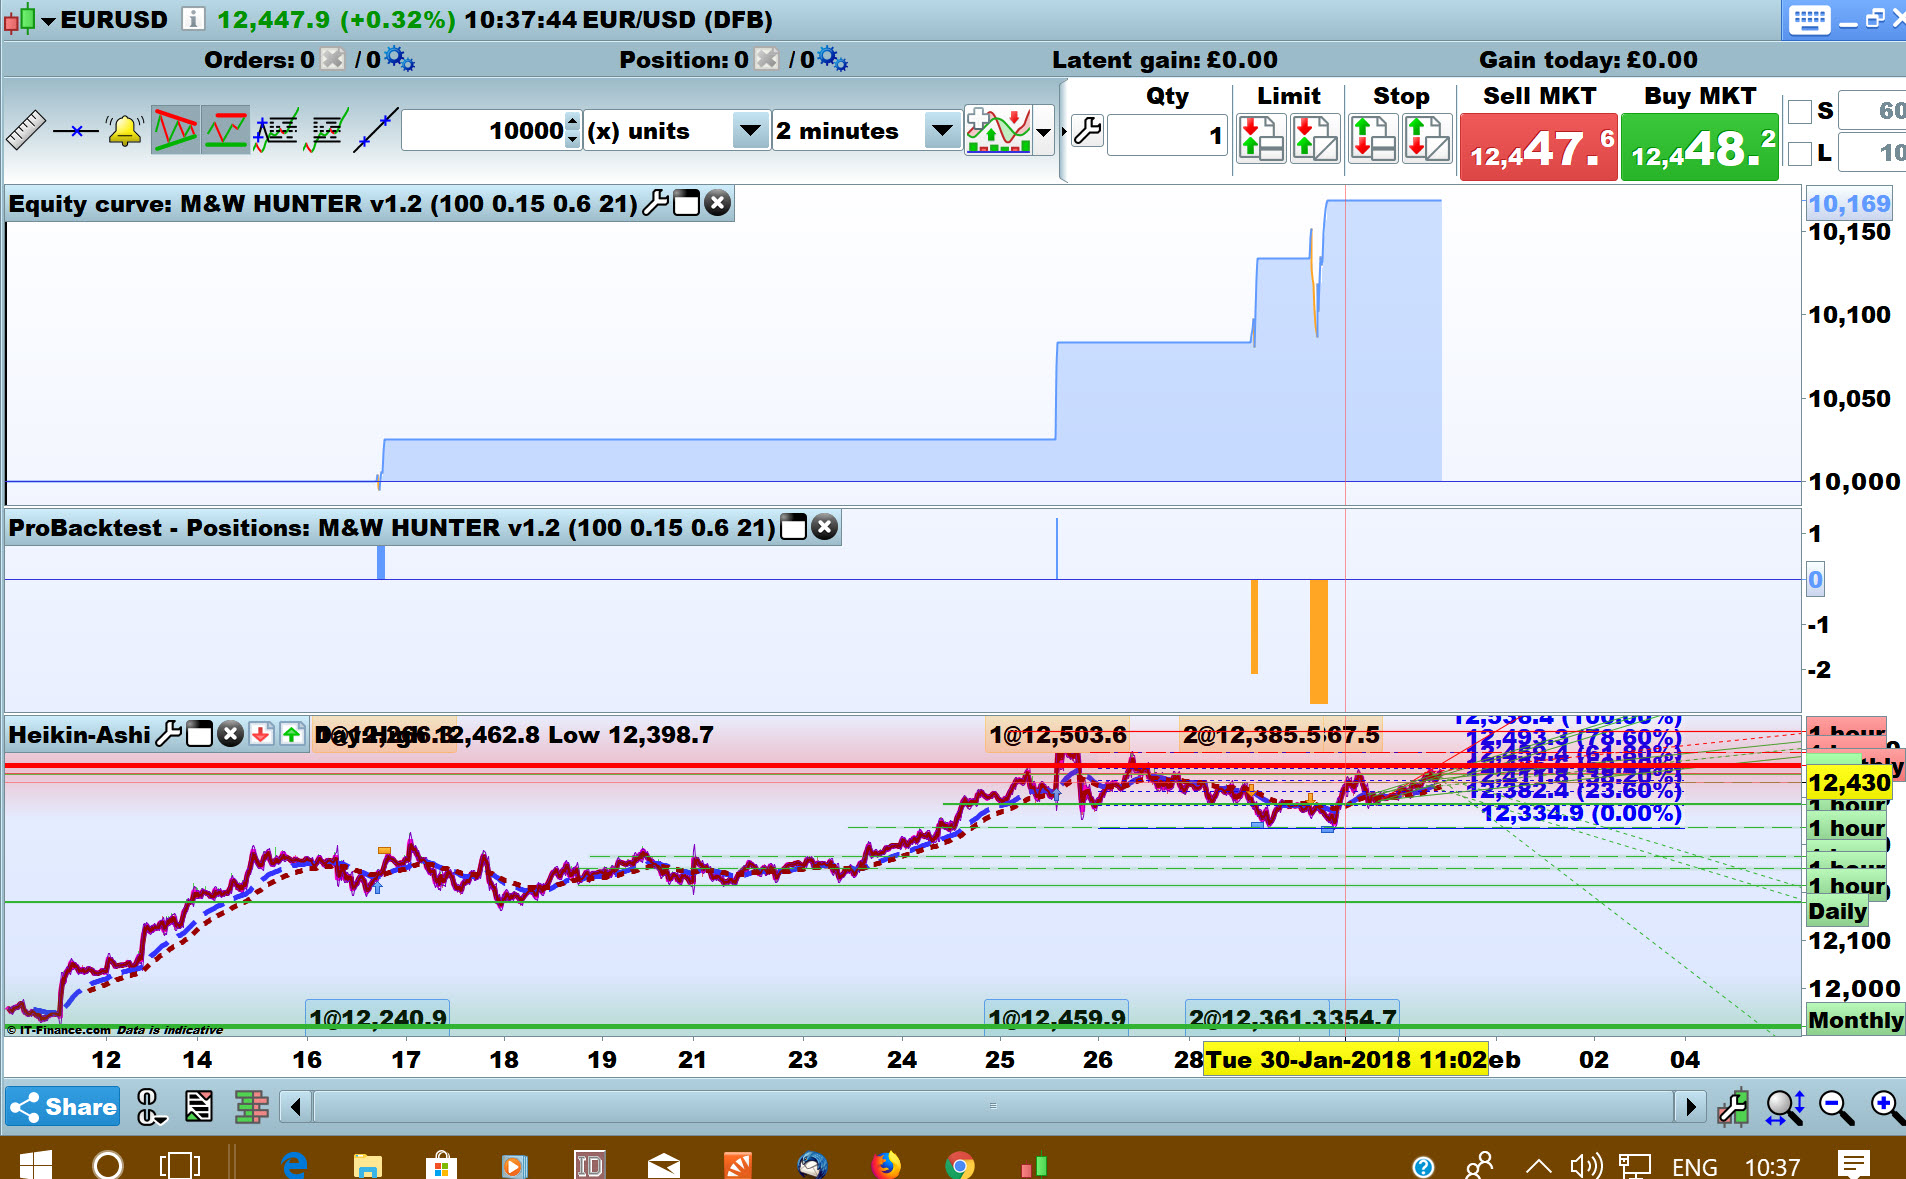
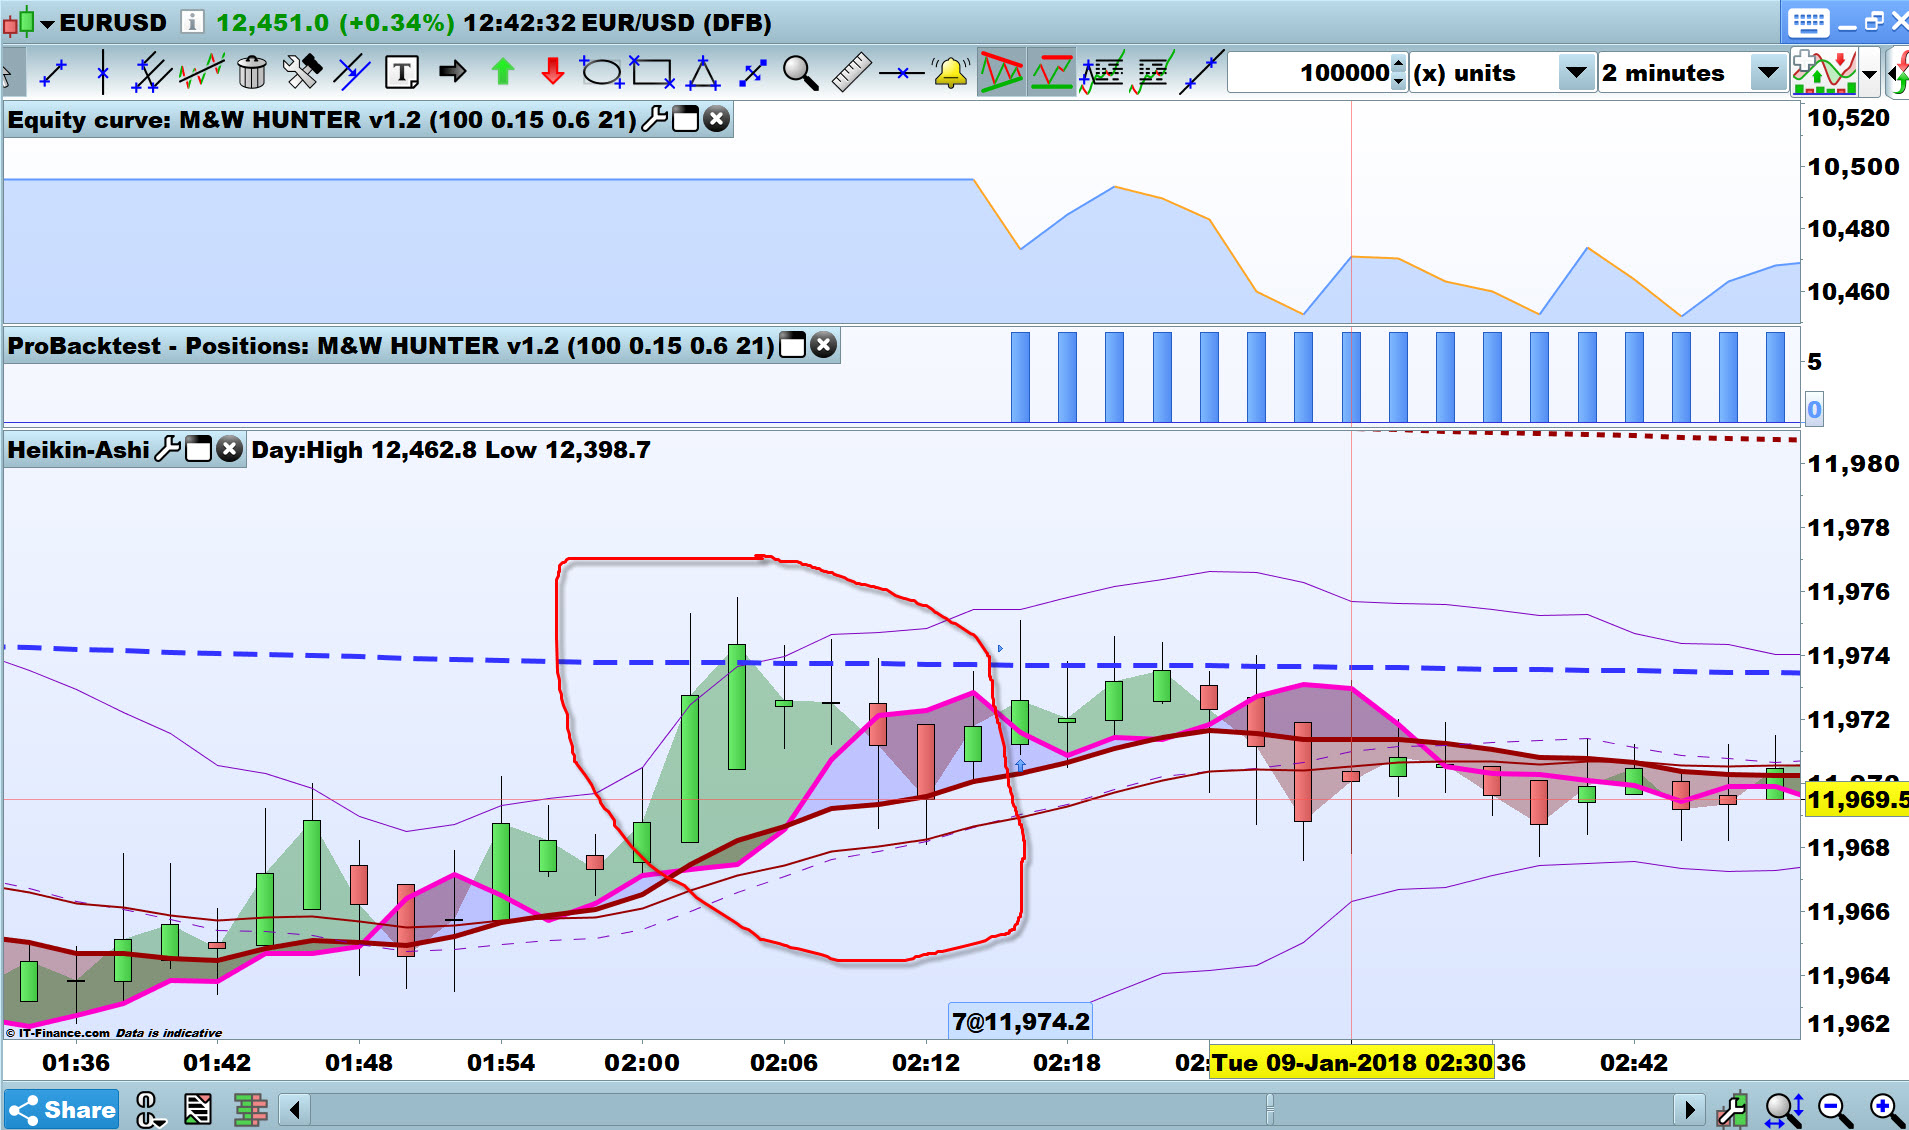
I picked a trade a random (or maybe I looked for a loser, can’t recall ! 🙂 ).
Anyway attached is what must be the trigger for the double bottom … what you reckon Leo?
Got to go to Dentist now, more later maybe.
GraHal
Yup, something definitely not looking right there
I just compared my real trades with the backtest. It´s completely the same, so this one works.
Anyway, the actual trade would have lost about 400€, thank god I stopped the system yesterday 😉
In this case the last trade would have killed the two won trades before. Ok, but trading is a risky thing. I am thinking about let the system run with some more indices and then in some more time levels of each indices. What do you guys think about it? I would stop each system after a strategyprofit between 500 and 1000€.
I’m probably weird (actually I know I am ! 🙂 ) but I manually control all Strats and exit if the market structure around the entry point / progress of the trade doesn’t look right for the direction of the trade (Long or Short).
Even if I am away from the Screen I keep an eye on profit / loss (you can even see Charts on the App) on the IG App on my phone and exit if there is a decent profit that starts to run down. Better a small profit than see it turn to a loss?
I do then analyse what the Strat is doing (similar to what I’ve done above with Leo’s) and make changes to the code to better the equity curve.
Above sounds better than it is cos this site is like being a kid in a sweet shop … I wanna try this one, no this one, oh forget them, this one’s better than all the others!!! hahahahhahah
GraHal
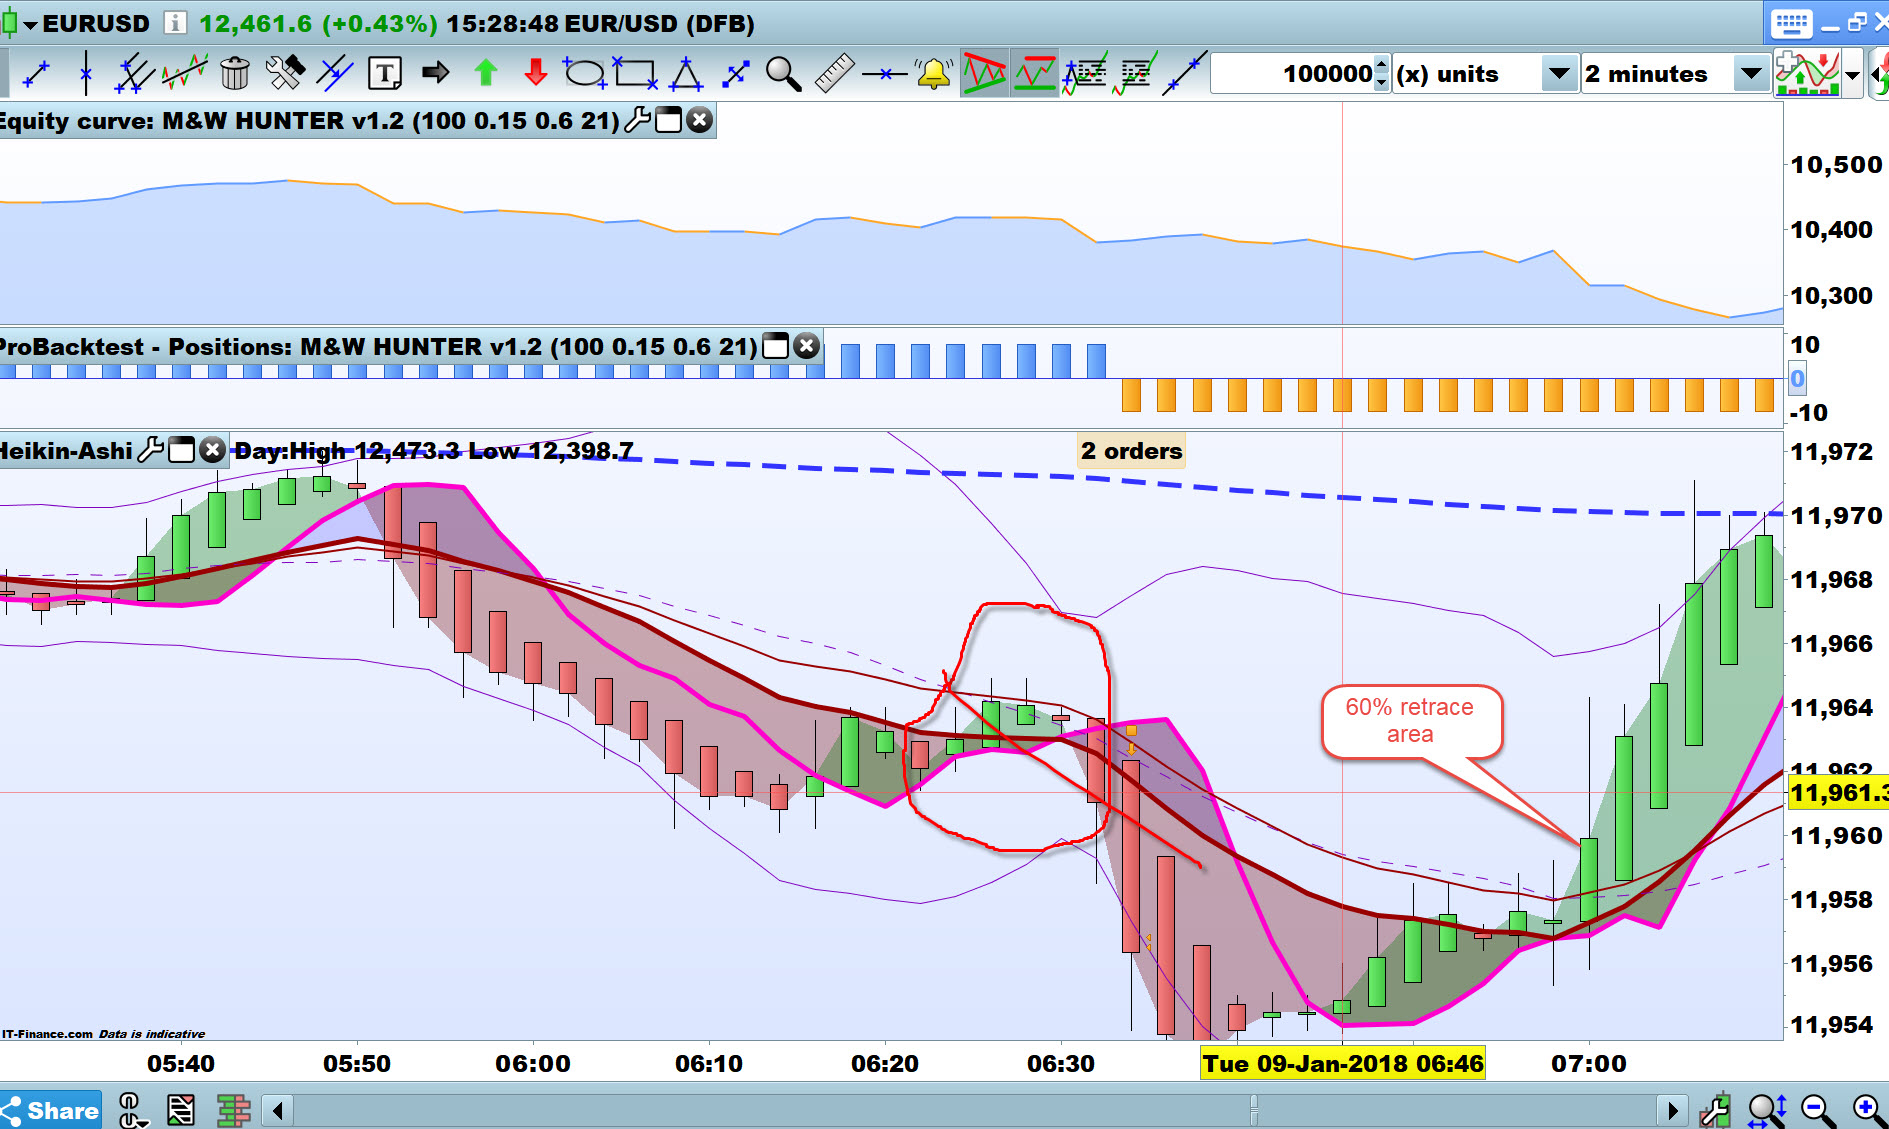
Attached is the next trigger / double top that ends / exits the previous trade (see post #61095 above showing image of a double bottom).
But in my logic, after you get higher than about a 60% retrace of the 3 red bars (following entry) then any edge / logic the entry (double top) had has gone / means nothing!?
From thereon – past the 60% retrace point – you are living in the
land of hope!?
GraHal
LeoParticipant
Veteran
Hi all,
First than all I want to thank you for the collaboration in this project.
- @juanj: I got your ideas I will add another parameter for check at double bottom if the lowers are uptrend or uptrend and opposite for double tops
- @ raphaelopilski: I feel relief you close that trade. That happens to me as well
- @Grahal: I got your idea long time ago, even test it with real money and I not getting the robustness I wish because the theory says that a double top/ bottom must be activated, i.e close avobe/ below the middle local. When I trigger in another moment the pattern is not active then there is no probability of winning trade. What I also try live with real money after testing is to open a limit order at a Fibonacci level of 0.38 and I get boring of seeing that many double bottom/top where active and never come back to this beloved pull back for entry.
- Here some insights:
- For Fibonacci levels at double bottoms use “LEVMIN” and “maxtemp” values
- I realise that a possible double top can be a reversal pattern or a very good looking flag pattern… so I am testing different filters for a long long very long bias or trend. Trend is your friend.
@Leo I don’t understand what you are saying in the @Grahal paragraph above. You are talking about entering a trade at a 38% retrace from a double top / bottom?
I was suggesting that the 60% retrace is a good zone to watch further progress very carefully. If the retrace continues at a pace much further than 60% then I would probably do a manual exit of the trade (which was triggered / entered by a double top/bottom).
Cheers
GraHal
LeoParticipant
Veteran
Ok,
Then this will be another closing condition:
IF longonmarket then

IF close < support+0.4*(resistance-support) THEN
SELL AT MARKET
ENDIF

ENDIF

IF shortonmarket then

IF close > resistance-0.4*(resistance-support)
EXITSHORT AT MARKET
ENDIF

ENDIF