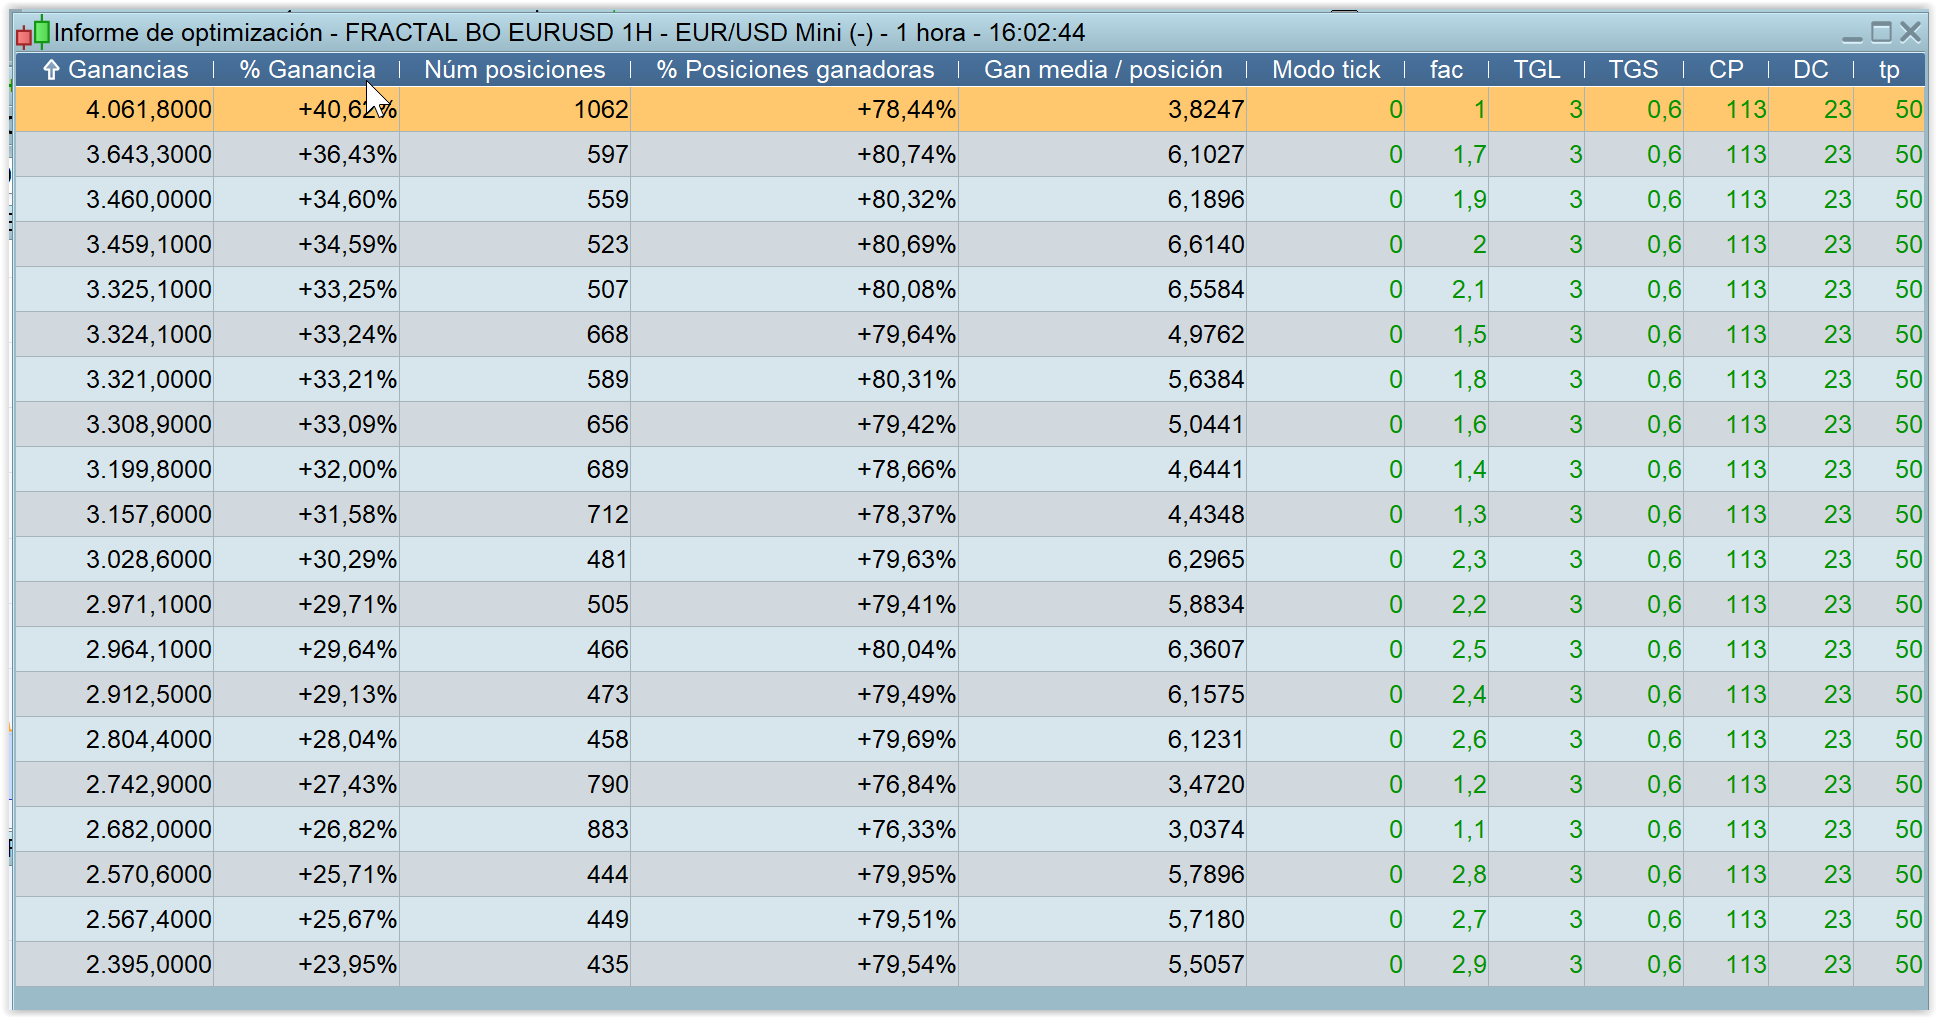
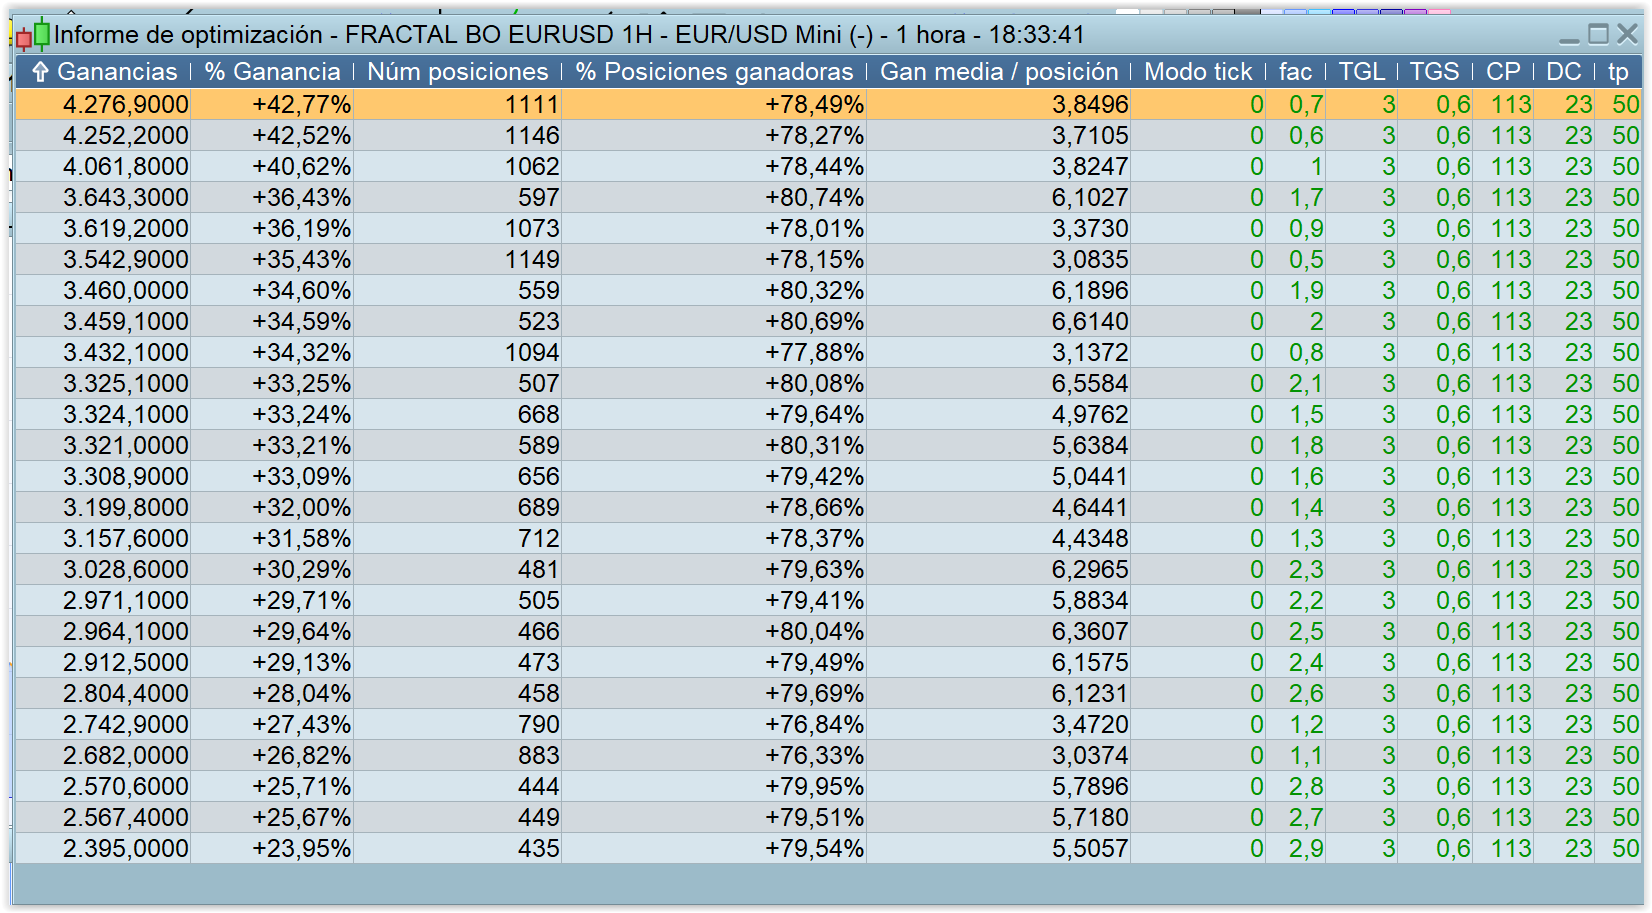
@ Petrus – I ran a quick test on different factors (100 000 bars, spread 0.8) and the numbers with best results are as follows = 1.8, 2, 1.9, 1.7, 1.6, 1.5
 ALE
ALEModerator
Master
Hello Petrus,
I don’t find better results, could you post your strategy to avoid error test?
Thanks
Ale
 Pere
PereParticipant
Veteran
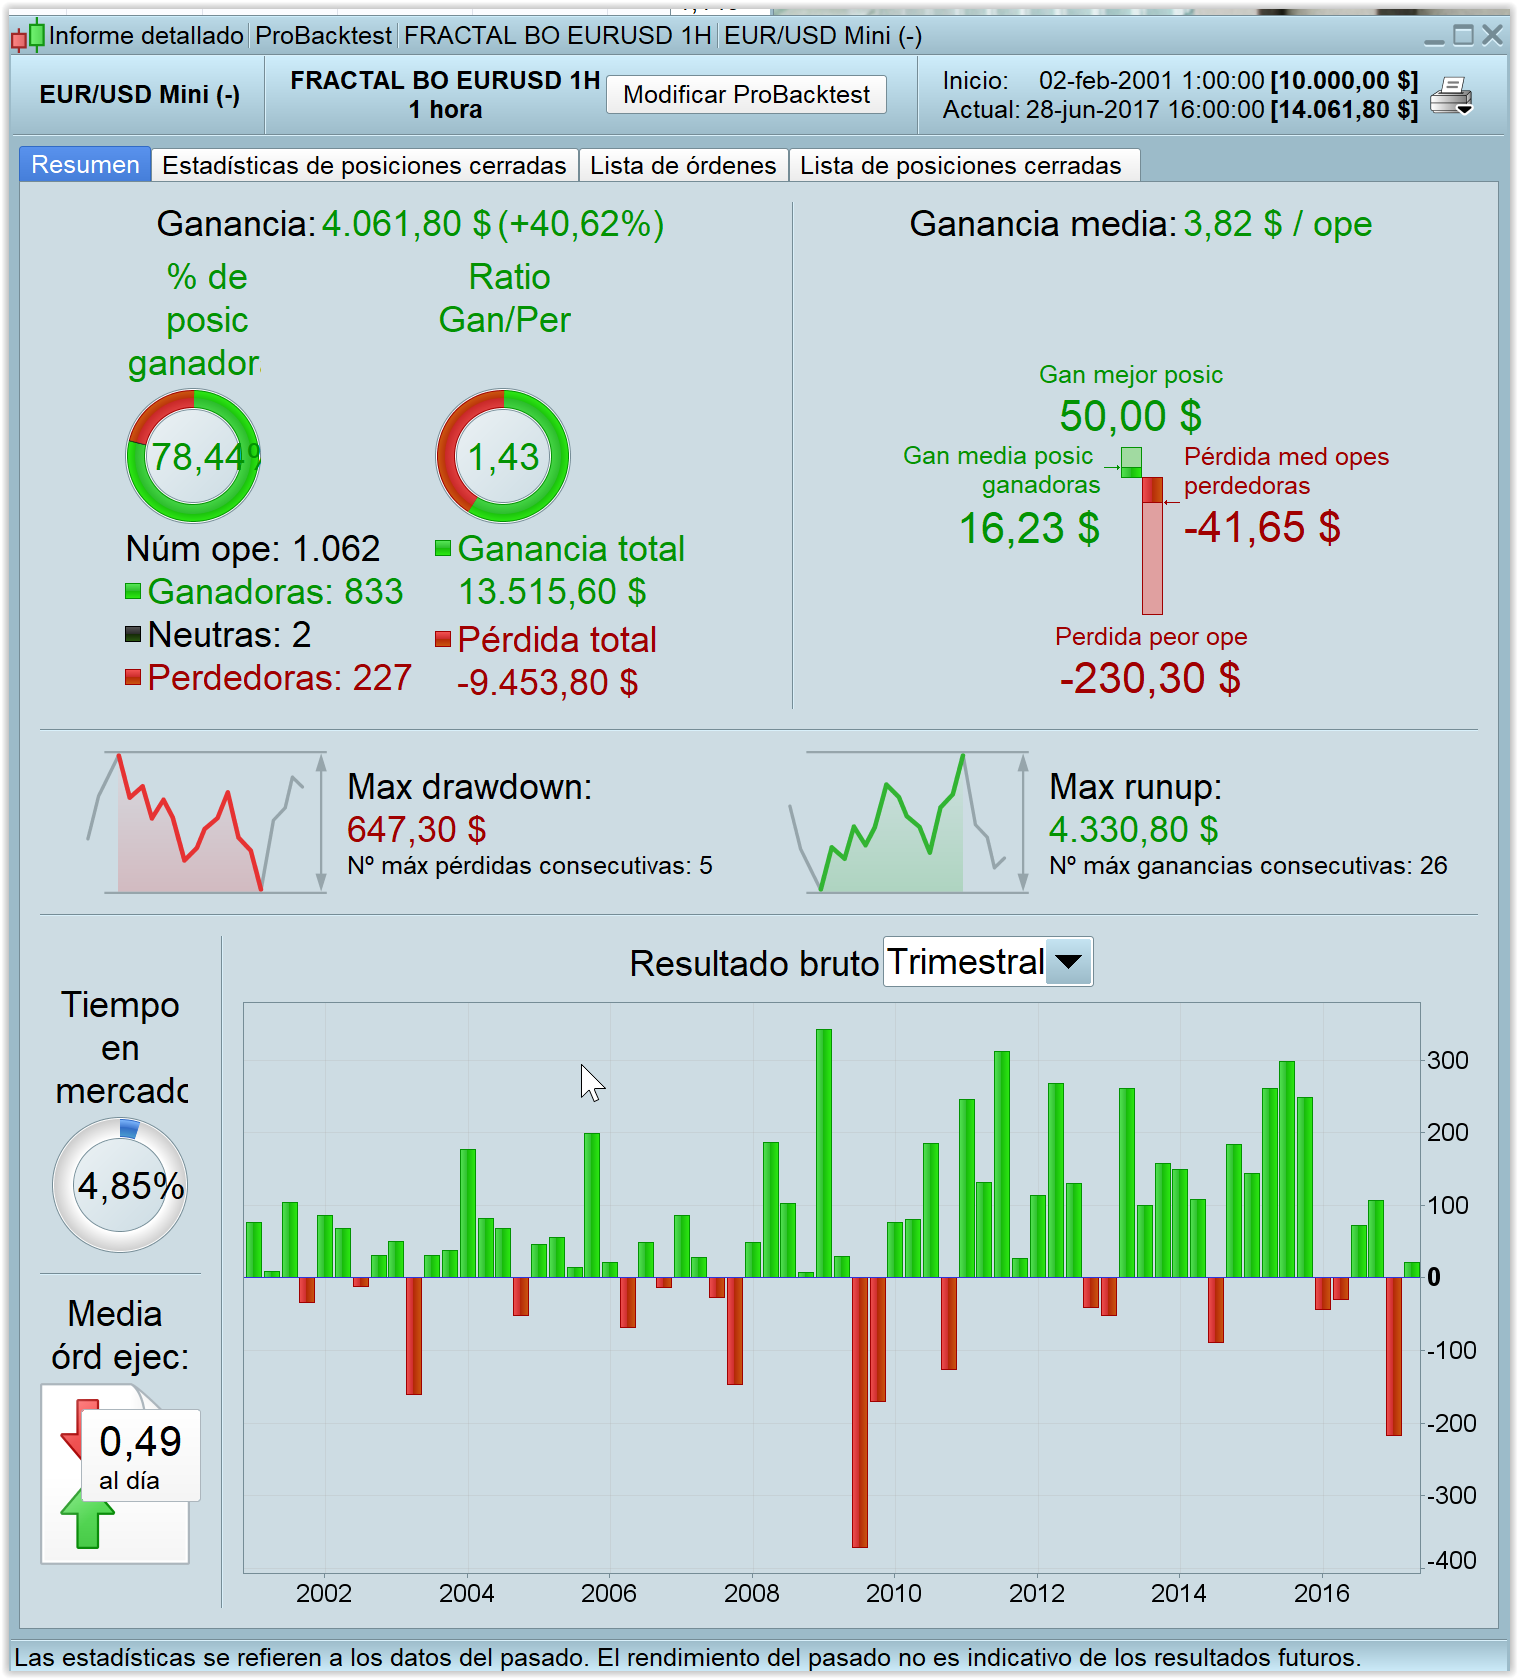
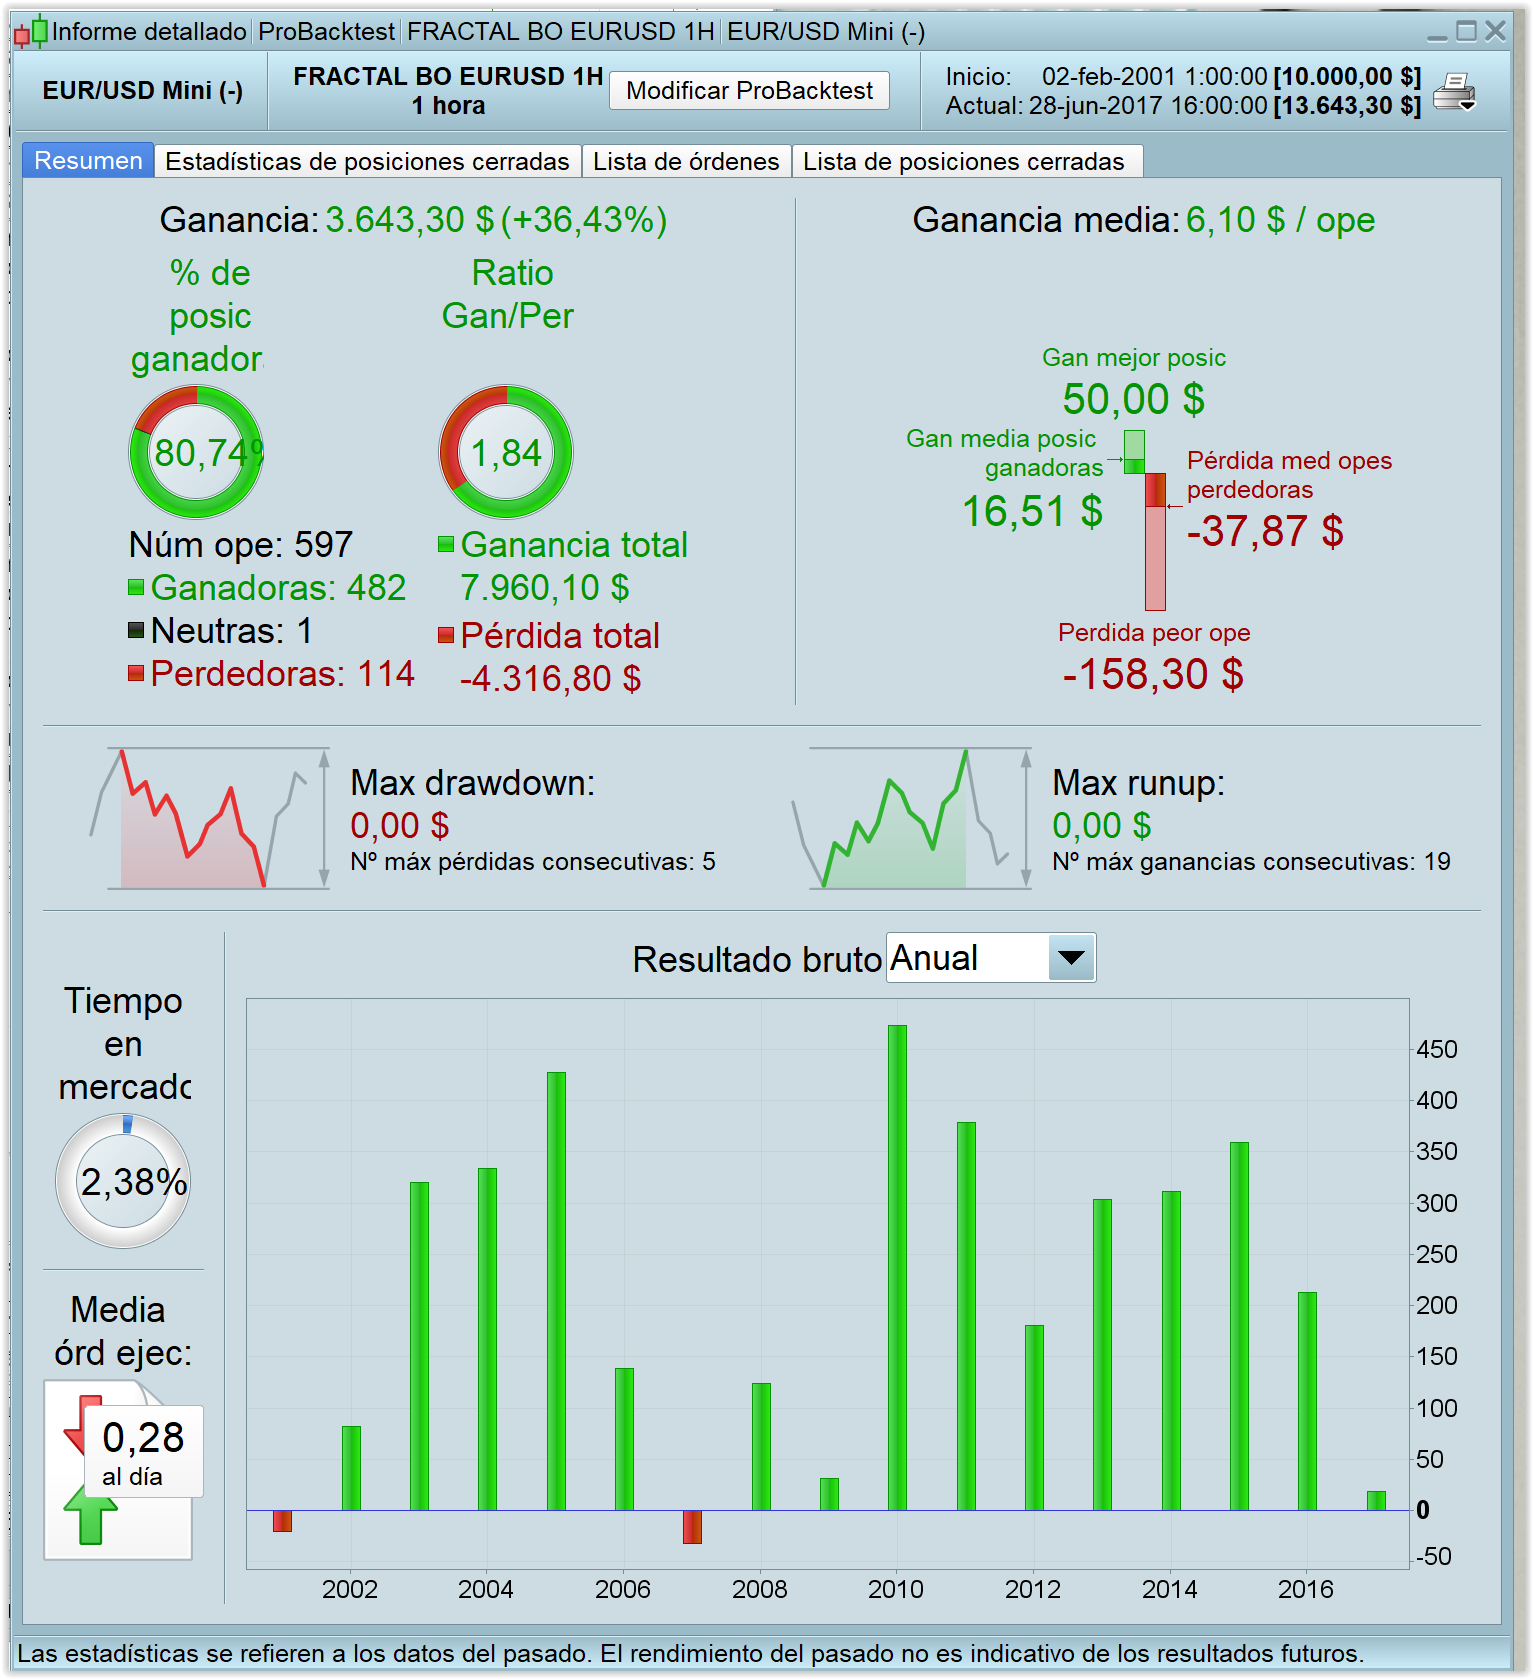
Results depend, of course, of the bar numbers. Here my results with 100.000 bars.
Best result is with factor 1, but I like more the second position (factor 1,7), with less total gains but better PF, curve and %Win.
Hi Petrus,
The value of 1 is an outlier since there is no other similar value with the same result.
PereParticipant
Veteran
Can be, but this is probably because the optimization of the factor was made from 1 to 3, step 0.1.
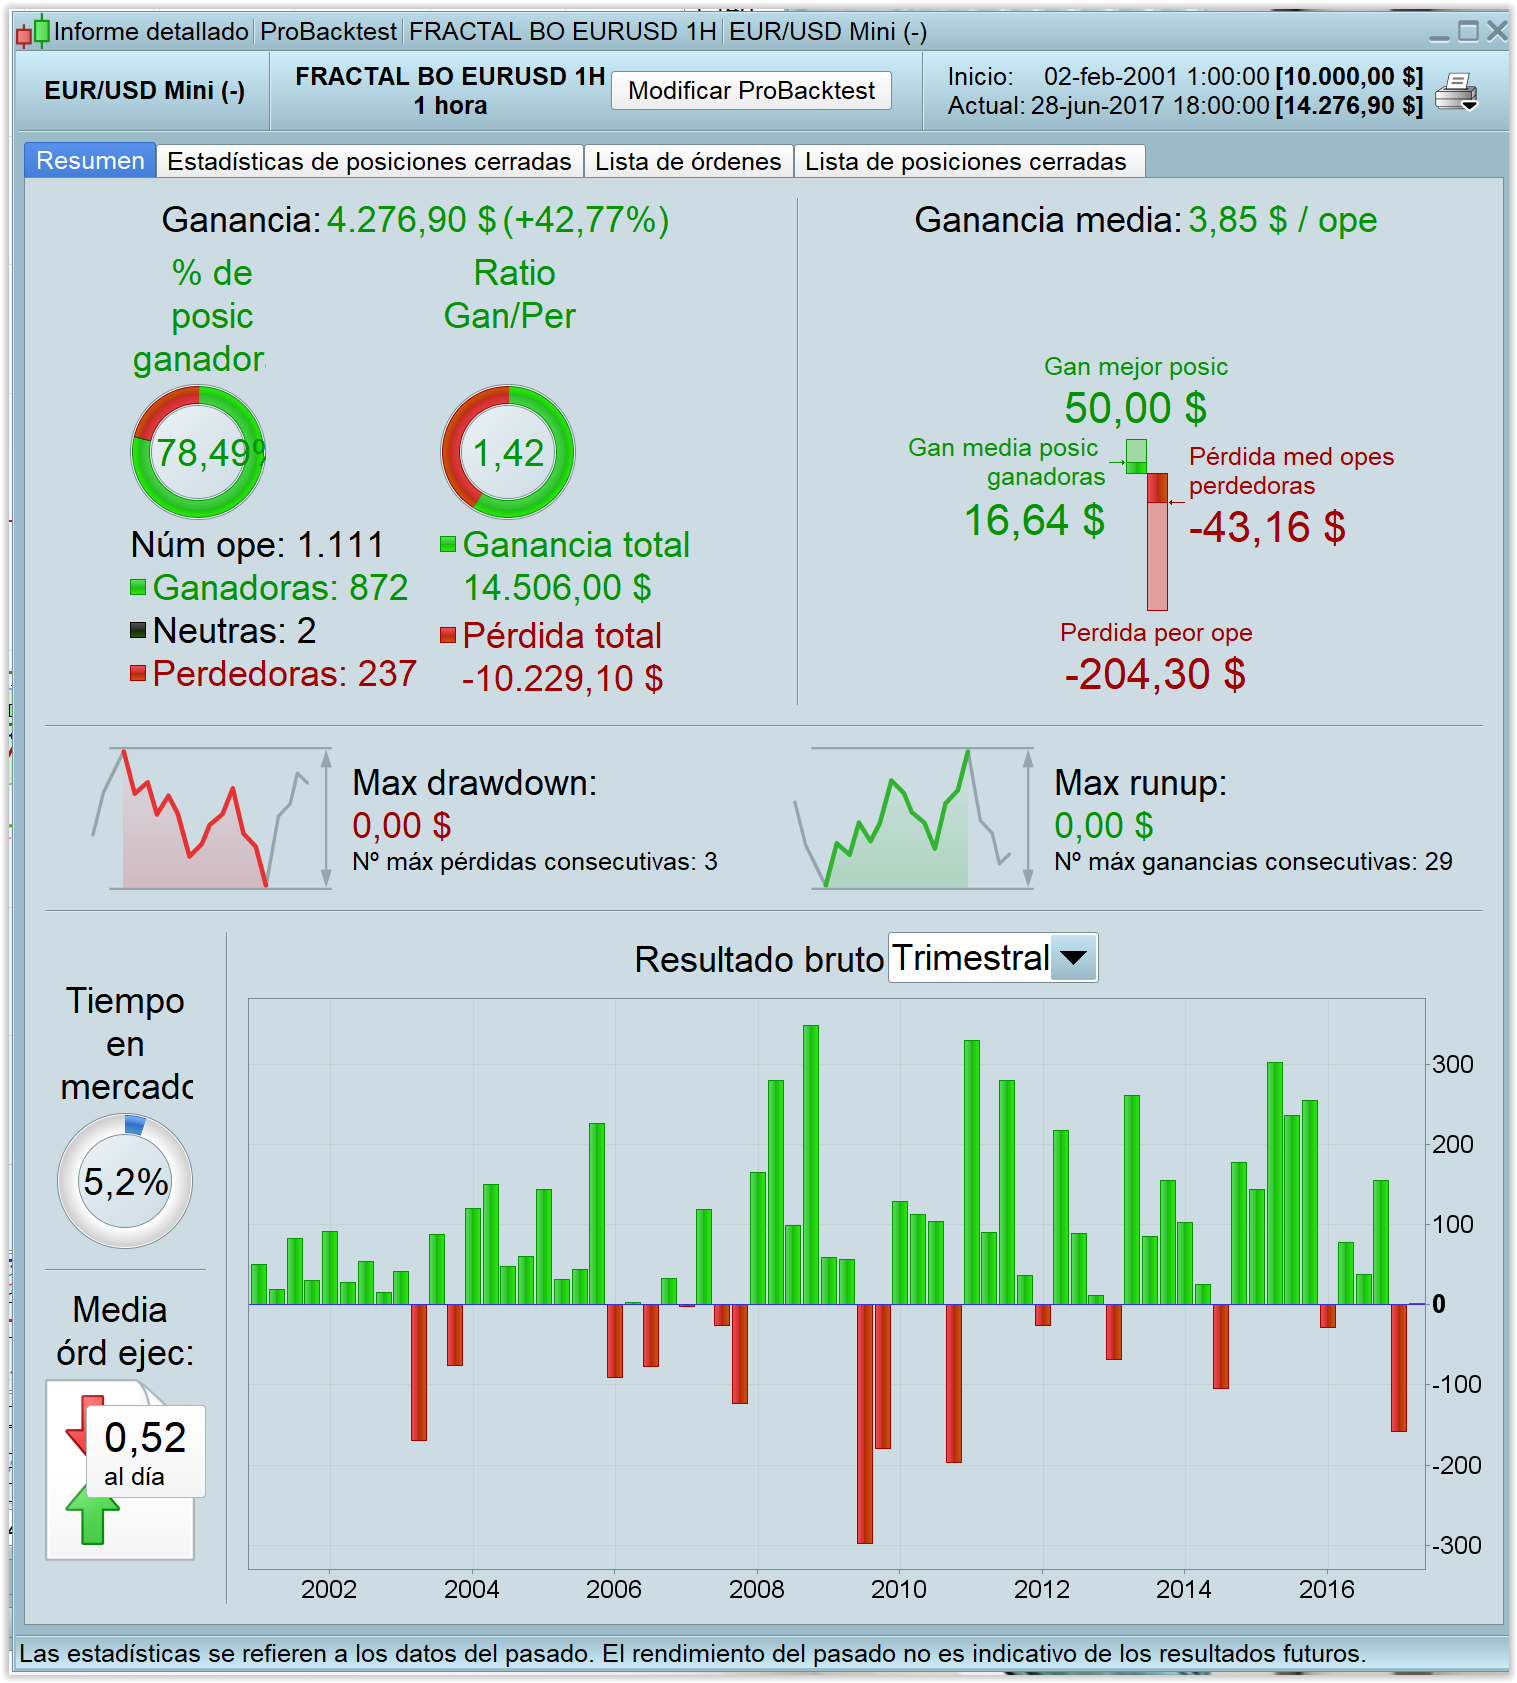
I made another optimization with factor between 0.5 and 3, step 0.1, and the results are even better. And there are also values of 0.5, 0.6, 0.7, 0.8 and 0.9.
TGL, TGS, CP, DC and tp were not optimized, because if I do it with 100.000 bars, I will have to wait one week to see the final results. But probably with different values of these parameters, the results could be also better.
About yesterday: good trade , with good profit on EUR/USD
About previous post, sorry but I didn’t understand well , where is the optimization refer to the ‘Ale fractal version ‘ ?
hi !
i add victor version ( audusd for M30) on a M1 chart by mistake… it’s interesting 🙂
hi again 🙂
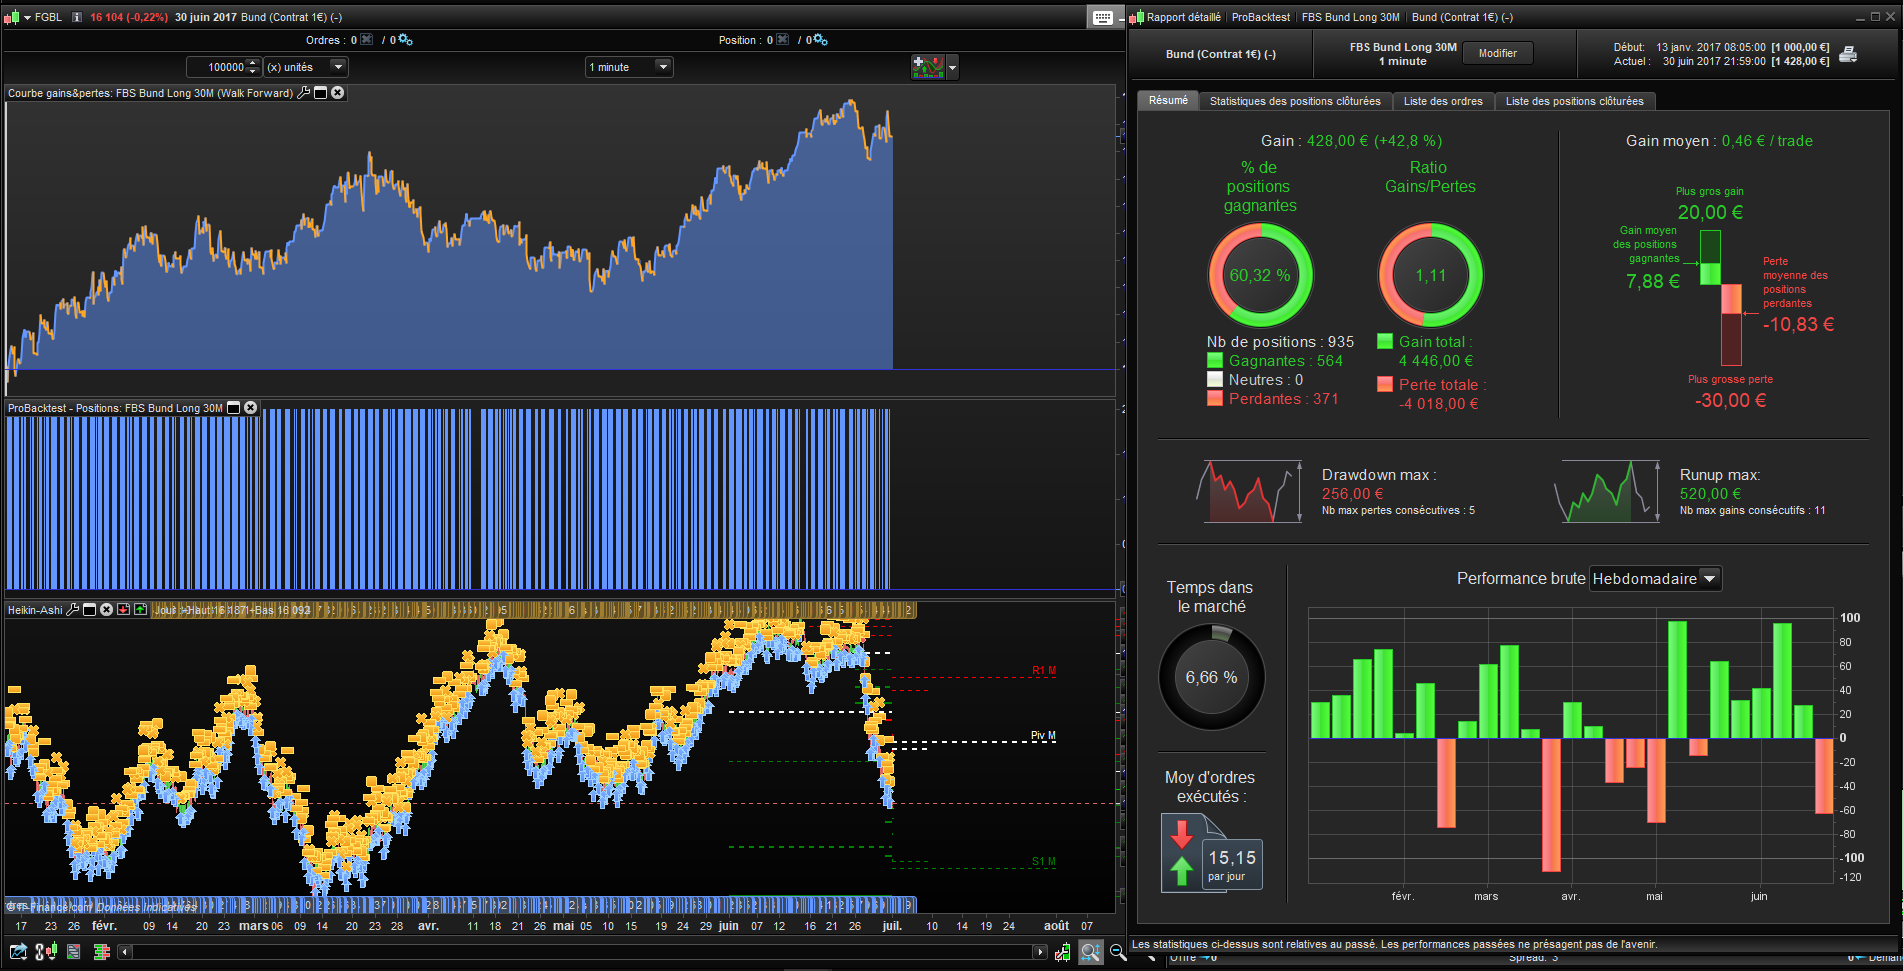
This is the Bund M30 version of victor on a M1 chart. I think i will work on it…
Hi the accountant, If you decide to do so, keep in mind that the history is very limited on 1 min and watch out for slippage!
Yes of course 🙂
I will try to optimize it and I will run it on a demo account… If it is interesting I will post here the results !
Hi guys ! 🙂
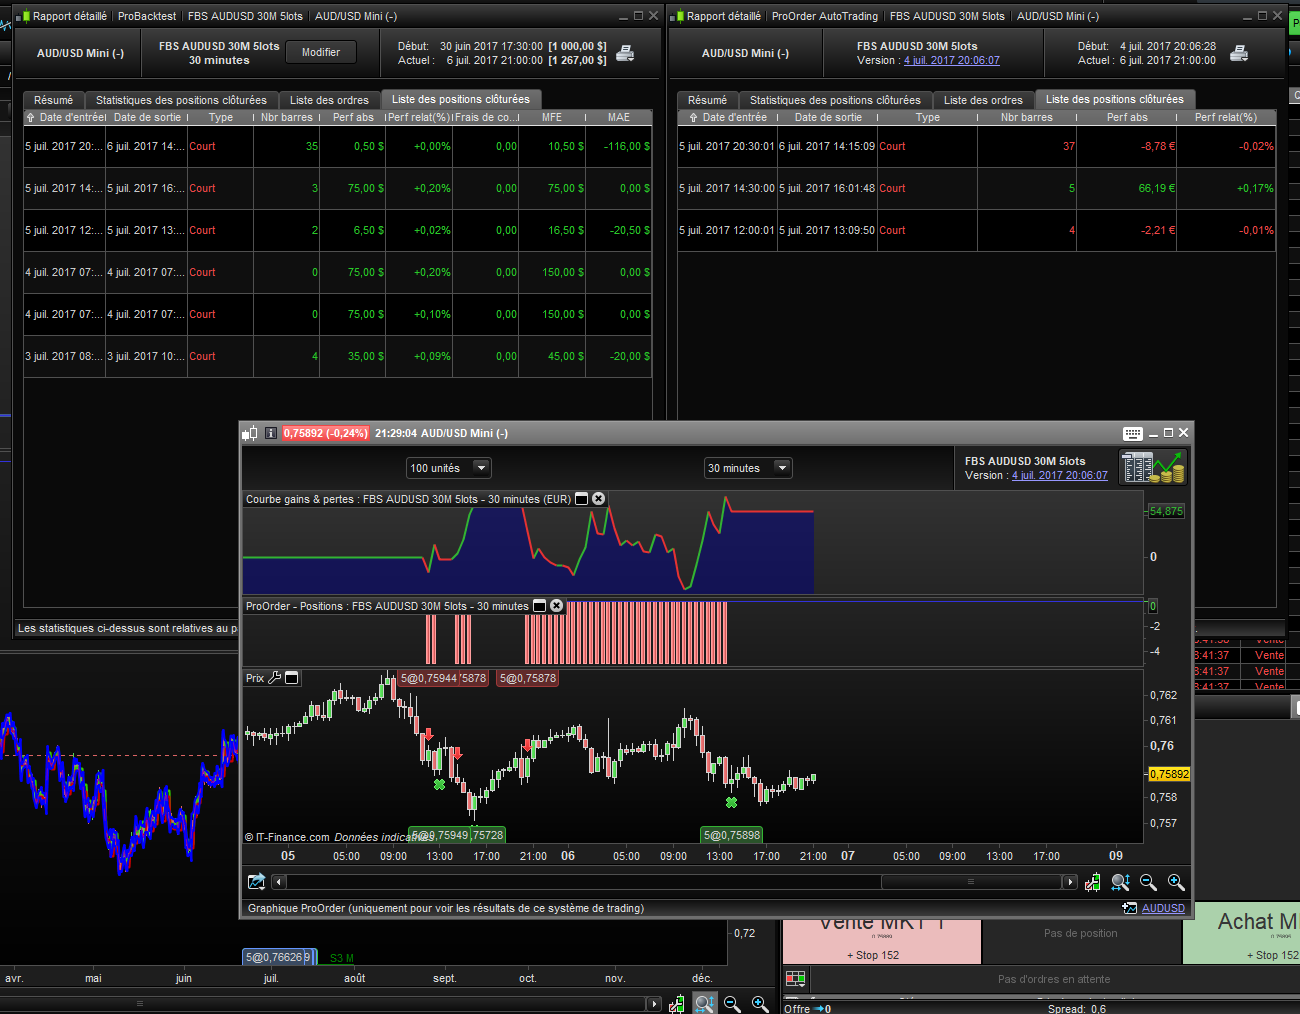
I use the audusd 30M version on my real account for two days. The results between the backtests and the demo account are exactly the same. But the results between the real account and the backtests are different.
What do you think ?
I think this is not slippage. Some positions are closed with several minutes of difference and I do not know why.
How to judge a strategy if the position are not the same on the account demo and the real account?
Please take a look at the picture .
Oh !! I cut the times of close on the backtest (on the picture)… 🙂 sorry….. But there is the number of candles… 😉
We see that for both losses, the position is closed two candles later in real.
I see this with more or less all my live strategies. When I run a backtest over the last weeks and compare it with the actual live trades it is always that the live trades are worse. I explain this to myself with my use of trailing stoplosses. Obviously is PRT even in tick mode not able to simulate what is really going on during a candle.
I tried running a strategy on BTC and this was worst! My orders frequently were executed at prices that that “never occured”. For example PRT could show the candle was trading in a range 2550-2560. But on the same candle my stop was executed at say 2545. Such things do not happen when you run the backtest.
Hey guys, there was a new trade last night in eurusd v3. I had different result on demo and live (however I have not yet double checked if the codes are the same). Live closed on BE and demo closed on about 10 pips plus. What result did you get?
hello guys, where is the AUDUSD version? Id like to have a look at that.
Thanks
Francesco