To continue, because it’s an intersting topic (Thanks @juanj and all contributors), I made a test
I use a very simple code
// Définition des paramètres du code
DEFPARAM CumulateOrders = False // Cumul des positions désactivé

// Conditions pour ouvrir une position acheteuse
indicator1 = ExponentialAverage[a](close)
indicator2 = ExponentialAverage[b](close)
c1 = (indicator1 CROSSES OVER indicator2)
indicator3 = WilderAverage[c](close)
c2 = (close > indicator3)

IF c1 AND c2 THEN
BUY 1 SHARES AT MARKET
ENDIF

// Conditions pour ouvrir une position en vente à découvert
indicator4 = ExponentialAverage[a](close)
indicator5 = ExponentialAverage[b](close)
c3 = (indicator4 CROSSES UNDER indicator5)
indicator6 = WilderAverage[c](close)
c4 = (close < indicator6)

IF c3 AND c4 THEN
SELLSHORT 1 SHARES AT MARKET
ENDIF

// Stops et objectifs
SET TARGET pPROFIT d
SET STOP pLOSS 2*d
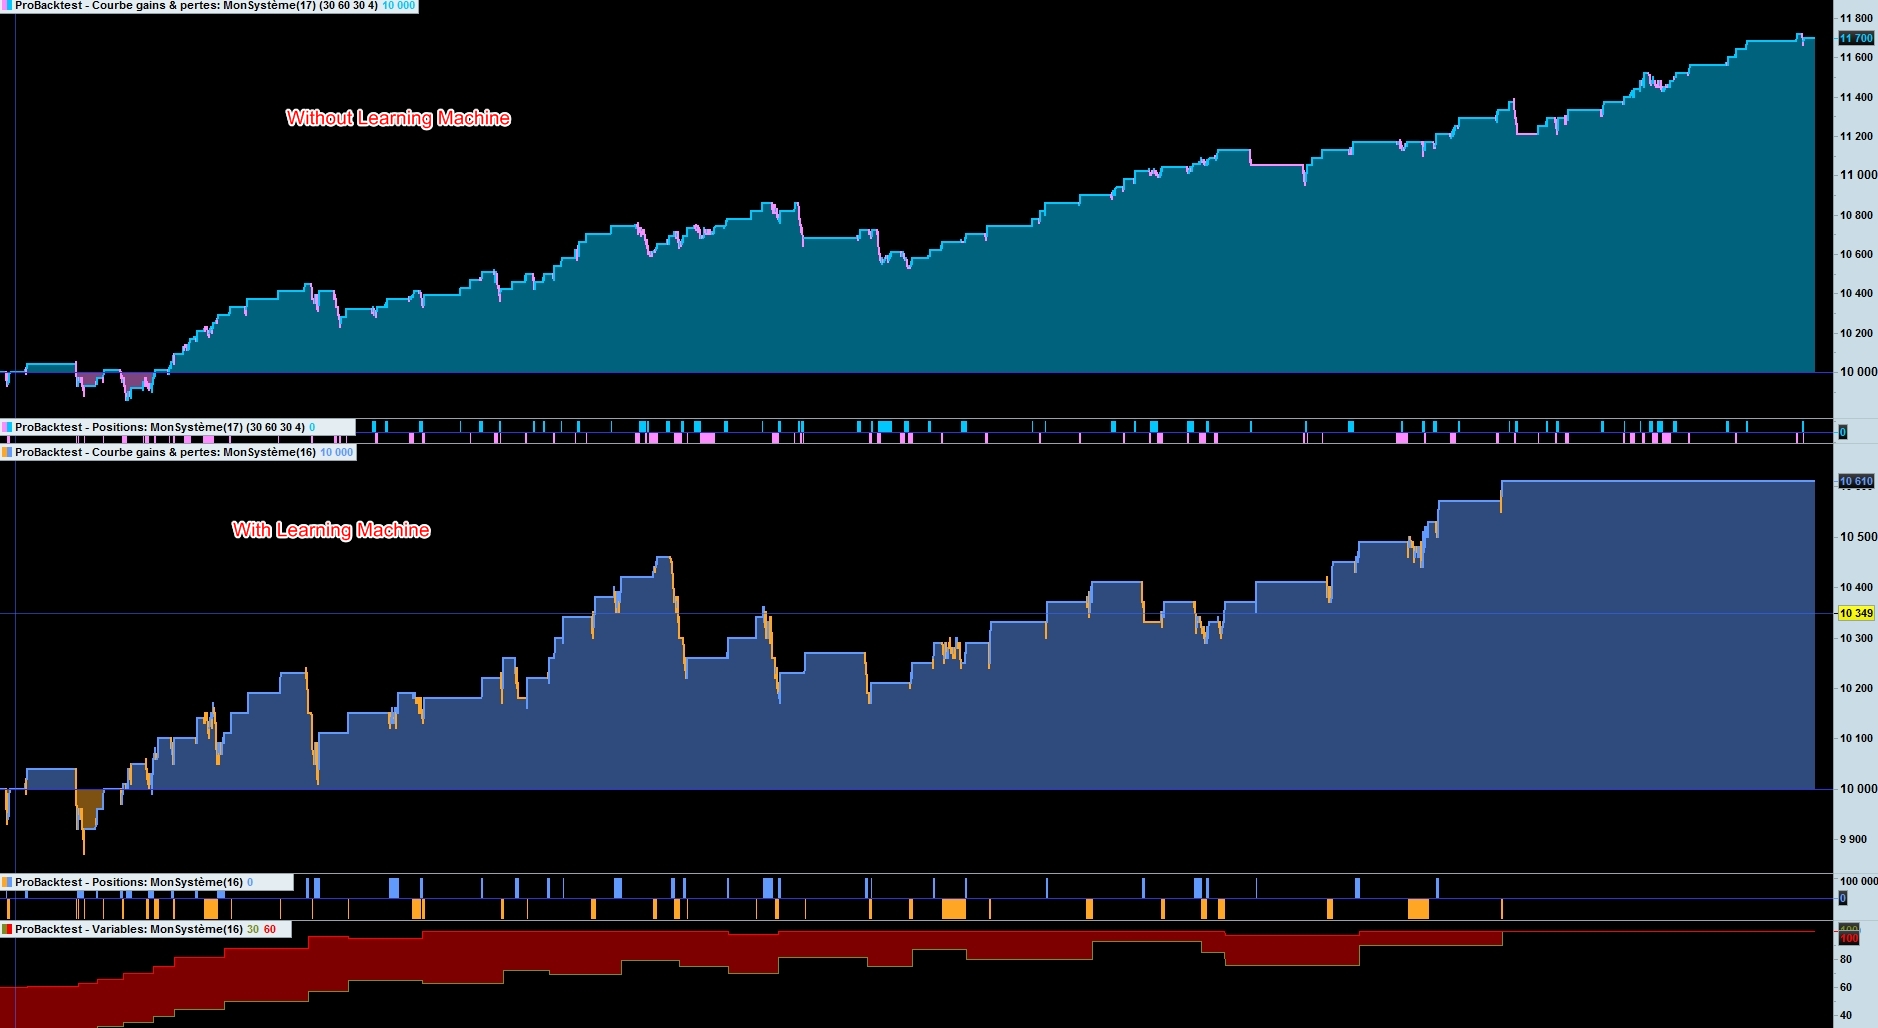
On EUR/USD 1 minute. I do a backtest and obtain the “best” value who are a=30 b=60 c=30 d=4
I put these values in the Learning machine in Starting Value as you can see below with min/max as the values aroud these values on the backtest
defparam cumulateorders = false
//////////////////////////////////////////////////////////////
StartingValue = 30
ResetPeriod = 3 //Specify no of months after which to reset optimization
Increment = 1
MaxIncrement = 20 //Limit of no of increments either up or down
Reps = 3 //Number of trades to use for analysis
MinValue = 10 //Minimum allowed value
MaxValue = 100 //Maximum allowed value
//////////////////////////////////////////////////////////////
StartingValue2 = 60
ResetPeriod2 = 3 //Specify no of months after which to reset optimization
Increment2 = 1
MaxIncrement2 = 20 //Limit of no of increments either up or down
Reps2 = 3 //Number of trades to use for analysis
MinValue2 = 20 //Minimum allowed value
MaxValue2 = 100 //Maximum allowed value
//////////////////////////////////////////////////////////////
//period1=7
//period2=14

HeuristicsCycleLimit = 2
once HeuristicsCycle = 0
once HeuristicsAlgo1 = 1
once HeuristicsAlgo2 = 0
If HeuristicsCycle >= HeuristicsCycleLimit  Then
If HeuristicsAlgo1 = 1 Then
HeuristicsAlgo2 = 1
HeuristicsAlgo1 = 0
ElsIf HeuristicsAlgo2 = 1 Then
HeuristicsAlgo1 = 1
HeuristicsAlgo2 = 0
EndIf
HeuristicsCycle = 0
EndIf
//
//If HeuristicsAlgo1 = 1 Then

//Heuristics Algorithm 1 Start

If (onmarket[1] = 1 and onmarket = 0) or (longonmarket[1] = 1 and longonmarket and countoflongshares < countoflongshares[1]) or (longonmarket[1] = 1 and longonmarket and countoflongshares > countoflongshares[1]) or (shortonmarket[1] = 1 and shortonmarket and countofshortshares < countofshortshares[1]) or (shortonmarket[1] = 1 and shortonmarket and countofshortshares > countofshortshares[1]) or (longonmarket[1] and shortonmarket) or (shortonmarket[1] and longonmarket) Then
optimize = optimize + 1
EndIf

If monthinit = 1 or monthinit = 3 or monthinit = 5 or monthinit = 7 or monthinit = 8 or monthinit = 10 or monthinit = 12 Then
MonthDays = 31
ElsIf monthinit = 4 or monthinit = 6 or monthinit = 9 or monthinit = 11 Then
MonthDays = 30
ElsIf monthinit = 2 Then
If (yearinit/4 = round(yearinit/4)) or (yearinit/400 = round(yearinit/400)) Then //haha not sure how exactly to do this
MonthDays = 29 //leap year
Else
MonthDays = 28
EndIf
EndIf

If (month = monthinit and day = dayinit + ResetPeriod) or (month = monthinit + 1 and (day + (MonthDays - dayinit)) >= ResetPeriod) Then
ValueX = StartingValue
WinCountB = 0
StratAvgB = 0
BestA = 0
BestB = 0
dayinit = day
monthinit = month
yearinit = year
EndIf

once ValueX = StartingValue
once PIncPos = 1 //Positive Increment Position
once NIncPos = 1 //Neative Increment Position
once Optimize = 0 ////Initialize Heuristicks Engine Counter (Must be Incremented at Position Start or Exit)
once Mode = 1 //Switches between negative and positive increments
//once WinCountB = 3 //Initialize Best Win Count
//GRAPH WinCountB coloured (0,0,0) AS "WinCountB"
//once StratAvgB = 4353 //Initialize Best Avg Strategy Profit
//GRAPH StratAvgB coloured (0,0,0) AS "StratAvgB"

If Optimize = Reps Then
WinCountA = 0 //Initialize current Win Count
StratAvgA = 0 //Initialize current Avg Strategy Profit
HeuristicsCycle = HeuristicsCycle + 1

For i = 1 to Reps Do
If positionperf(i) > 0 Then
WinCountA = WinCountA + 1 //Increment Current WinCount
EndIf
//StratAvgA = StratAvgA + (((PositionPerf(i)*countofposition[i]*100000)*-1)*-1)
StratAvgA = StratAvgA + (((PositionPerf(i)*pointvalue)*countofposition[i])/pipsize)

Next
StratAvgA = StratAvgA/Reps //Calculate Current Avg Strategy Profit
//Graph (PositionPerf(1)*countofposition[1]*100000)*-1 as "PosPerf1"
//Graph (PositionPerf(2)*countofposition[2]*100000)*-1 as "PosPerf2"
//Graph StratAvgA*-1 as "StratAvgA"
//once BestA = 300
//GRAPH BestA coloured (0,0,0) AS "BestA"
If StratAvgA >= StratAvgB Then
StratAvgB = StratAvgA //Update Best Strategy Profit
BestA = ValueX
EndIf
//once BestB = 300
//GRAPH BestB coloured (0,0,0) AS "BestB"
If WinCountA >= WinCountB Then
WinCountB = WinCountA  //Update Best Win Count
BestB = ValueX
EndIf

If WinCountA > WinCountB and StratAvgA > StratAvgB Then
Mode = 0
ElsIf WinCountA < WinCountB and StratAvgA < StratAvgB and Mode = 1 Then
ValueX = ValueX - (Increment*NIncPos)
NIncPos = NIncPos + 1
Mode = 2
ElsIf WinCountA >= WinCountB or StratAvgA >= StratAvgB and Mode = 1 Then
ValueX = ValueX + (Increment*PIncPos)
PIncPos = PIncPos + 1
Mode = 1
ElsIf WinCountA < WinCountB and StratAvgA < StratAvgB and Mode = 2 Then
ValueX = ValueX + (Increment*PIncPos)
PIncPos = PIncPos + 1
Mode = 1
ElsIf WinCountA >= WinCountB or StratAvgA >= StratAvgB and Mode = 2 Then
ValueX = ValueX - (Increment*NIncPos)
NIncPos = NIncPos + 1
Mode = 2
EndIf

If NIncPos > MaxIncrement or PIncPos > MaxIncrement Then
If BestA = BestB Then
ValueX = BestA
Else
If reps >= 10 Then
WeightedScore = 10
Else
WeightedScore = round((reps/100)*100)
EndIf
ValueX = round(((BestA*(20-WeightedScore)) + (BestB*WeightedScore))/20) //Lower Reps = Less weight assigned to Win%
EndIf
NIncPos = 1
PIncPos = 1
ElsIf ValueX > MaxValue Then
ValueX = MaxValue
ElsIf ValueX < MinValue Then
ValueX = MinValue
EndIF

Optimize = 0
EndIf

// Heuristics Algorithm 1 End

//ElsIf HeuristicsAlgo2 = 1 Then

//Heuristics Algorithm 2 Start

If (onmarket[1] = 1 and onmarket = 0) or (longonmarket[1] = 1 and longonmarket and countoflongshares < countoflongshares[1]) or (longonmarket[1] = 1 and longonmarket and countoflongshares > countoflongshares[1]) or (shortonmarket[1] = 1 and shortonmarket and countofshortshares < countofshortshares[1]) or (shortonmarket[1] = 1 and shortonmarket and countofshortshares > countofshortshares[1]) or (longonmarket[1] and shortonmarket) or (shortonmarket[1] and longonmarket) Then
optimize2 = optimize2 + 1
EndIf

If monthinit2 = 1 or monthinit2 = 3 or monthinit2 = 5 or monthinit2 = 7 or monthinit2 = 8 or monthinit2 = 10 or monthinit2 = 12 Then
MonthDays2 = 31
ElsIf monthinit2 = 4 or monthinit2 = 6 or monthinit2 = 9 or monthinit2 = 11 Then
MonthDays2 = 30
ElsIf monthinit2 = 2 Then
If (yearinit2/4 = round(yearinit2/4)) or (yearinit2/400 = round(yearinit2/400)) Then //haha not sure how exactly to do this
MonthDays2 = 29 //leap year
Else
MonthDays2 = 28
EndIf
EndIf

If (month = monthinit2 and day = dayinit2 + ResetPeriod2) or (month = monthinit2 + 1 and (day + (MonthDays2 - dayinit2)) >= ResetPeriod2) Then
ValueY = StartingValue2
WinCountB2 = 0
StratAvgB2 = 0
BestA2 = 0
BestB2 = 0
dayinit2 = day
monthinit2 = month
yearinit2 = year
EndIf

once ValueY = StartingValue2
once PIncPos2 = 1 //Positive Increment Position
once NIncPos2 = 1 //Neative Increment Position
once Optimize2 = 0 ////Initialize Heuristicks Engine Counter (Must be Incremented at Position Start or Exit)
once Mode2 = 1 //Switches between negative and positive increments
//once WinCountB2 = 3 //Initialize Best Win Count
//GRAPH WinCountB2 coloured (0,0,0) AS "WinCountB2"
//once StratAvgB2 = 4353 //Initialize Best Avg Strategy Profit
//GRAPH StratAvgB2 coloured (0,0,0) AS "StratAvgB2"

If Optimize2 = Reps2 Then
WinCountA2 = 0 //Initialize current Win Count
StratAvgA2 = 0 //Initialize current Avg Strategy Profit
HeuristicsCycle = HeuristicsCycle + 1

For i2 = 1 to Reps2 Do
If positionperf(i) > 0 Then
WinCountA2 = WinCountA2 + 1 //Increment Current WinCount
EndIf
//StratAvgA2 = StratAvgA2 + (((PositionPerf(i)*countofposition[i]*100000)*-1)*-1)
StratAvgA2 = StratAvgA2 + (((PositionPerf(i)*pointvalue)*countofposition[i])/pipsize)
Next
StratAvgA2 = StratAvgA2/Reps2 //Calculate Current Avg Strategy Profit
//Graph (PositionPerf(1)*countofposition[1]*100000)*-1 as "PosPerf1-2"
//Graph (PositionPerf(2)*countofposition[2]*100000)*-1 as "PosPerf2-2"
//Graph StratAvgA2*-1 as "StratAvgA2"
//once BestA2 = 300
//GRAPH BestA2 coloured (0,0,0) AS "BestA2"
If StratAvgA2 >= StratAvgB2 Then
StratAvgB2 = StratAvgA2 //Update Best Strategy Profit
BestA2 = ValueY
EndIf
//once BestB2 = 300
//GRAPH BestB2 coloured (0,0,0) AS "BestB2"
If WinCountA2 >= WinCountB2 Then
WinCountB2 = WinCountA2  //Update Best Win Count
BestB2 = ValueY
EndIf

If WinCountA2 > WinCountB2 and StratAvgA2 > StratAvgB2 Then
Mode = 0
ElsIf WinCountA2 < WinCountB2 and StratAvgA2 < StratAvgB2 and Mode2 = 1 Then
ValueY = ValueY - (Increment2*NIncPos2)
NIncPos2 = NIncPos2 + 1
Mode2 = 2
ElsIf WinCountA2 >= WinCountB2 or StratAvgA2 >= StratAvgB2 and Mode2 = 1 Then
ValueY = ValueY + (Increment2*PIncPos2)
PIncPos2 = PIncPos2 + 1
Mode = 1
ElsIf WinCountA2 < WinCountB2 and StratAvgA2 < StratAvgB2 and Mode2 = 2 Then
ValueY = ValueY + (Increment2*PIncPos2)
PIncPos2 = PIncPos2 + 1
Mode2 = 1
ElsIf WinCountA2 >= WinCountB2 or StratAvgA2 >= StratAvgB2 and Mode2 = 2 Then
ValueY = ValueY - (Increment2*NIncPos2)
NIncPos2 = NIncPos2 + 1
Mode2 = 2
EndIf

If NIncPos2 > MaxIncrement2 or PIncPos2 > MaxIncrement2 Then
If BestA2 = BestB2 Then
ValueY = BestA
Else
If reps2 >= 10 Then
WeightedScore2 = 10
Else
WeightedScore2 = round((reps2/100)*100)
EndIf
ValueY = round(((BestA2*(20-WeightedScore2)) + (BestB2*WeightedScore2))/20) //Lower Reps = Less weight assigned to Win%
EndIf
NIncPos2 = 1
PIncPos2 = 1
ElsIf ValueY > MaxValue2 Then
ValueY = MaxValue2
ElsIf ValueY < MinValue2 Then
ValueY = MinValue2
EndIF

Optimize2 = 0
EndIf

// Heuristics Algorithm 2 End

//EndIf

//c1=average[valuex](close)
//c2=average[valuey](close)

//
//condbuy =c1 crosses over c2 and rsi[14](close)<70
//condsell=c1 crosses under c2 and rsi[14](close)>30

//
//if condbuy then
//buy at market
//endif
//if condsell then
//sellshort at market
//endif

//pp=positionperf(0)*100

//if pp<-0.125 then
//sell at market
//exitshort at market
//endif

//set stop %loss 0.5 // exit sooner on performance criteria above
//set target %profit 0.25

graph valuex coloured(121,141,35,255)
graph valuey coloured(255,0,0,255)
//endif

indicator1 = ExponentialAverage[valuex](close)
indicator2 = ExponentialAverage[valuey](close)
c1 = (indicator1 CROSSES OVER indicator2)

indicator3 = WilderAverage[30](close)

c2 = (close > indicator3)

IF c1 AND c2 THEN
BUY 1 SHARES AT MARKET
ENDIF

// Conditions pour ouvrir une position en vente à découvert
indicator4 = ExponentialAverage[valuex](close)
indicator5 = ExponentialAverage[valuey](close)
c3 = (indicator4 CROSSES UNDER indicator5)

indicator6 = WilderAverage[30](close)
c4 = (close < indicator6)

IF c3 AND c4 THEN
SELLSHORT 1 SHARES AT MARKET
ENDIF

// Stops et objectifs
SET STOP pLOSS 8
SET TARGET pPROFIT 4
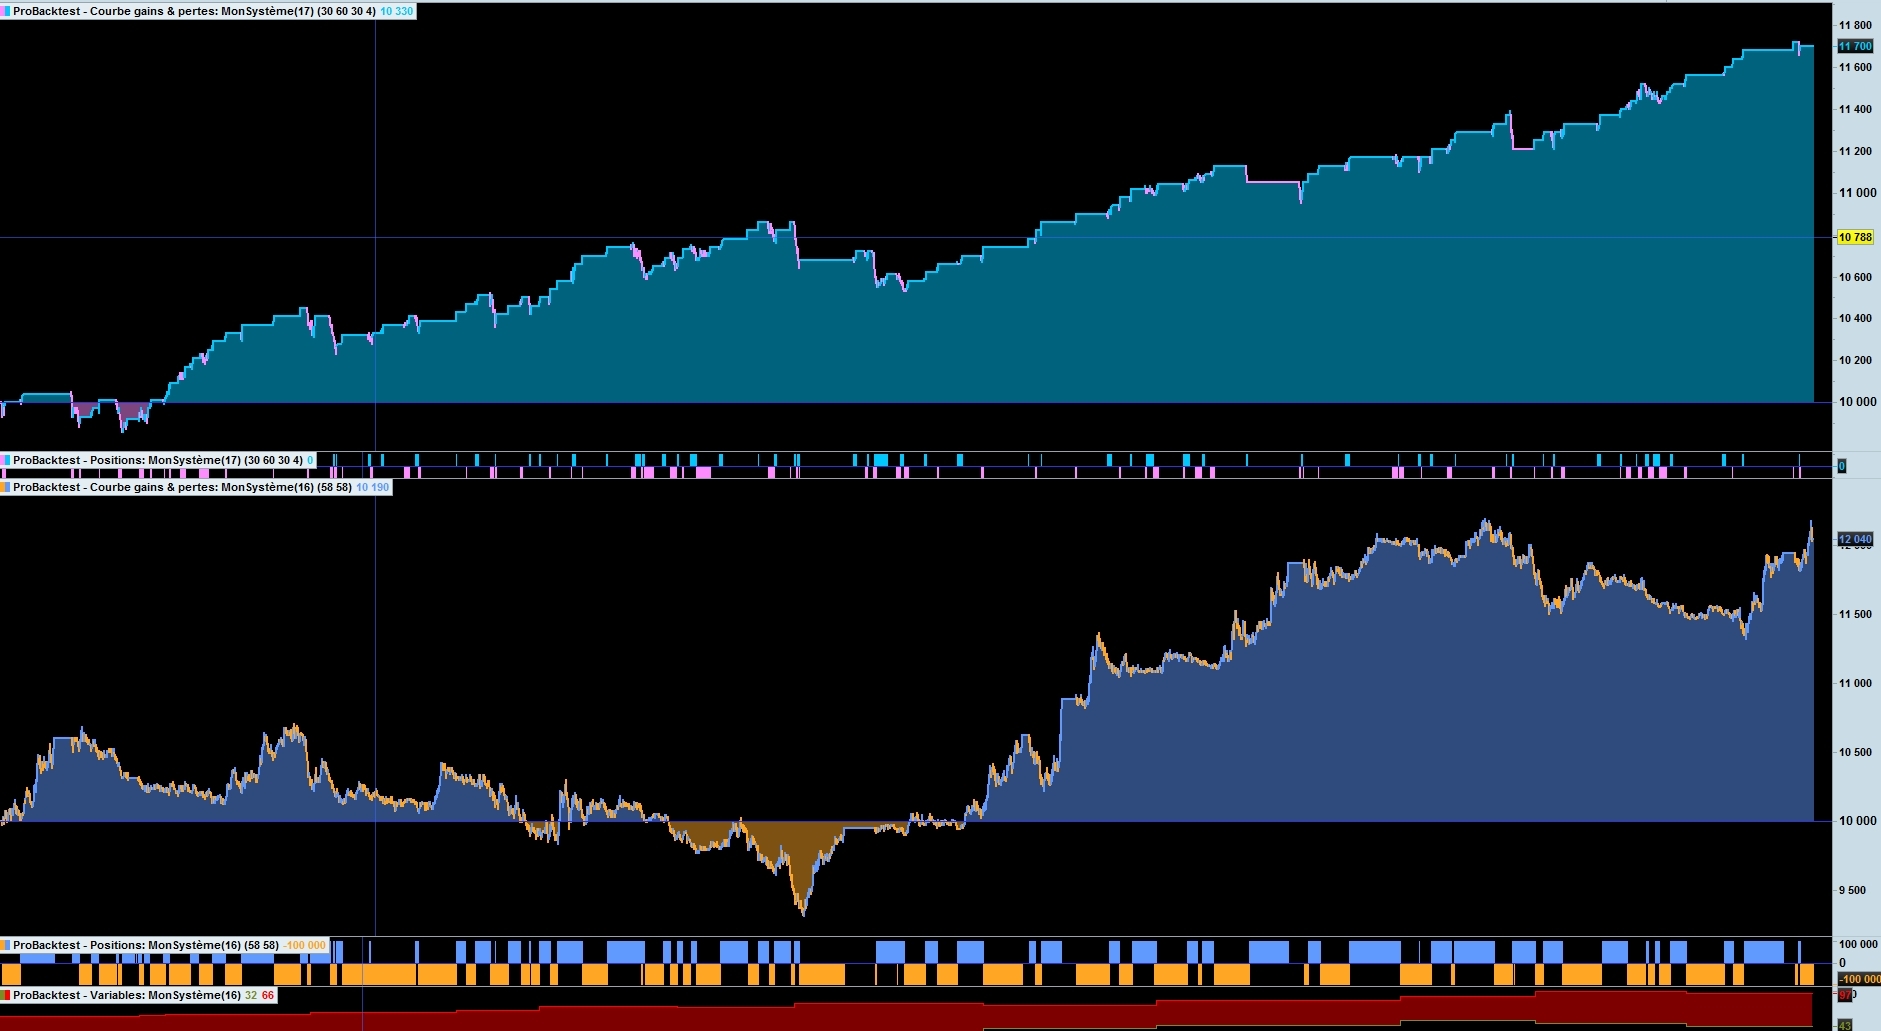
And I compare the results on 2 graph. But sadly the results are worst with the learning machine
Can you test too with this procedure (I think it’s good) on another simple code: Backtest to determine the “best” values to put in starting values and compare
May be it’s the code or me 🙂 but it’s strange the results are worst
See U Coders