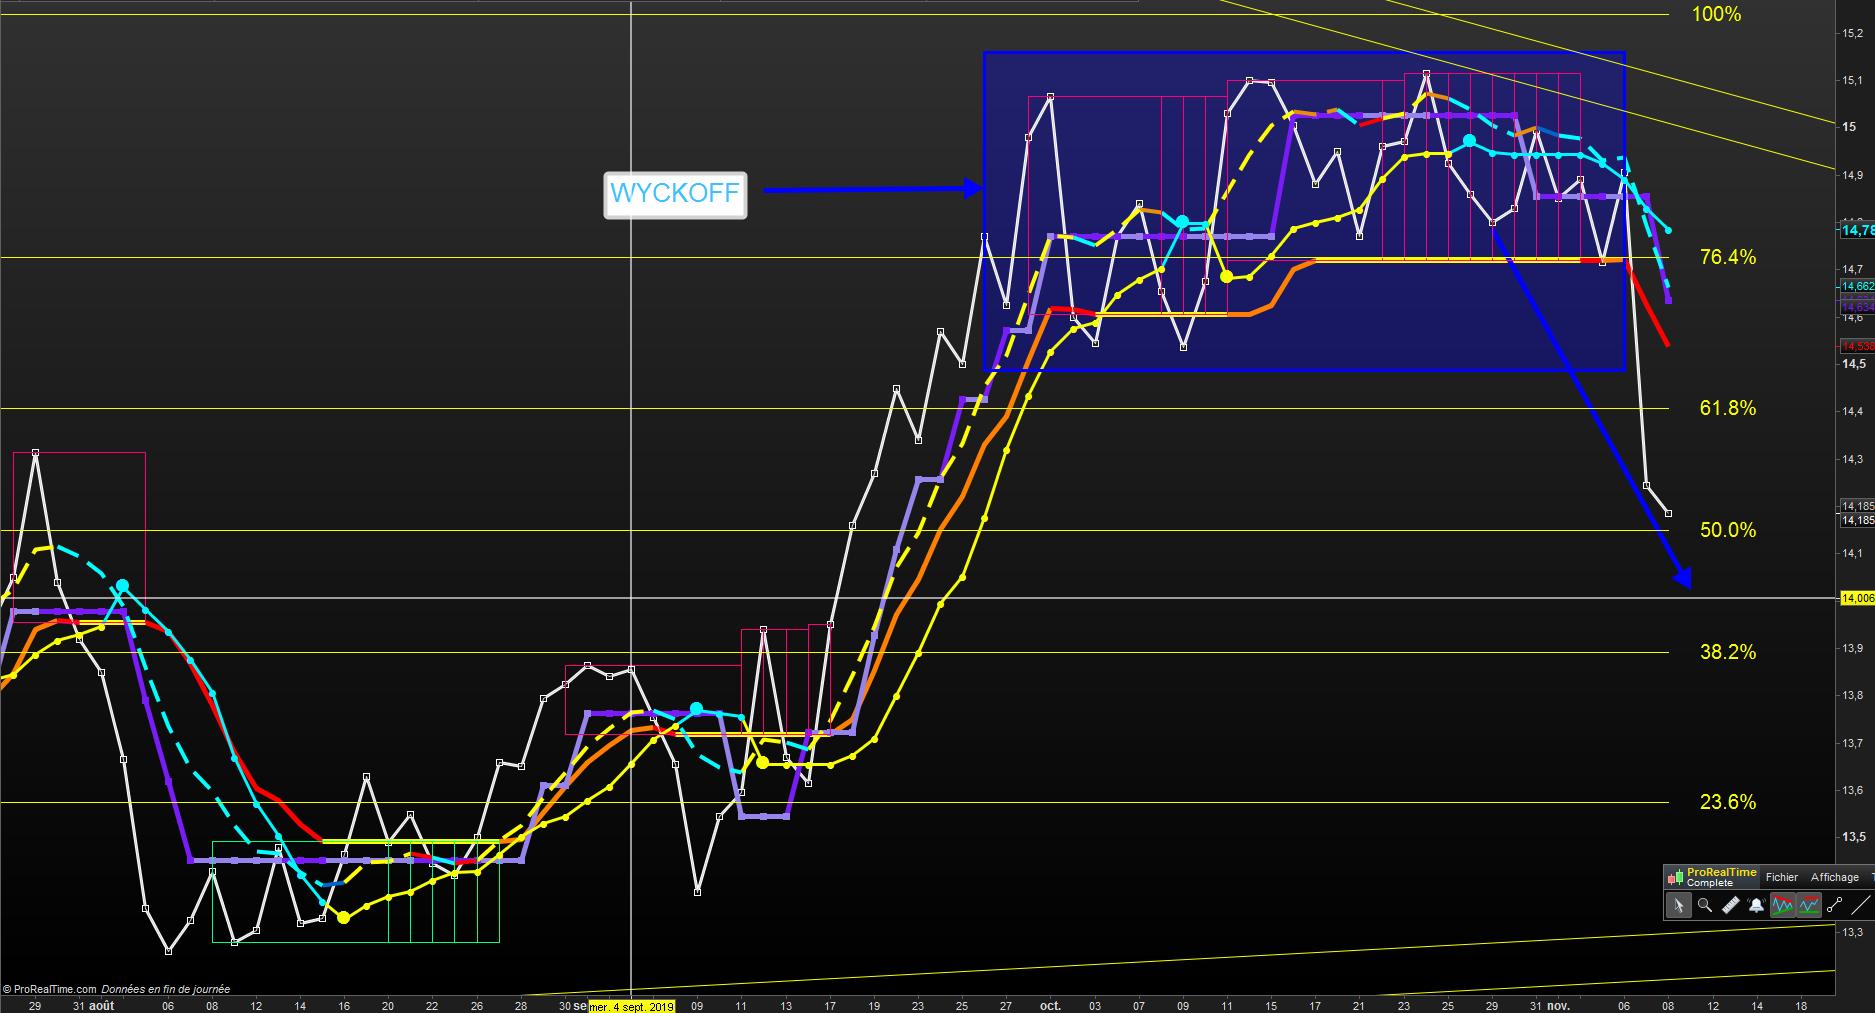
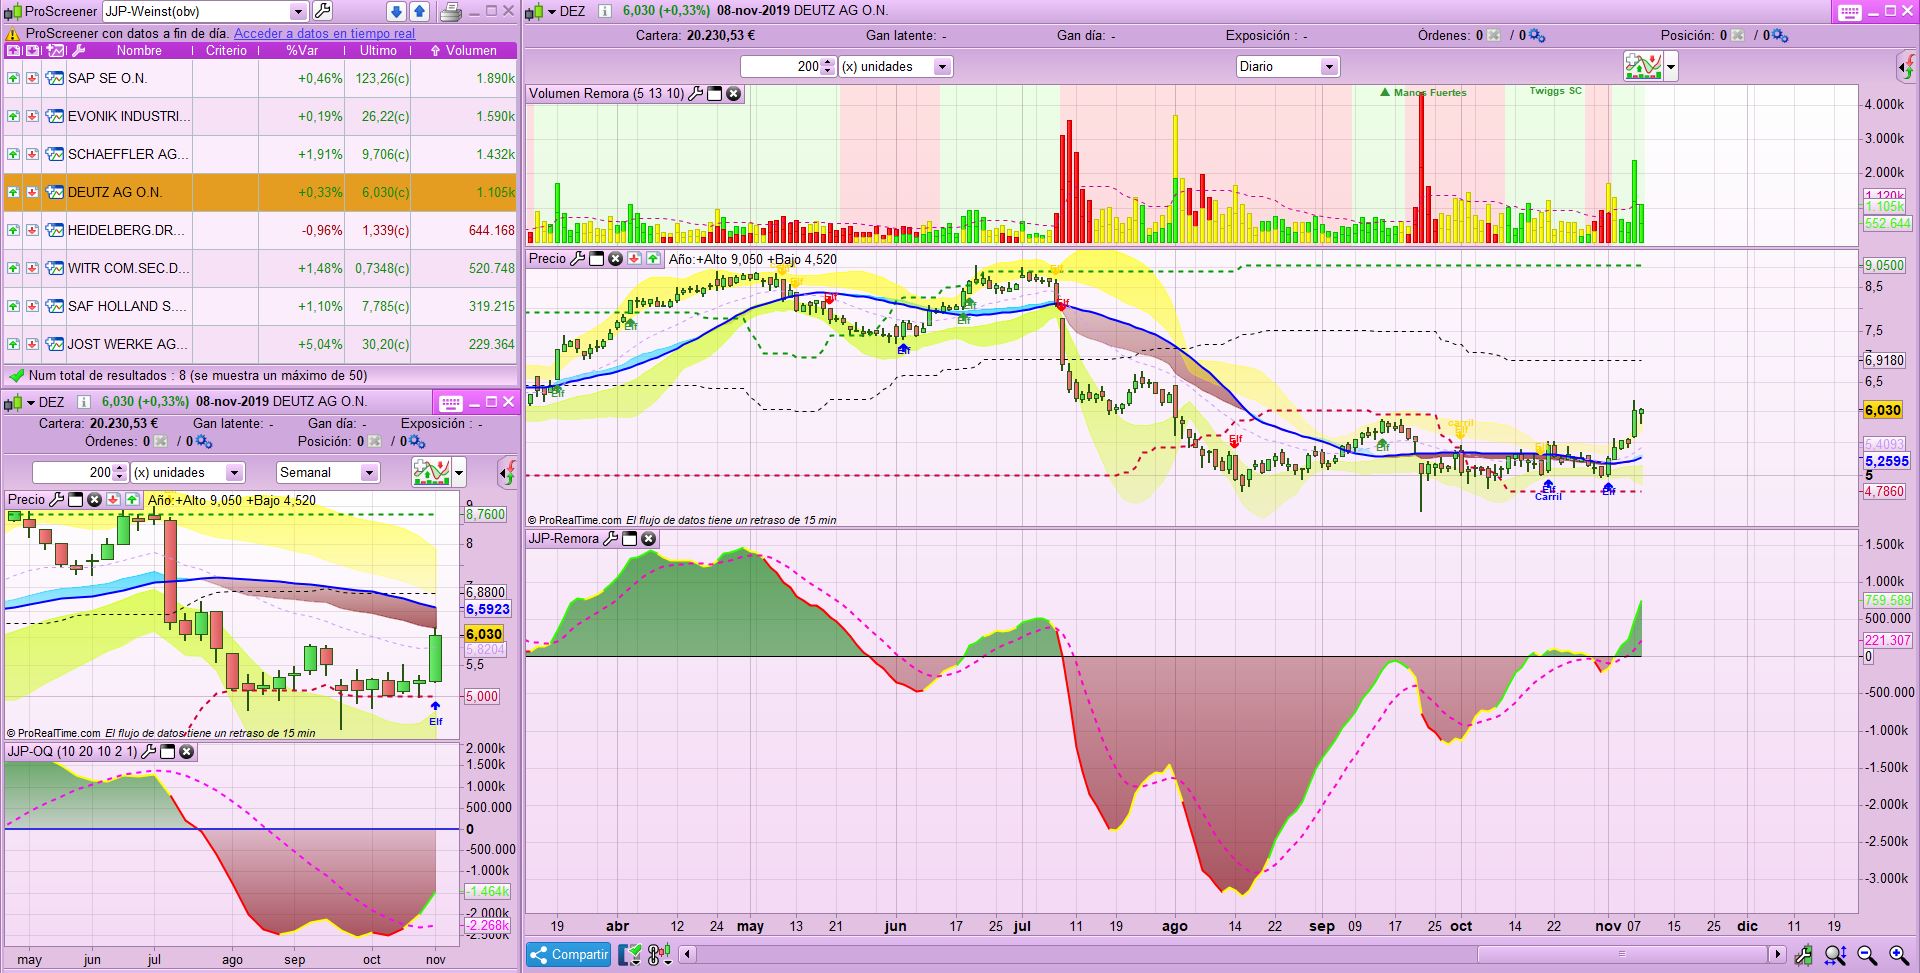
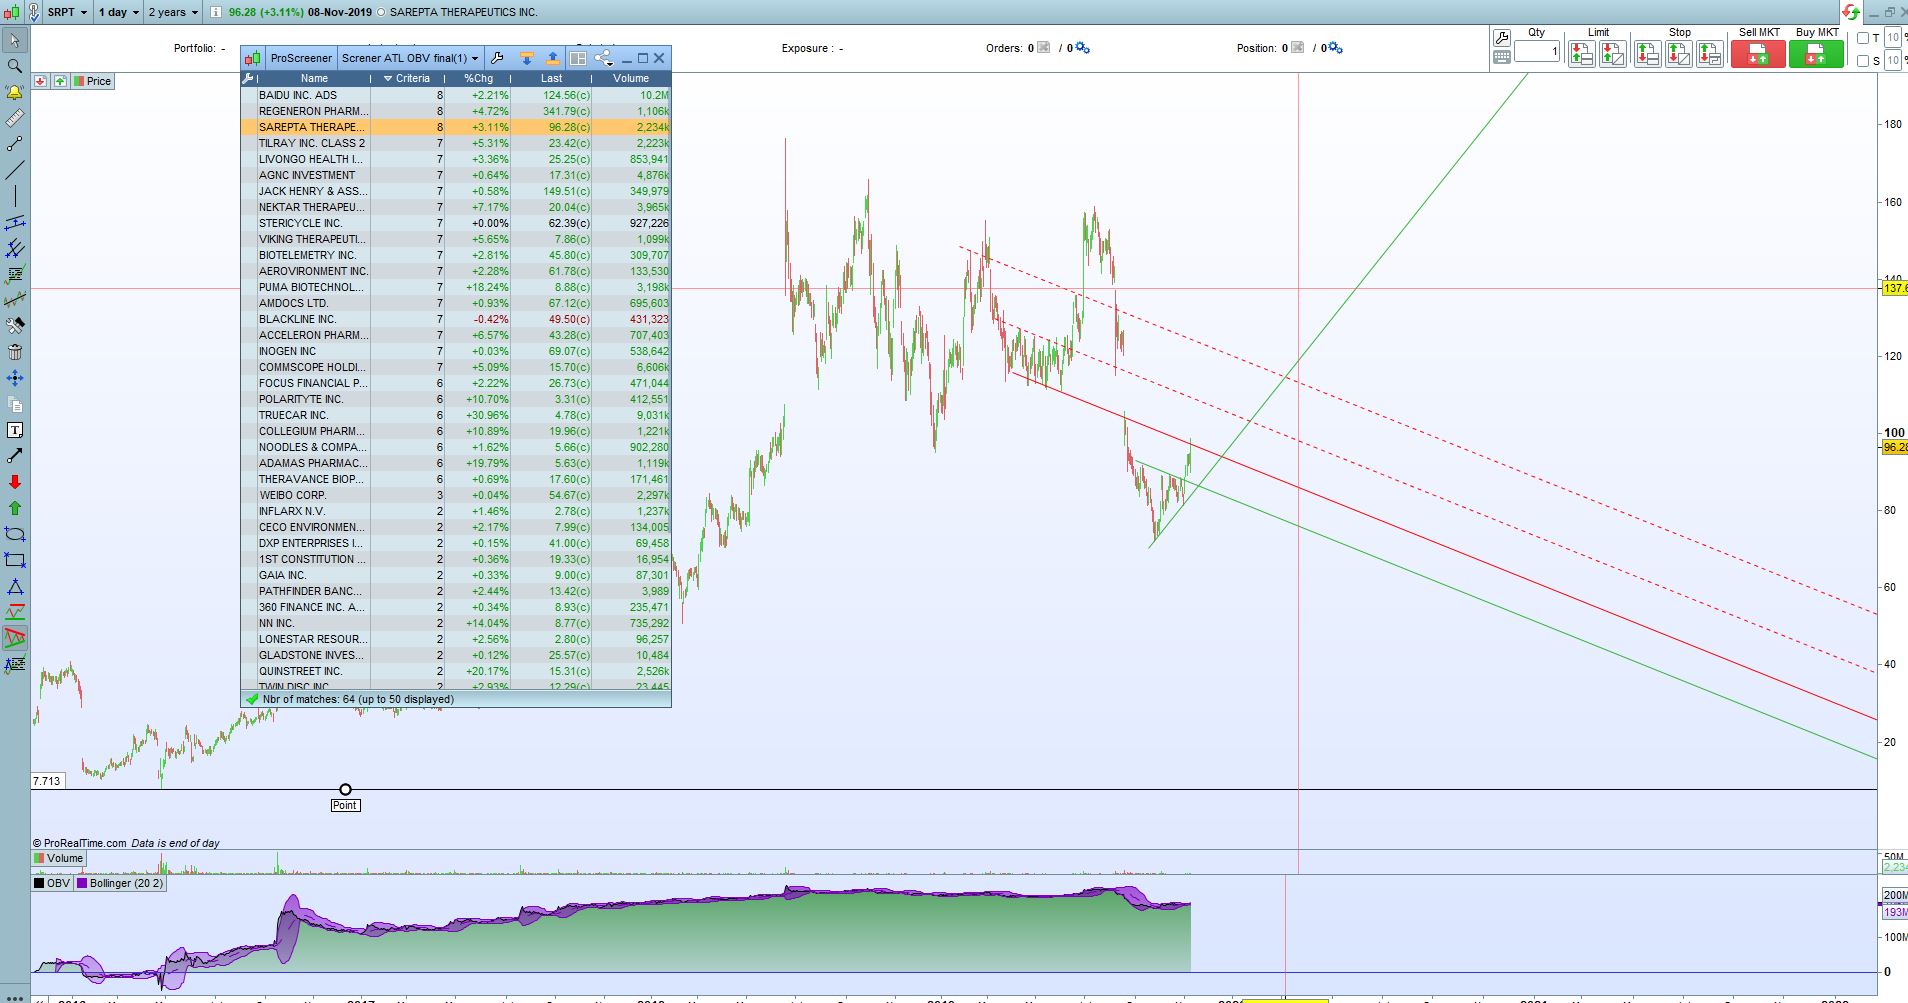
Why do you think it is not the case? If the lowest low of all data is 40$, the share should be set between 40$ and 80$! and that’s an huge gap 🙂
Hello,
The obv performs the calculations based on the volume, but I think it would be more appropriate to replace the volume with the CPM (volume * close). Once the obv (CPM) was calculated, the moment derived from averages could be calculated.
For example,
exponentialaverage [10] (obv) -exponentialaverage [20] (obv), to subsequently apply bollinguer bands on the indicator we have calculated. Once, that we have this MACD (OBV) we would apply the ideas of Squeeze de J.F. Carter, to calculate where there is a compression of the obv, and I think that in this way we could detect market phases associated with accumulation or distribution. I will try this weekend to write the code.
A good example of Wyckoff concept this week : look at ENGIE
Fr7Participant
Master
Hello,
I’m very interested in the code. And after reading everything I think it would look like this …
But there is an error in the calculation of OBV between lines 5 and 8…..
//ATL All time low identification
ATL = lowest[max(1,BarIndex)](low)
//When the second day’s price closes above the prior day’s close,
if close>close[1] then
OBV=OBV+volume
else
//If prices close lower on the second day,
OBV=OBV−volume
endif
myOBV =MACD[10,20,10](OBV)
avgOBV=average[20](myOBV)
stdevOBV=2*std[20](myOBV)
BollUp = avgOBV+stdevOBV
//ATL zone and volume activity
c1=close<2*ATL
c2=myOBV>BollUP
screener[ c1 and c2 ]
Me podrias explicar el significado o que buscamos con el ATL?
JJ Tec – English only in the English language forums please.
Hello,
I do not understand the purpose of the ATL. Could you explain its use? .. what do we pursue? … what does it mean?
Hello everyone
This is the modification I have proposed. Could you explain to me what we look for with the ATL?
//ATL All time low identification
ATL = lowest[max(1,BarIndex)](low)
Percorto=10
Perlargo=20
//PerMed=10
// Indicador ReX
Miobv=obv(close)
ReX=EXPONENTIALAVERAGE[PerCorto](MIOBv)-EXPONENTIALAVERAGE[PerLargo](MIOBv)
// Bandas sobre ReX
PBB=20
sstd = std[PBB](rex)
upper = (sstd*2+(exponentialaverage[PBB](ReX)))
//ATL zone and volume activity
c1=close<2*ATL
c2=Rex>Upper
vol=volume>200000
SCREENER[ c1 and c2 and vol ]
@JJ Tech
The idea with ATL is to find the low point of startup, a growing company that generates grow = share price is expetected to rise.
Why do you think it is not the case? If the lowest low of all data is 40$, the share should be set between 40$ and 80$! and that’s an huge gap 🙂
Dear Nicolas
Please find an example SAREPTA is returned by the screener
ATL= 7
Curent price is 96
The problem comes from the scanning period = 2 years, I would like the ATL of the all barindex period
Hello, did you have sorted out on your side? On my side it is still not working.
Kind regards,
Blue