Paul
PaulParticipant
Master
@RICHI71
Your 100% correct.
The code displayed here is old. Here’s the current one I ‘ve been testing with.
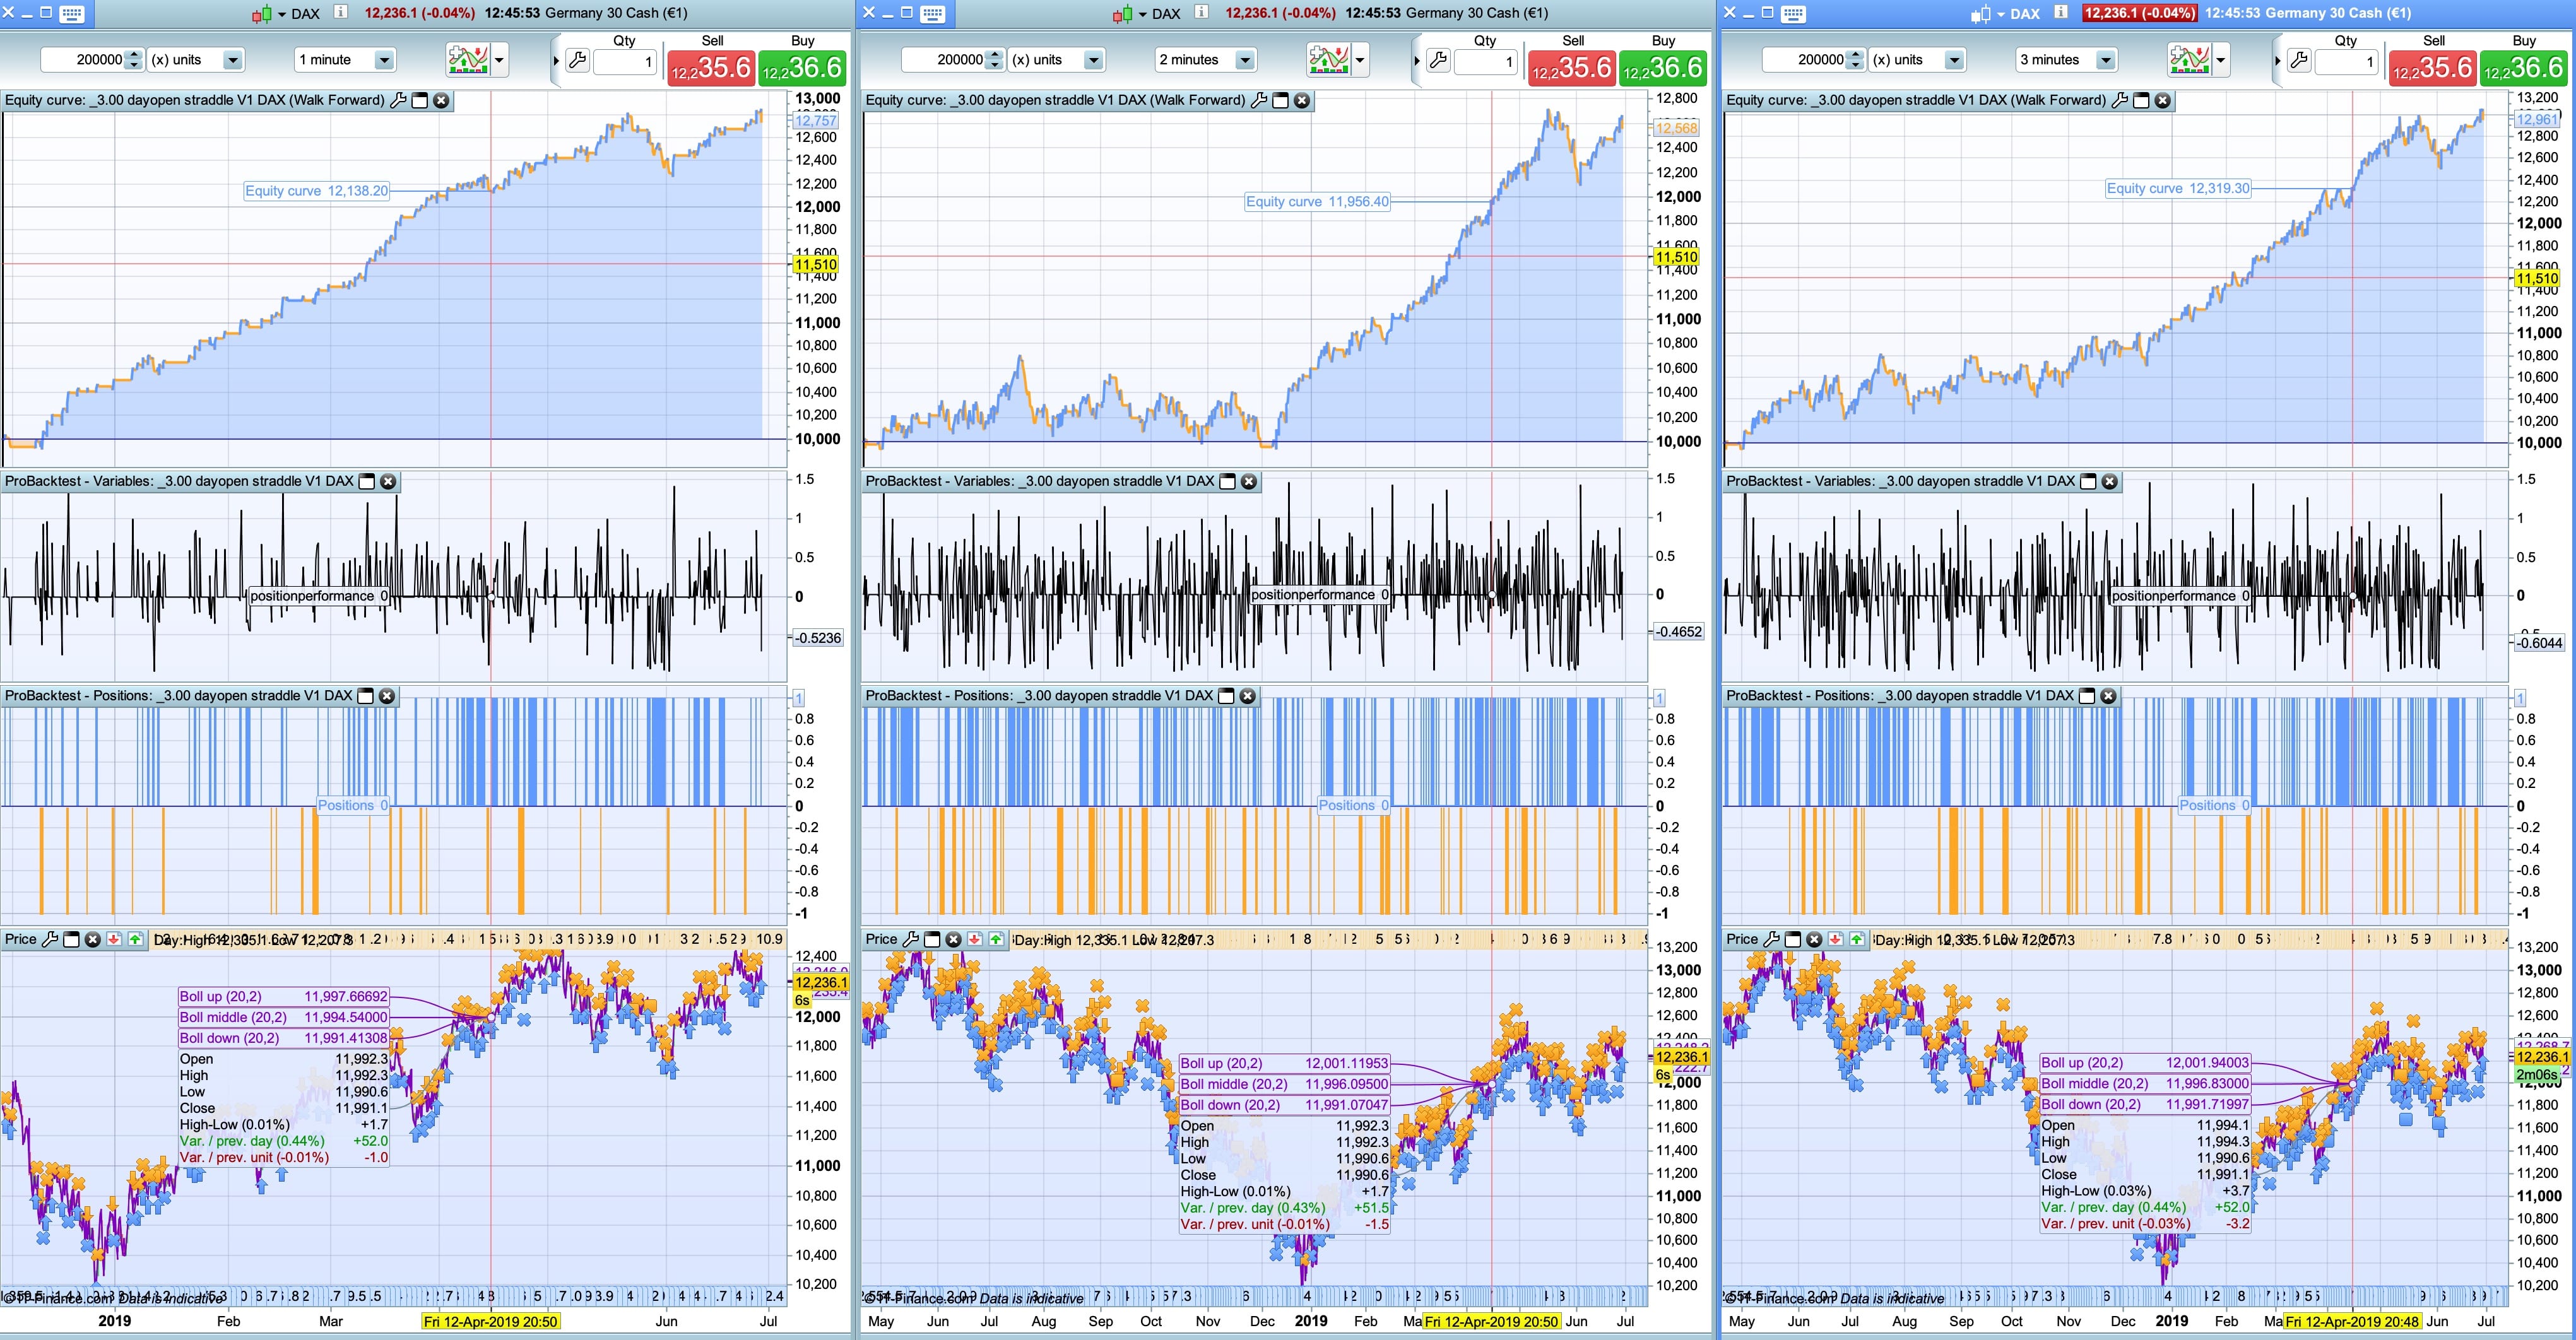
You can run this code on 200k bars 1 minute but it’s slow. No favorite!
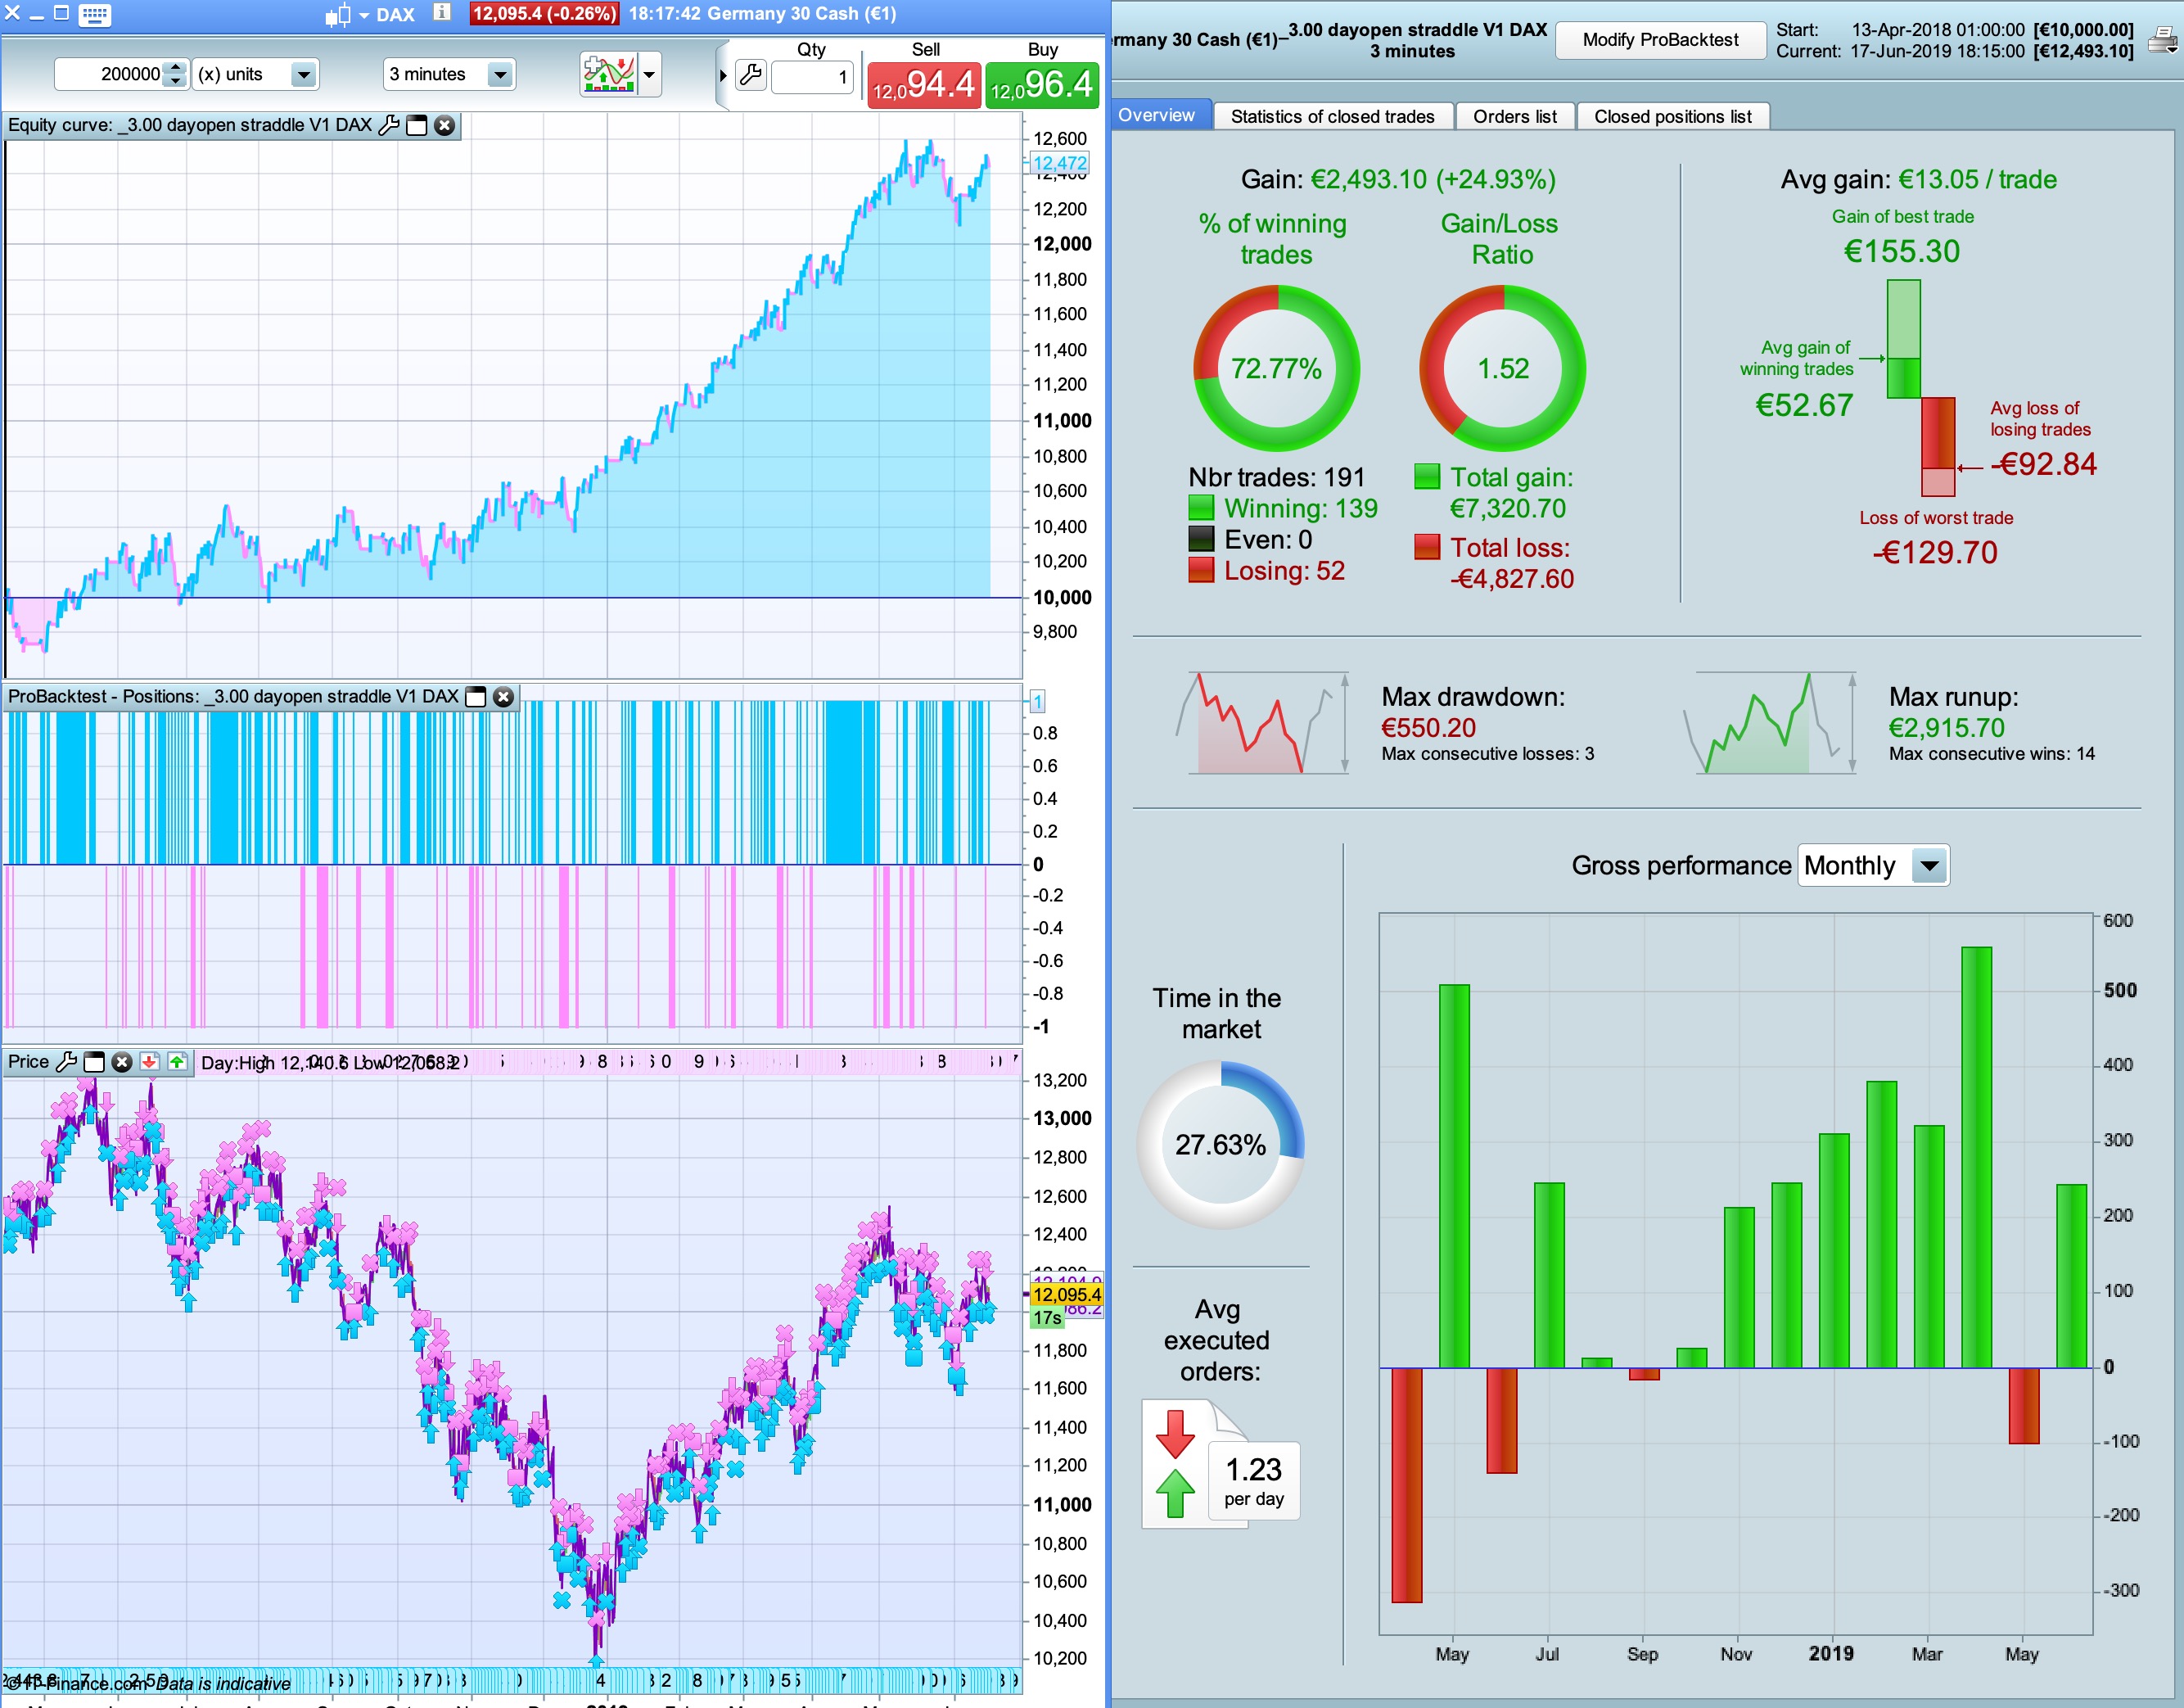
When set to 3 minute 200k bars it shows it doesn’t work in a downtrend.
did you test this code with others indices or currencies?
PaulParticipant
Master
no, this code is only tried on the dax.
Al parts have had a lot of detail and work nicely.
Not everything is used, like days to exclude or include or exclude lunchtime trading. But it’s a nice template for other strategies.
Here I focussed on the Midlevel day indicator in an effort to try not to trade in low or flat ranging markets.
Still the short side can have improvements, but I ran out of ideas.
Anyway, maybe it’s nice to try on i.e. eurusd and take the same concept?
Good morning!
How do we adjust the code to the different timeframes? You said something about de NOP (“NOP 15 for 3 min, NOP 25 for 10min,NOP 30 for 15min), but in the code I’m confused because the are nopl and nops. Should we use variable optimization for those two variables? Is there anything else that we should change for the different 3 min, 10 min or 15 min?
Also using the code without any modification I realised that it works best for 2 min graphic. What do you think about that?
If there are more changes to apply between the different times I would love to have the updated codes for each one if possible.
Thank you so much for your work!!! Keep it up!
PaulParticipant
Master
@xpiga
I started out with NOP (number of points) the same for long & short and later divided it up to improve performance in backtesting. Over-optimising.
But if you run anchored WF test most of the times the values 2 for long and 14 for short (1min TF) were the ones for each OOS period.
Maybe 2 minutes can have a nice performance too if you wf.
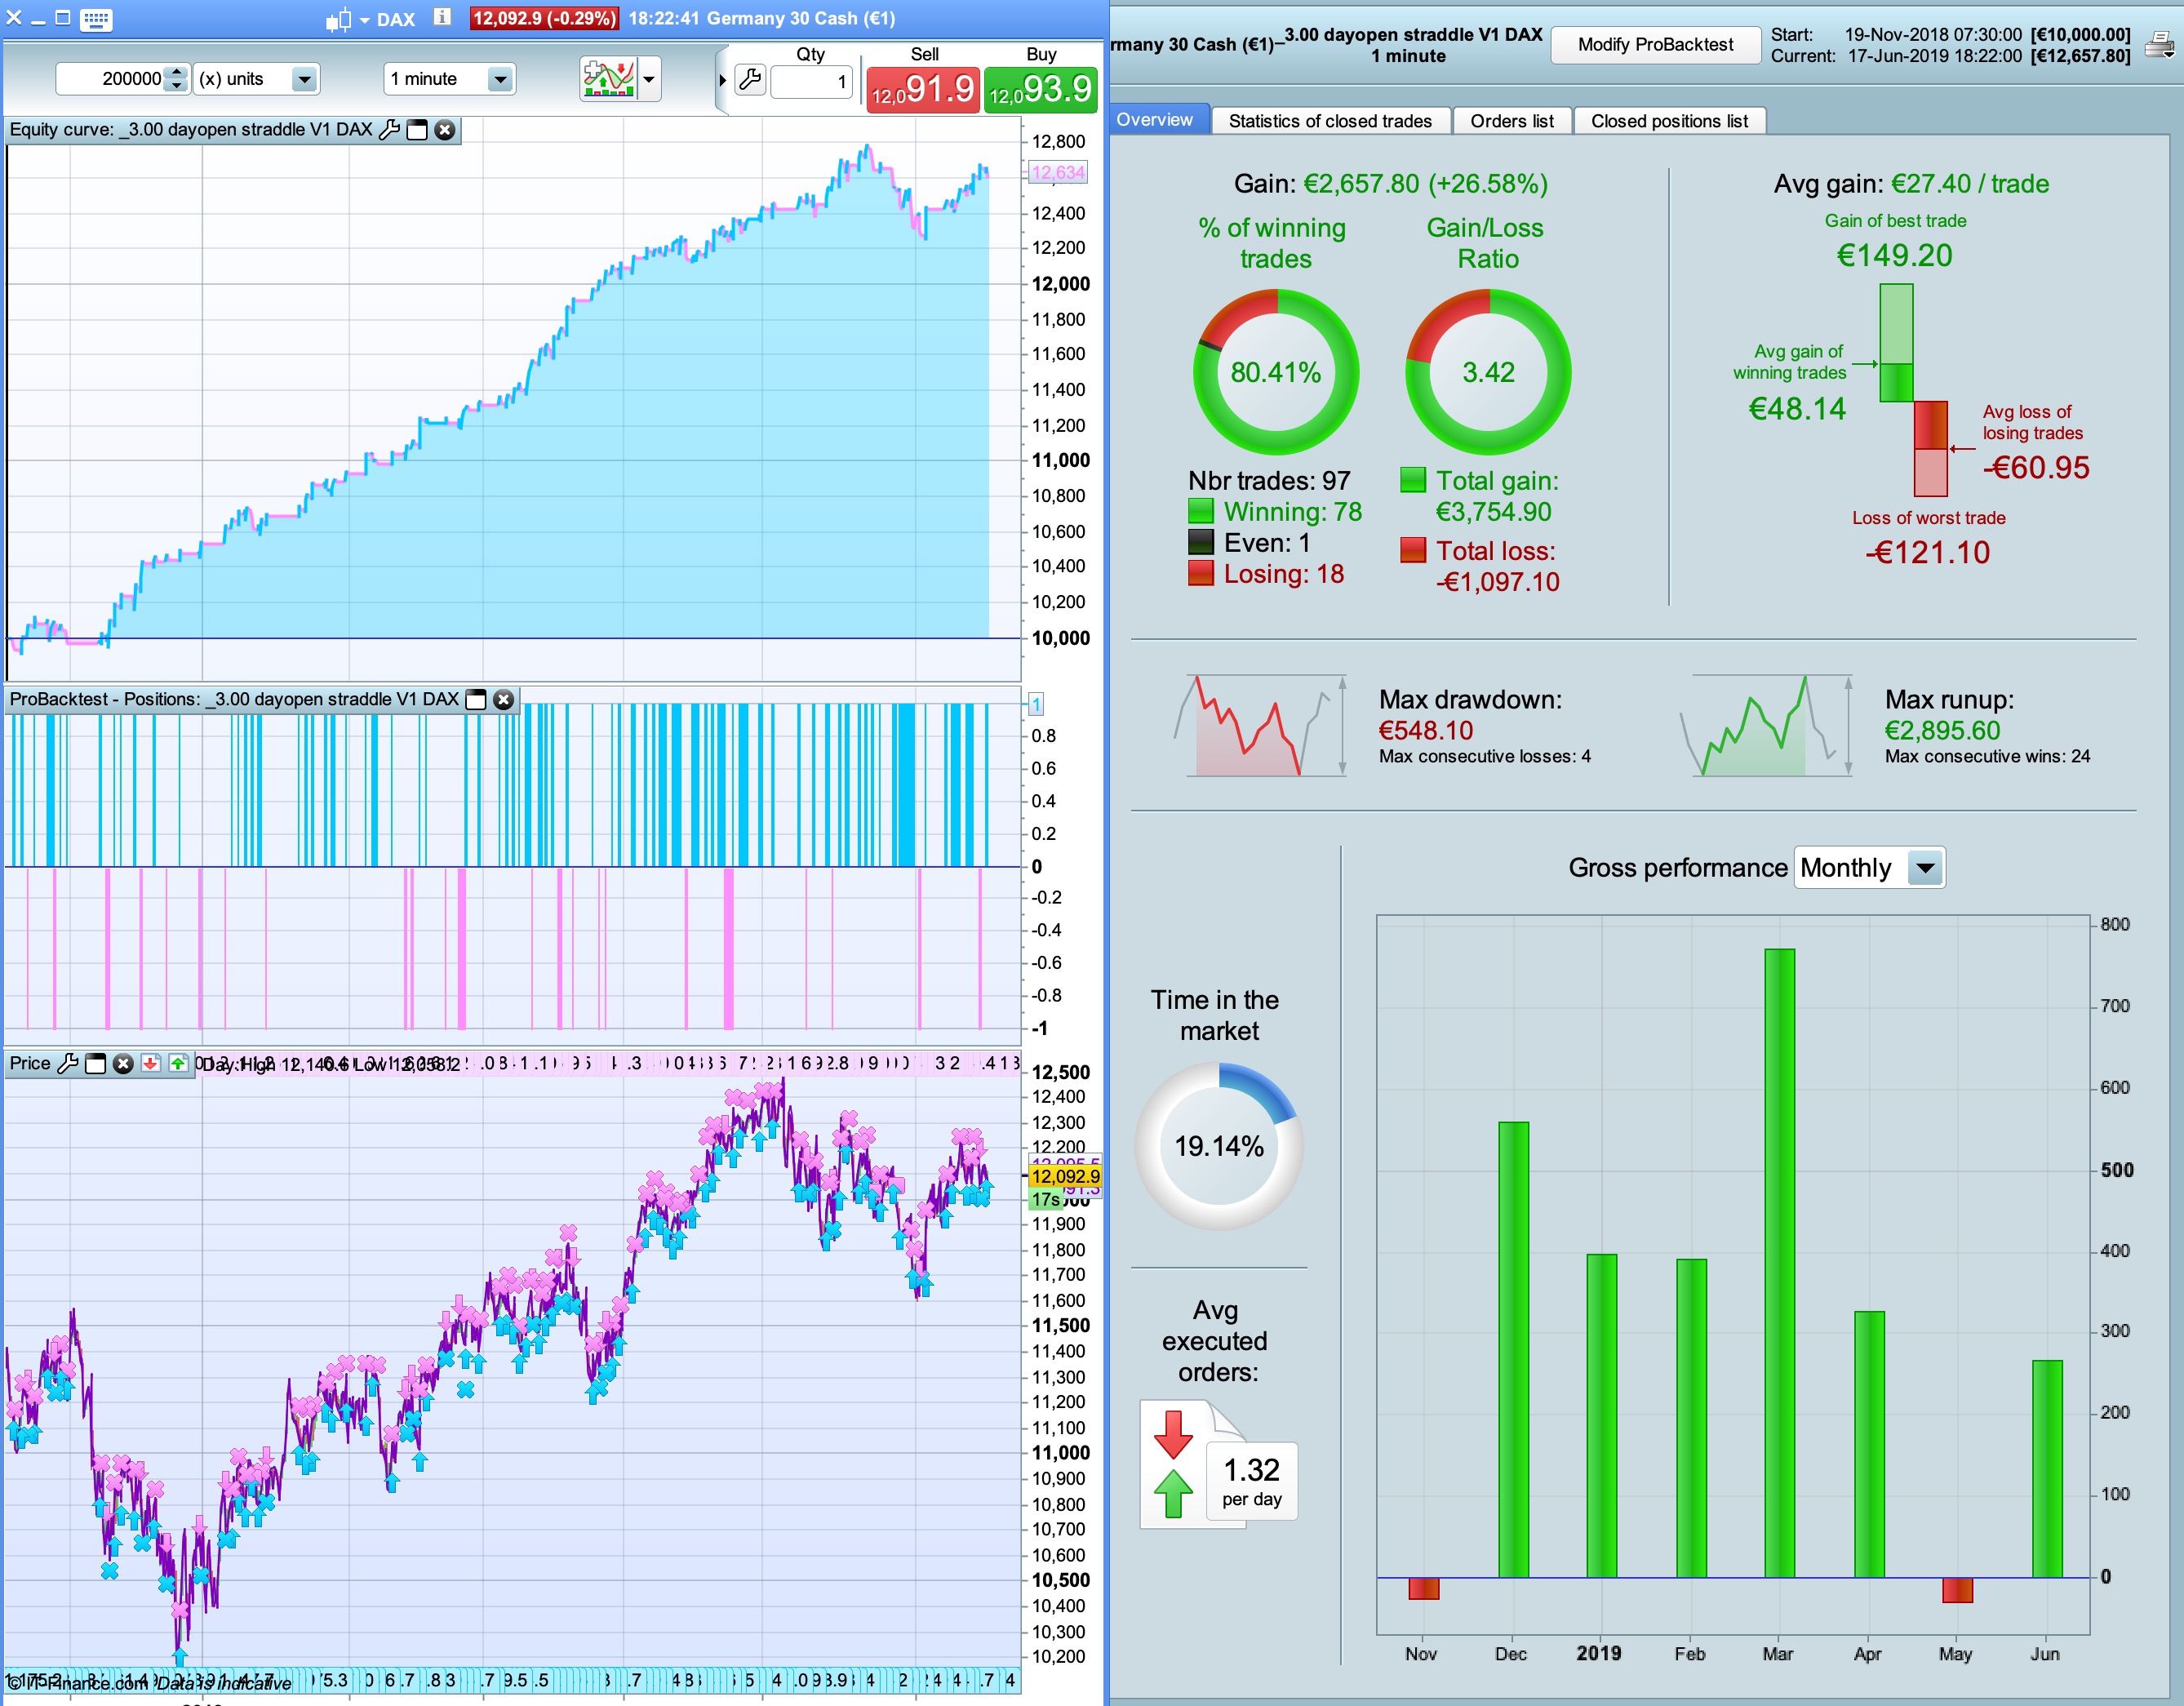
In the end I found that 1 minute works best, but maybe that’s changed.
@winnie37 Tried on eurusd, but didn’t get interesting results
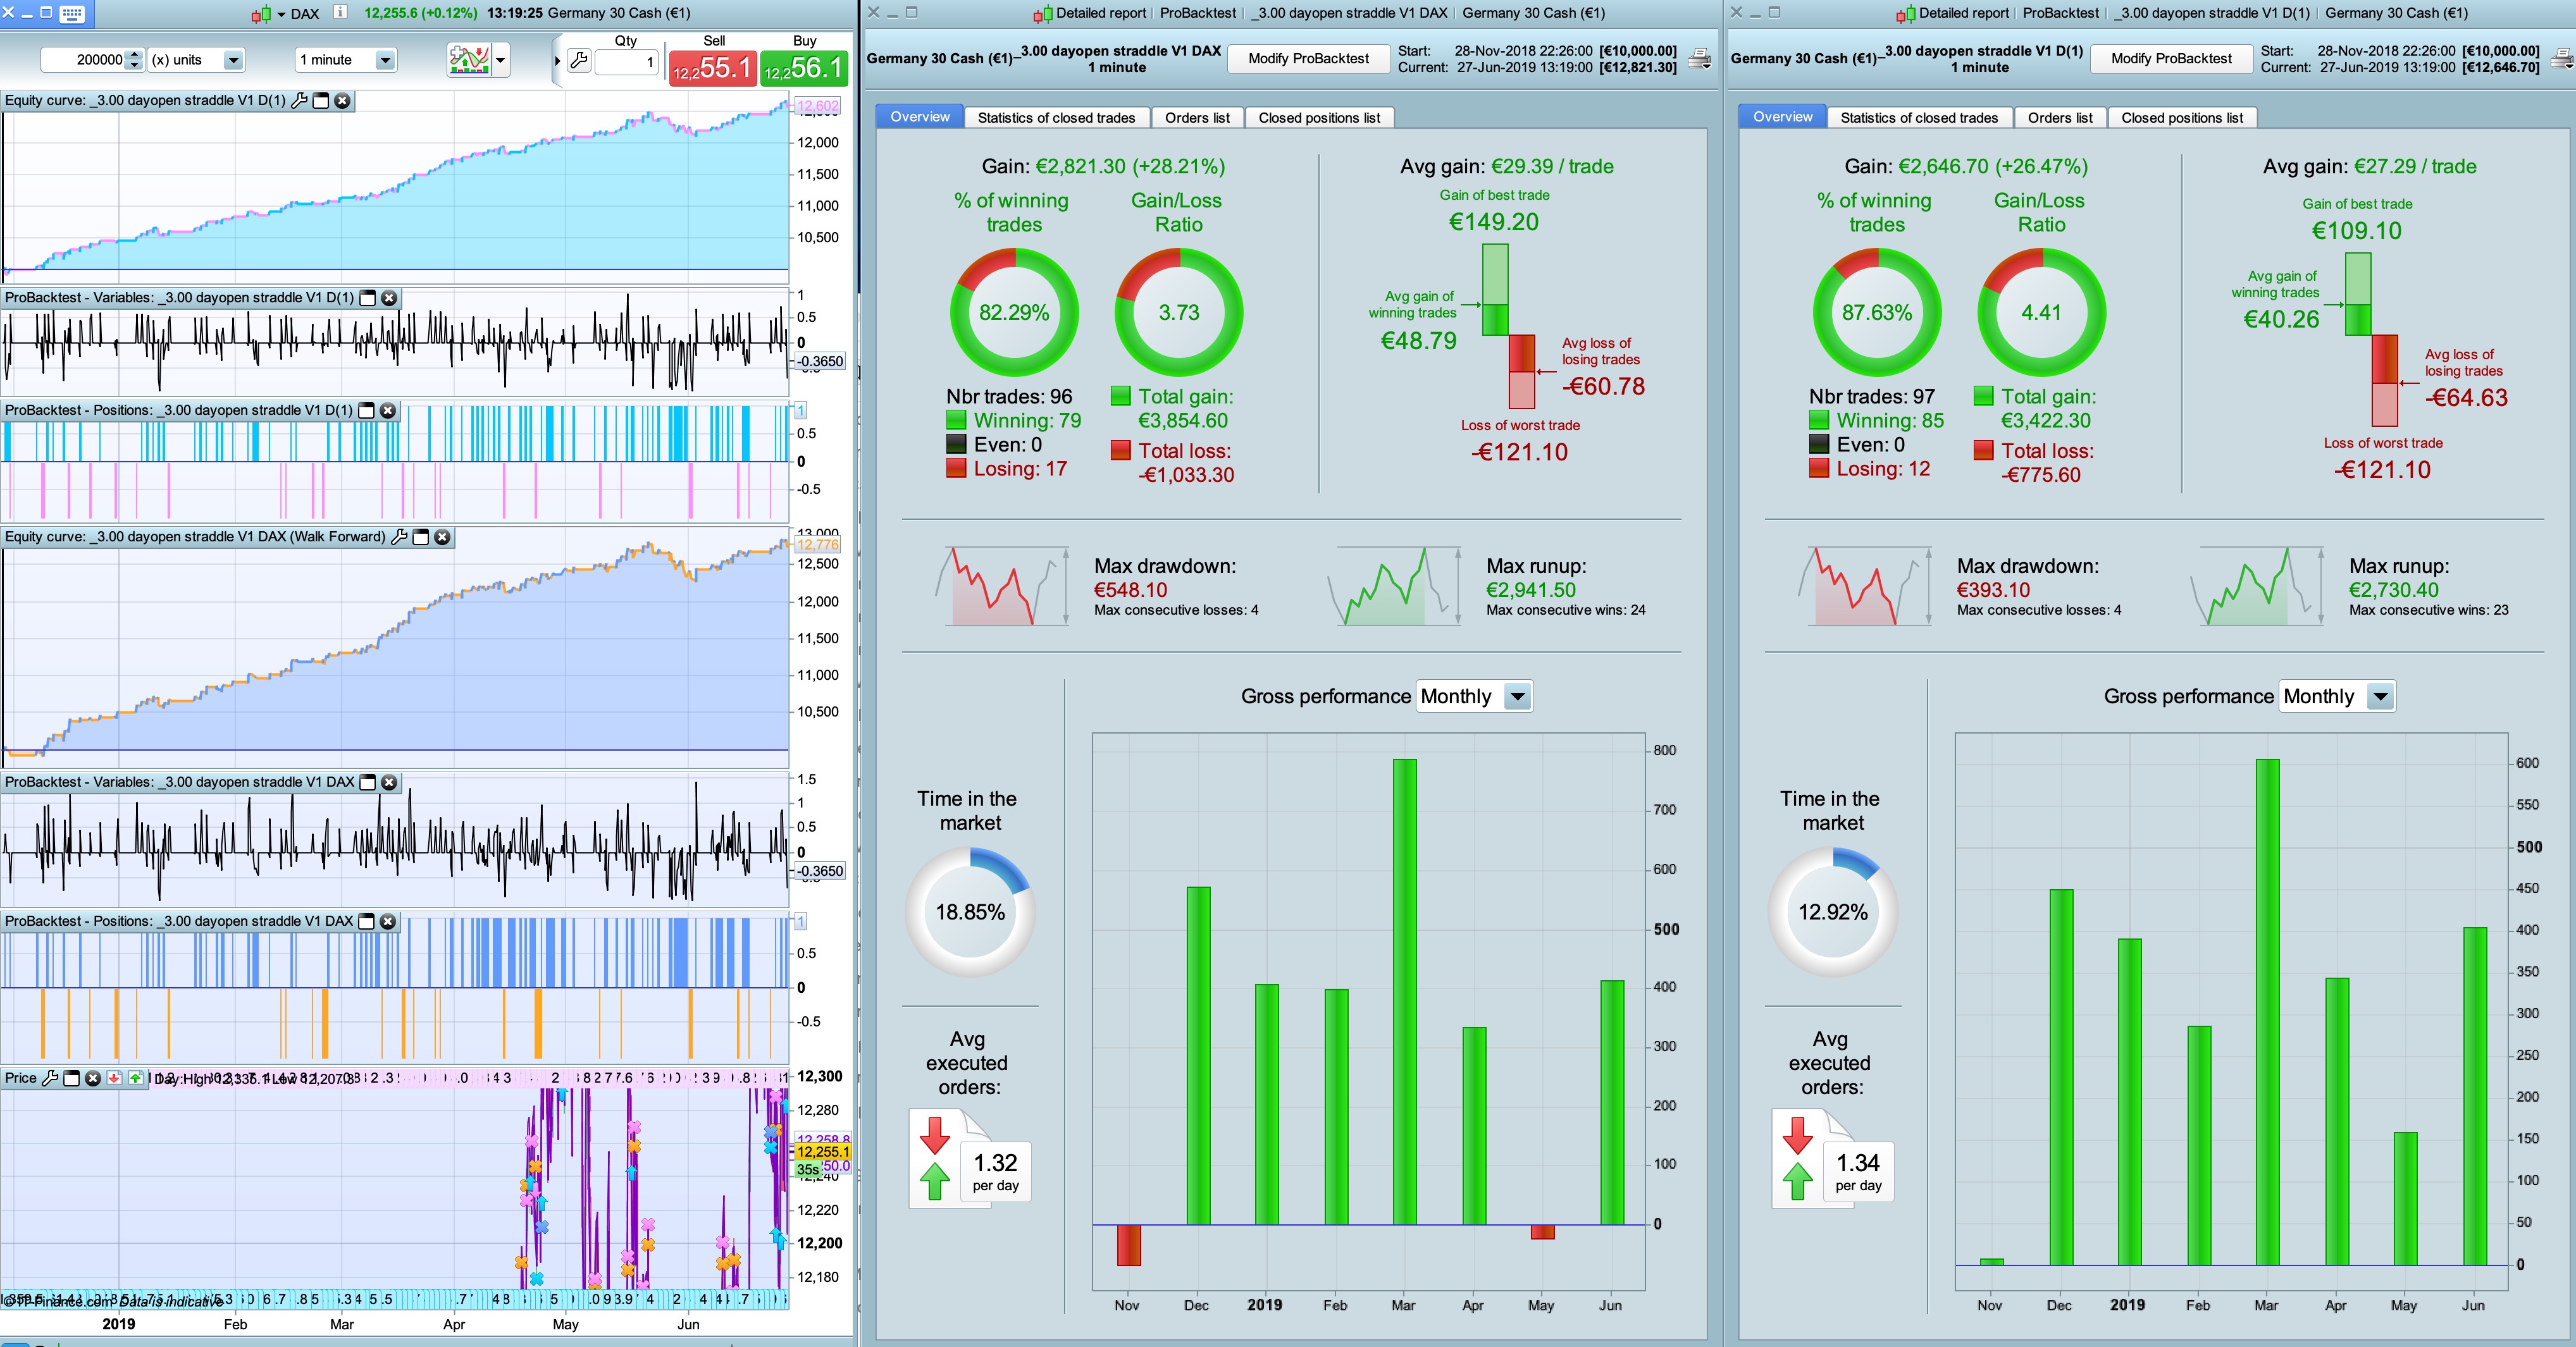
The thing I don’t like with this code, it has to run a 1% (or close to 1%) stoploss to get results.
Also trailing-stop makes things slow to test so as alternative I experiment with this, in part of that of my other strategy,
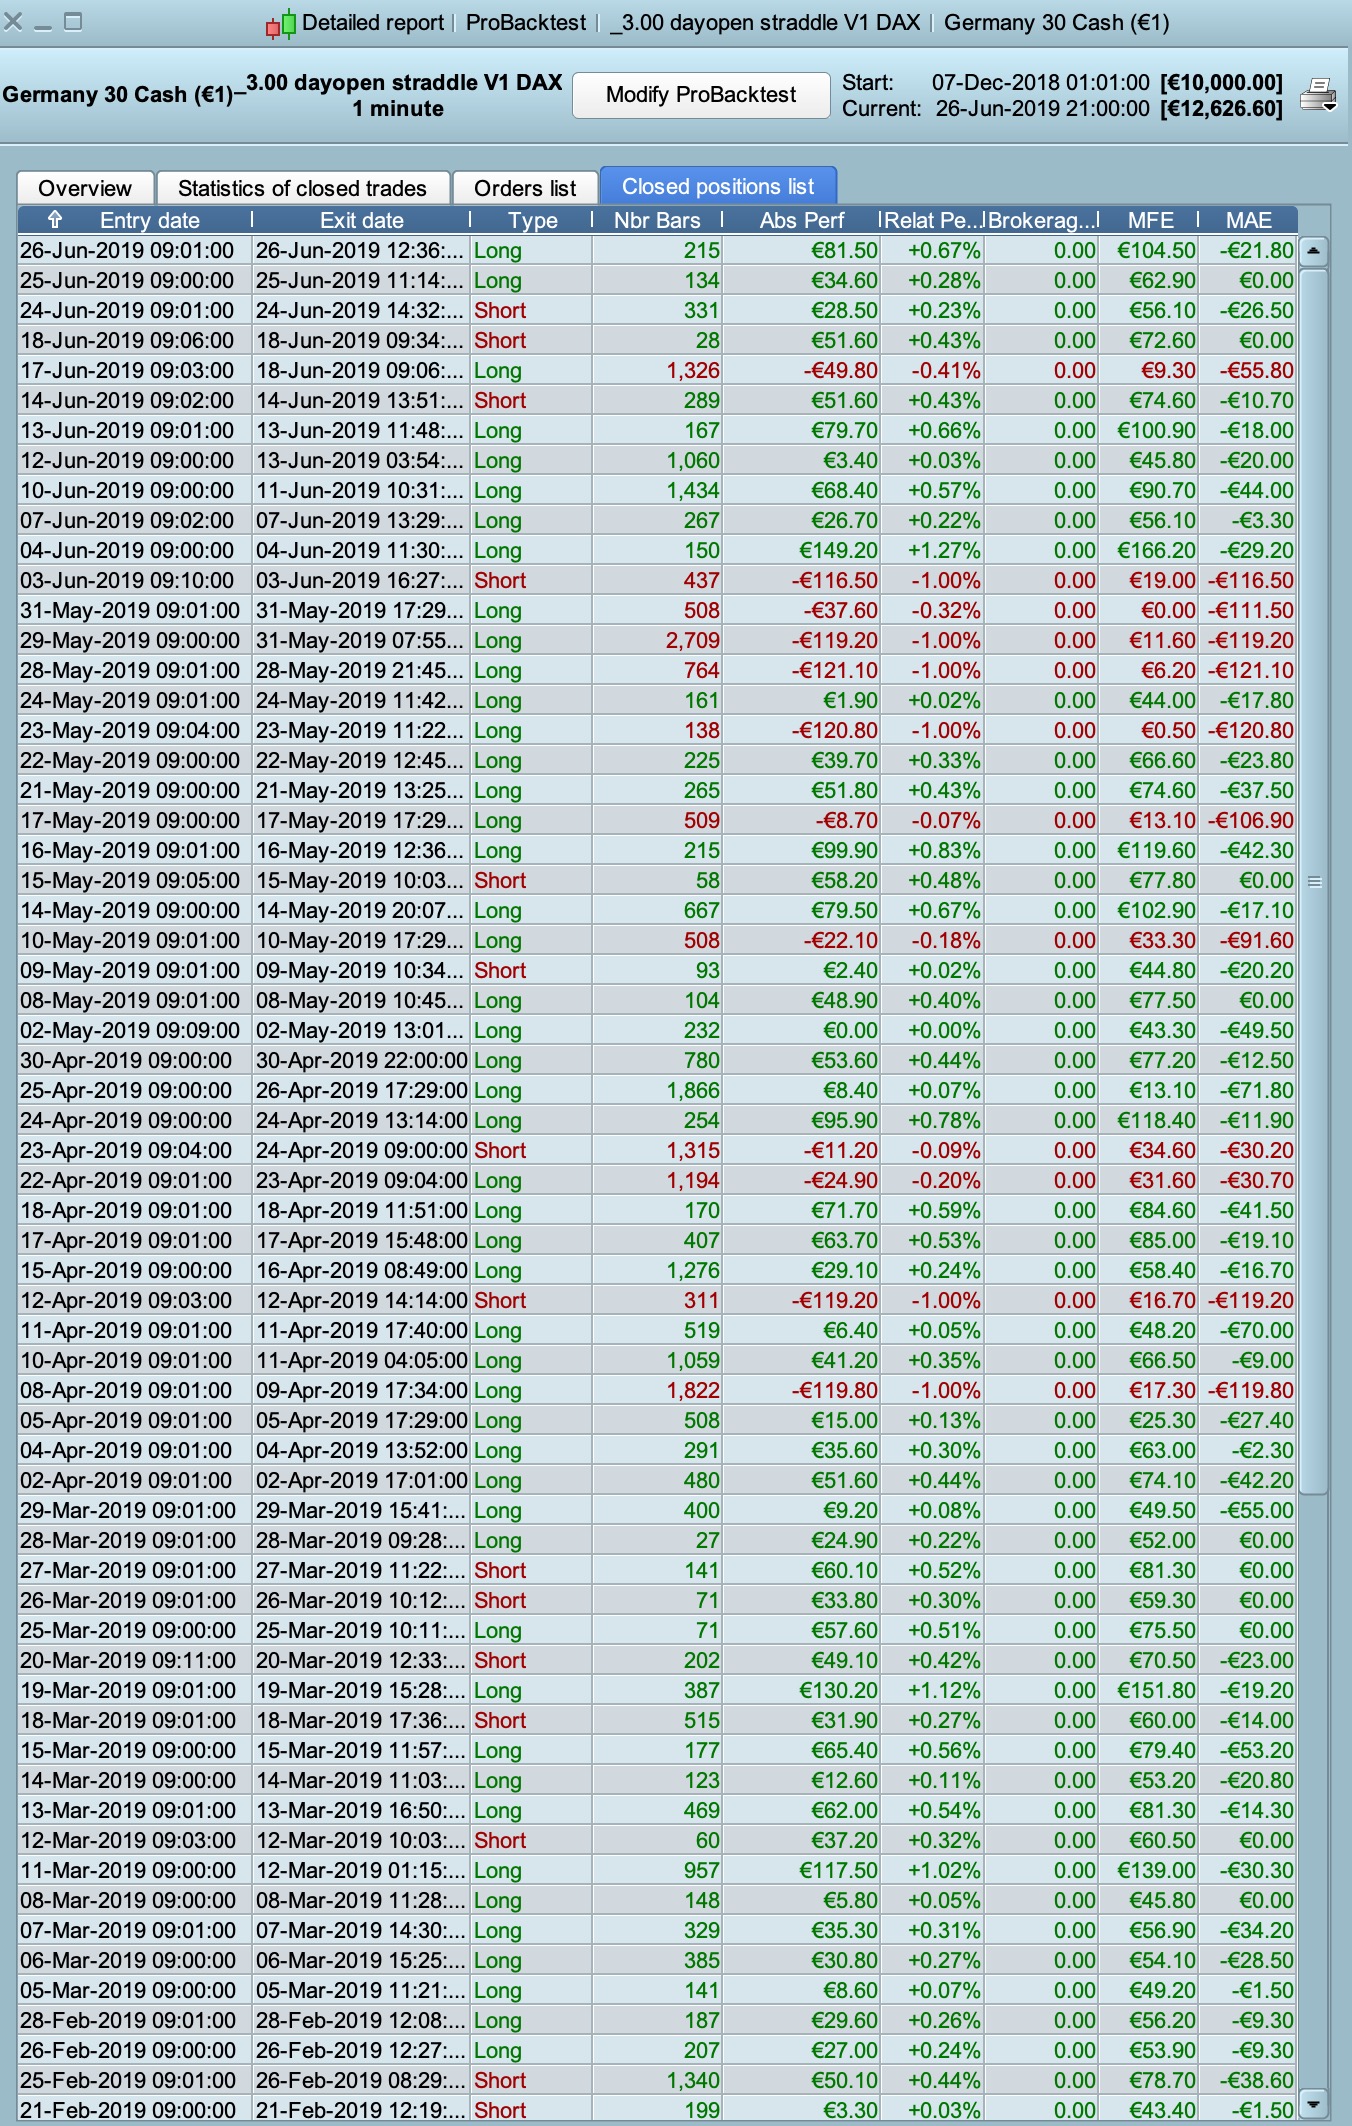
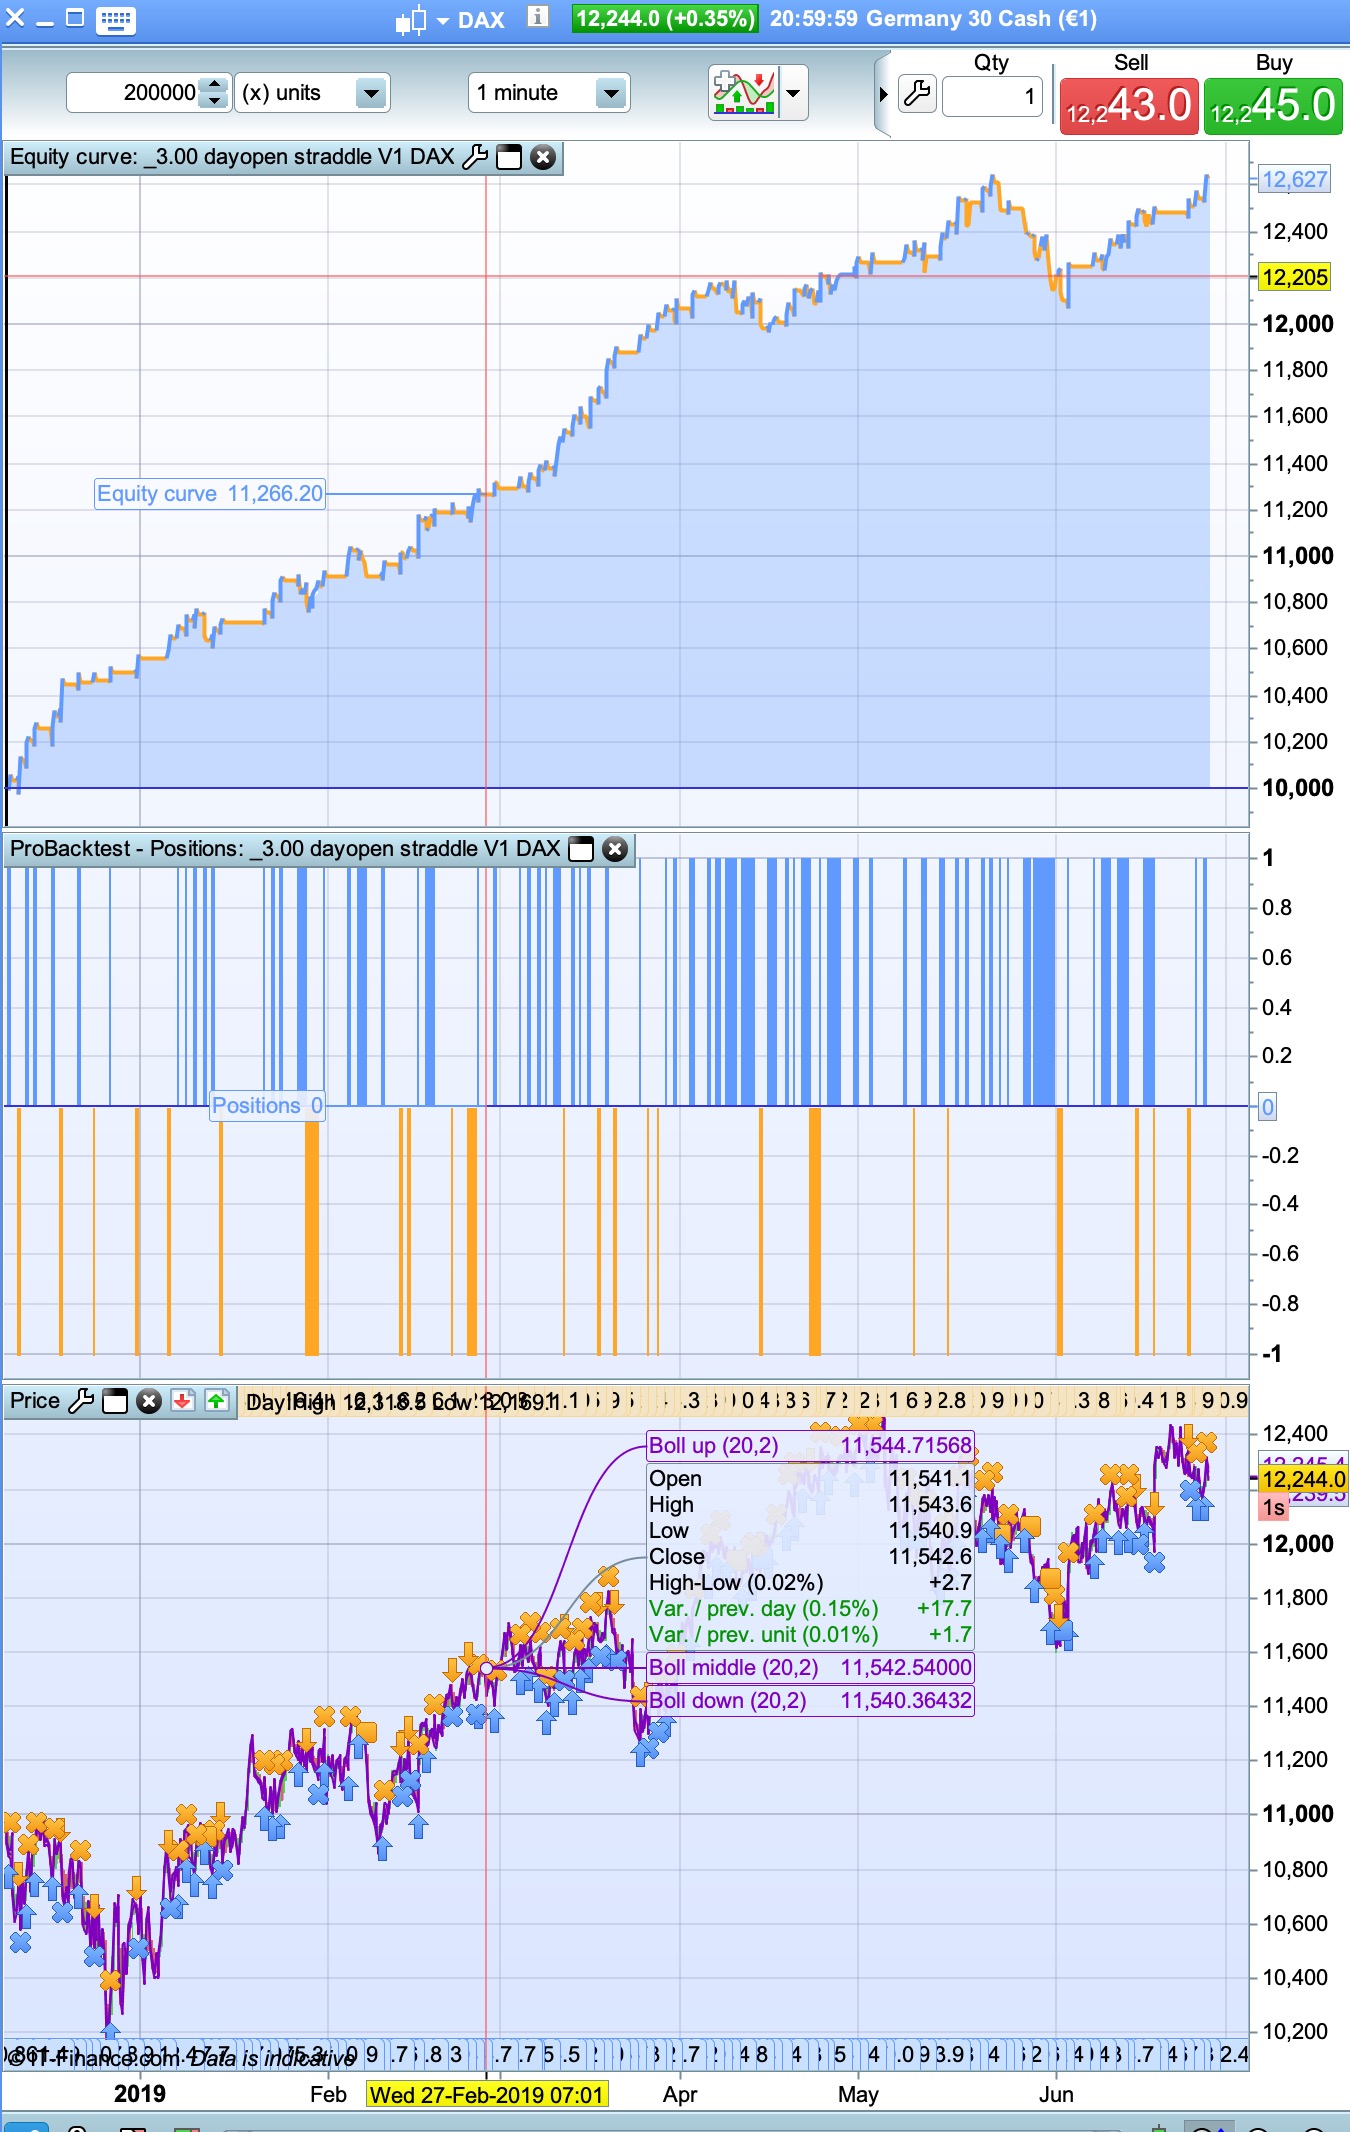
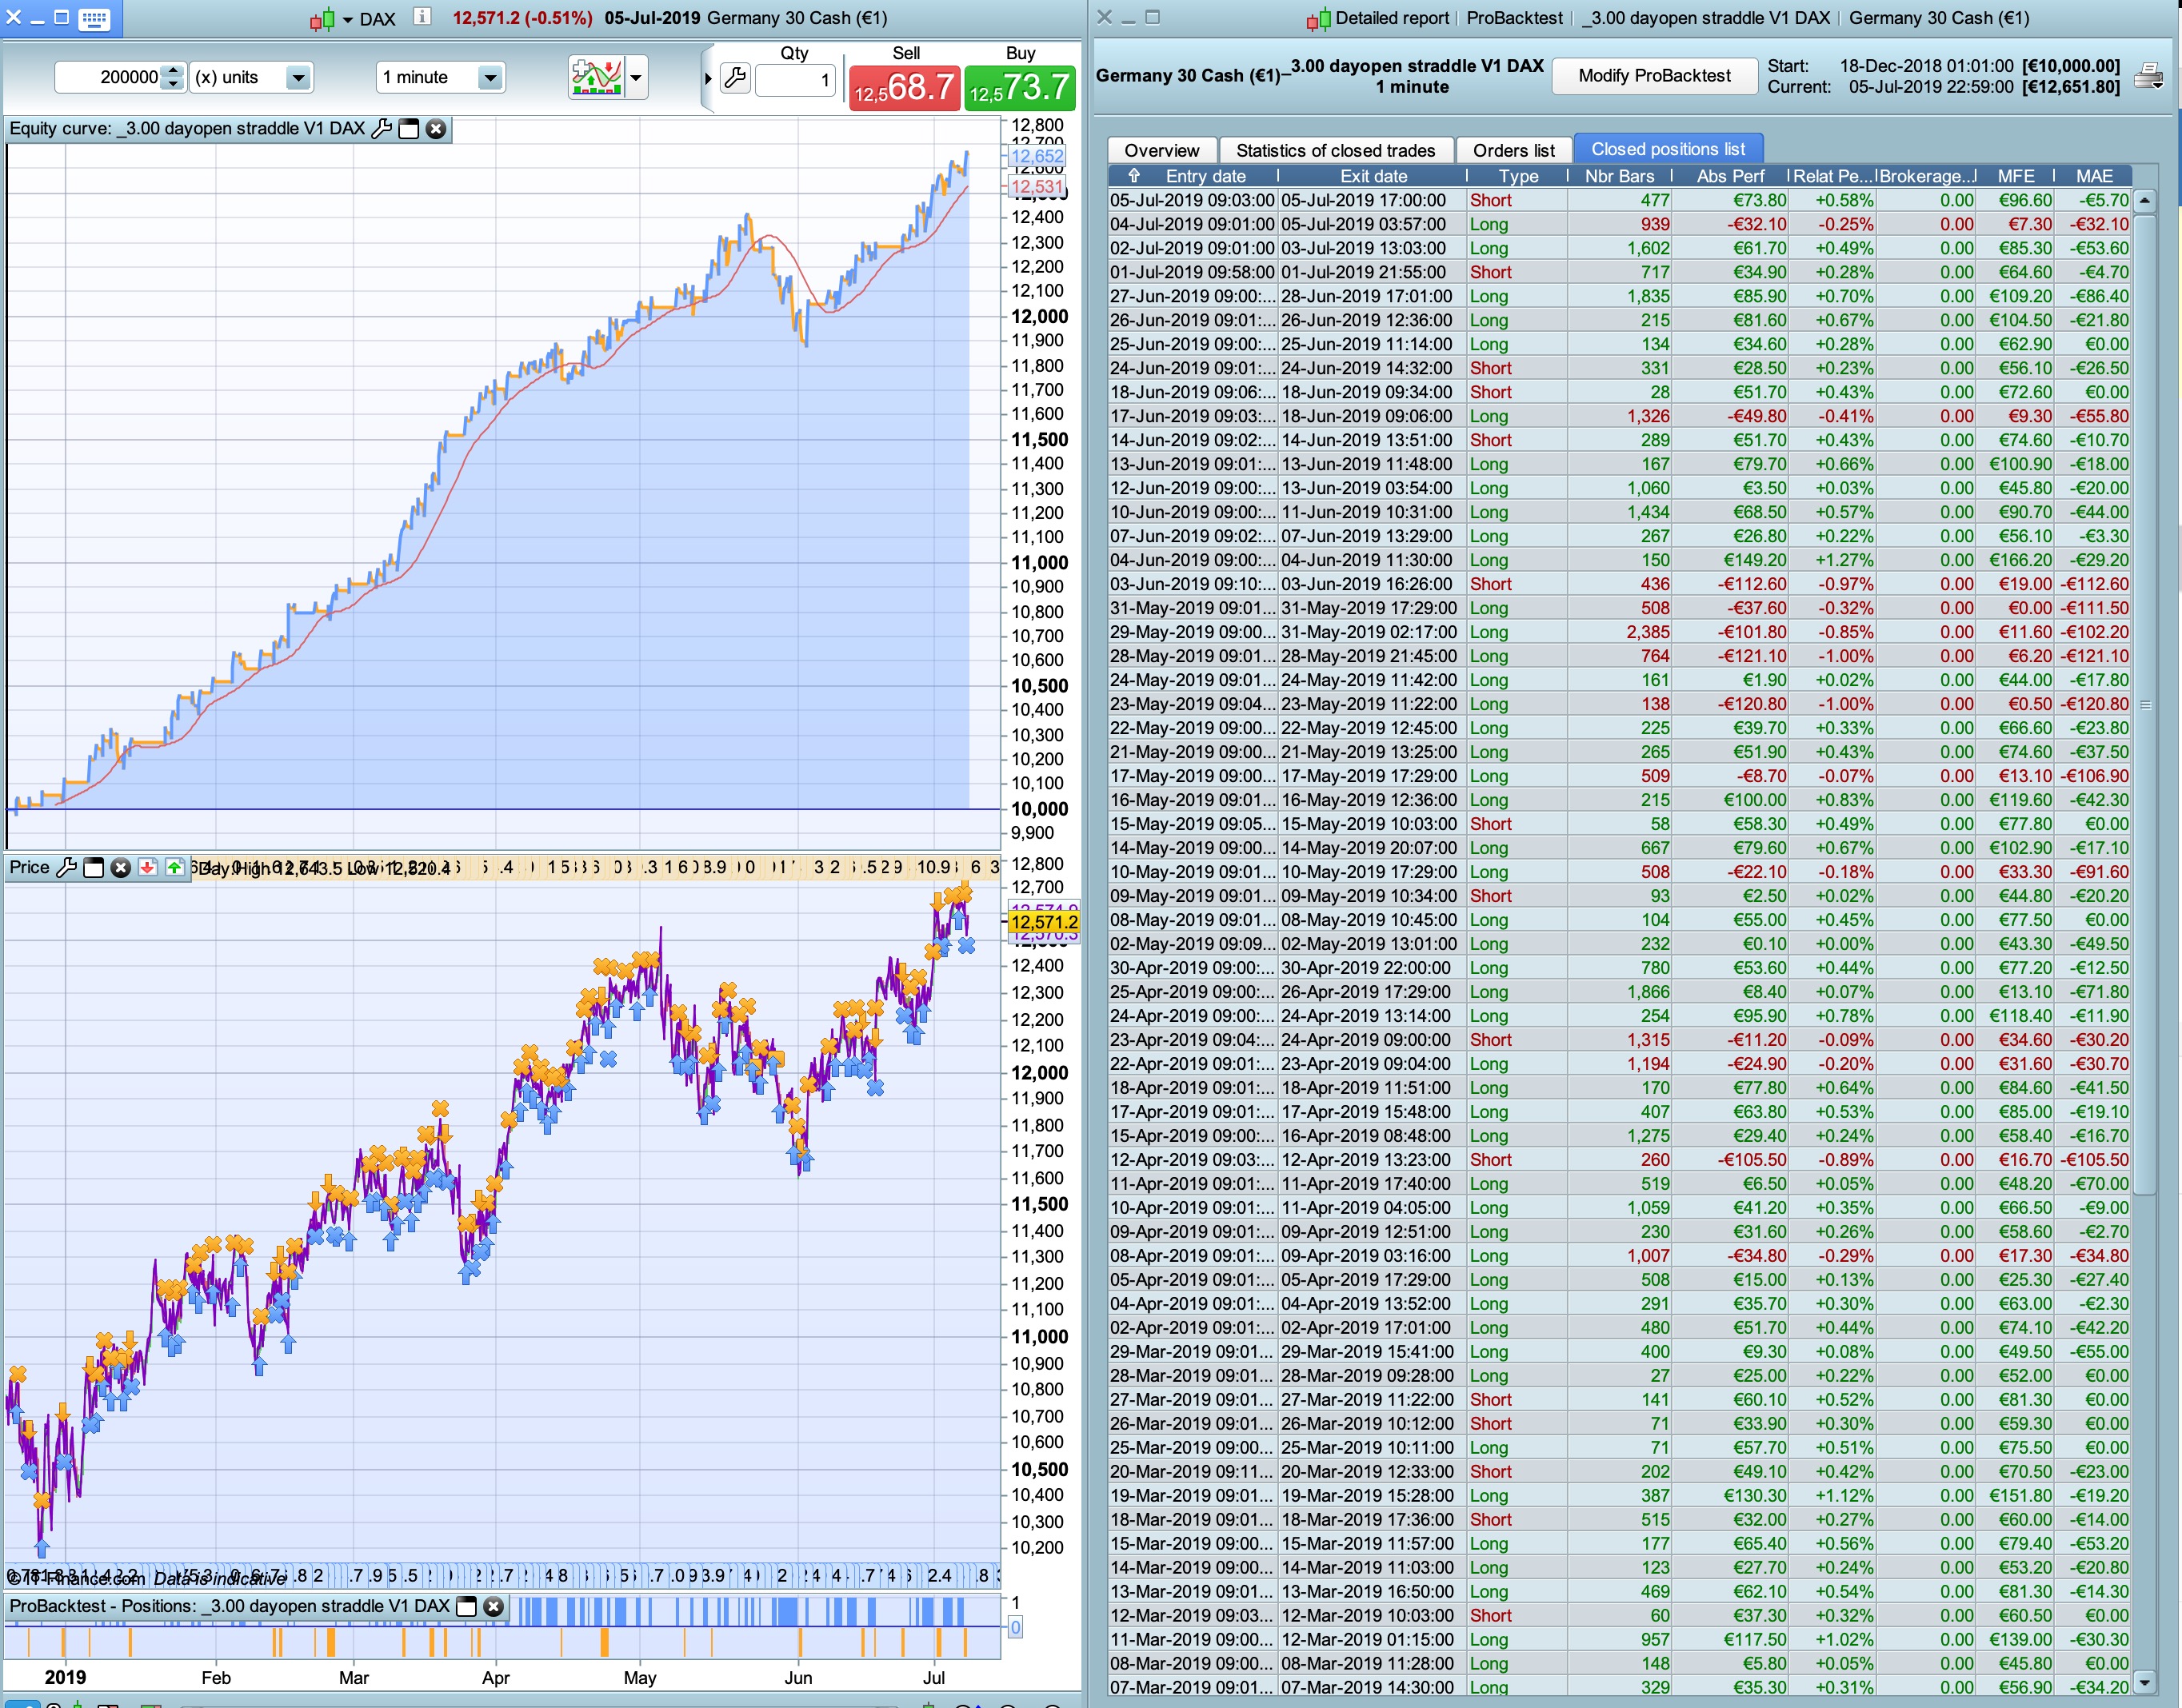
See equity-curve & detailed rapport to compare (new= on the right with other exit strategy and no trailing stop)
Unfortunatelly I can only see 100000 units in the backtests…
Can anyone run the strategy with 200000 units for 1 min and 2 min to see the difference?
Thank you in advance!
Ok now I can see why I get better results on 2 min… The first half of your 200k units in 2 min is crap… So I guess in the long term (at least so far) it works better in 1 min.
Are you currently running it in other time other than 1 min?
Thank you!!!
PaulParticipant
Master
Only focus is 1 minute. As you saw, it doesn’t work in a downtrend with more data with 2 or 3 minutes. So that’s makes the 1 minute a bit questionable in the longer run.
PaulParticipant
Master
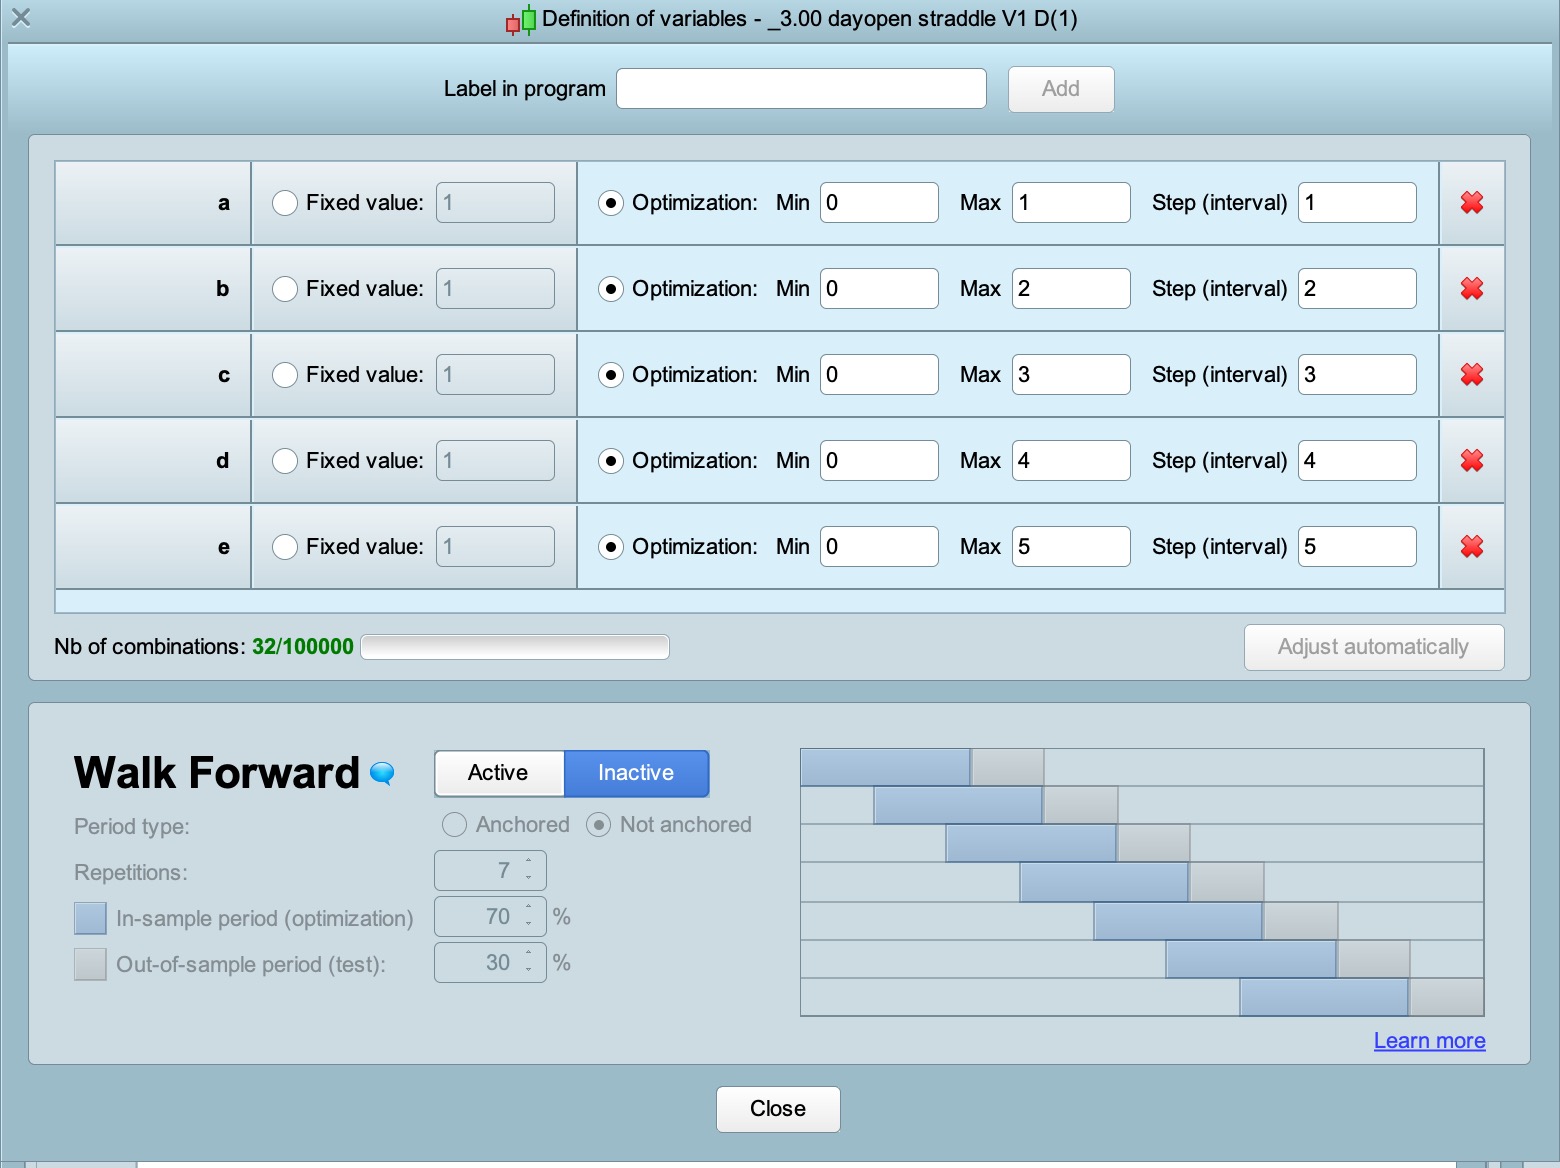
a bit of info about days optimising. Maybe someone find it useful.
Set workday to 1 in top of the code.
if workday then
if dayofweek = 0 then    // 0 to trade; 1 to exclude monday
weekday = 0
elsif dayofweek = 0 then // 0 to trade; 2 to exclude tuesday
weekday = 0
elsif dayofweek = 0 then // 0 to trade; 3 to exclude wednesday
weekday = 0
elsif dayofweek = 0 then // 0 to trade; 4 to exclude thursday
weekday = 0
elsif dayofweek = 0 then // 0 to trade; 5 to exclude friday
weekday = 0
else
weekday = 1
endif
endif
change that to below
if workday then
if dayofweek = a then    // 0 to trade; 1 to exclude monday
weekday = 0
elsif dayofweek = b then // 0 to trade; 2 to exclude tuesday
weekday = 0
elsif dayofweek = c then // 0 to trade; 3 to exclude wednesday
weekday = 0
elsif dayofweek = d then // 0 to trade; 4 to exclude thursday
weekday = 0
elsif dayofweek = e then // 0 to trade; 5 to exclude friday
weekday = 0
else
weekday = 1
endif
endif
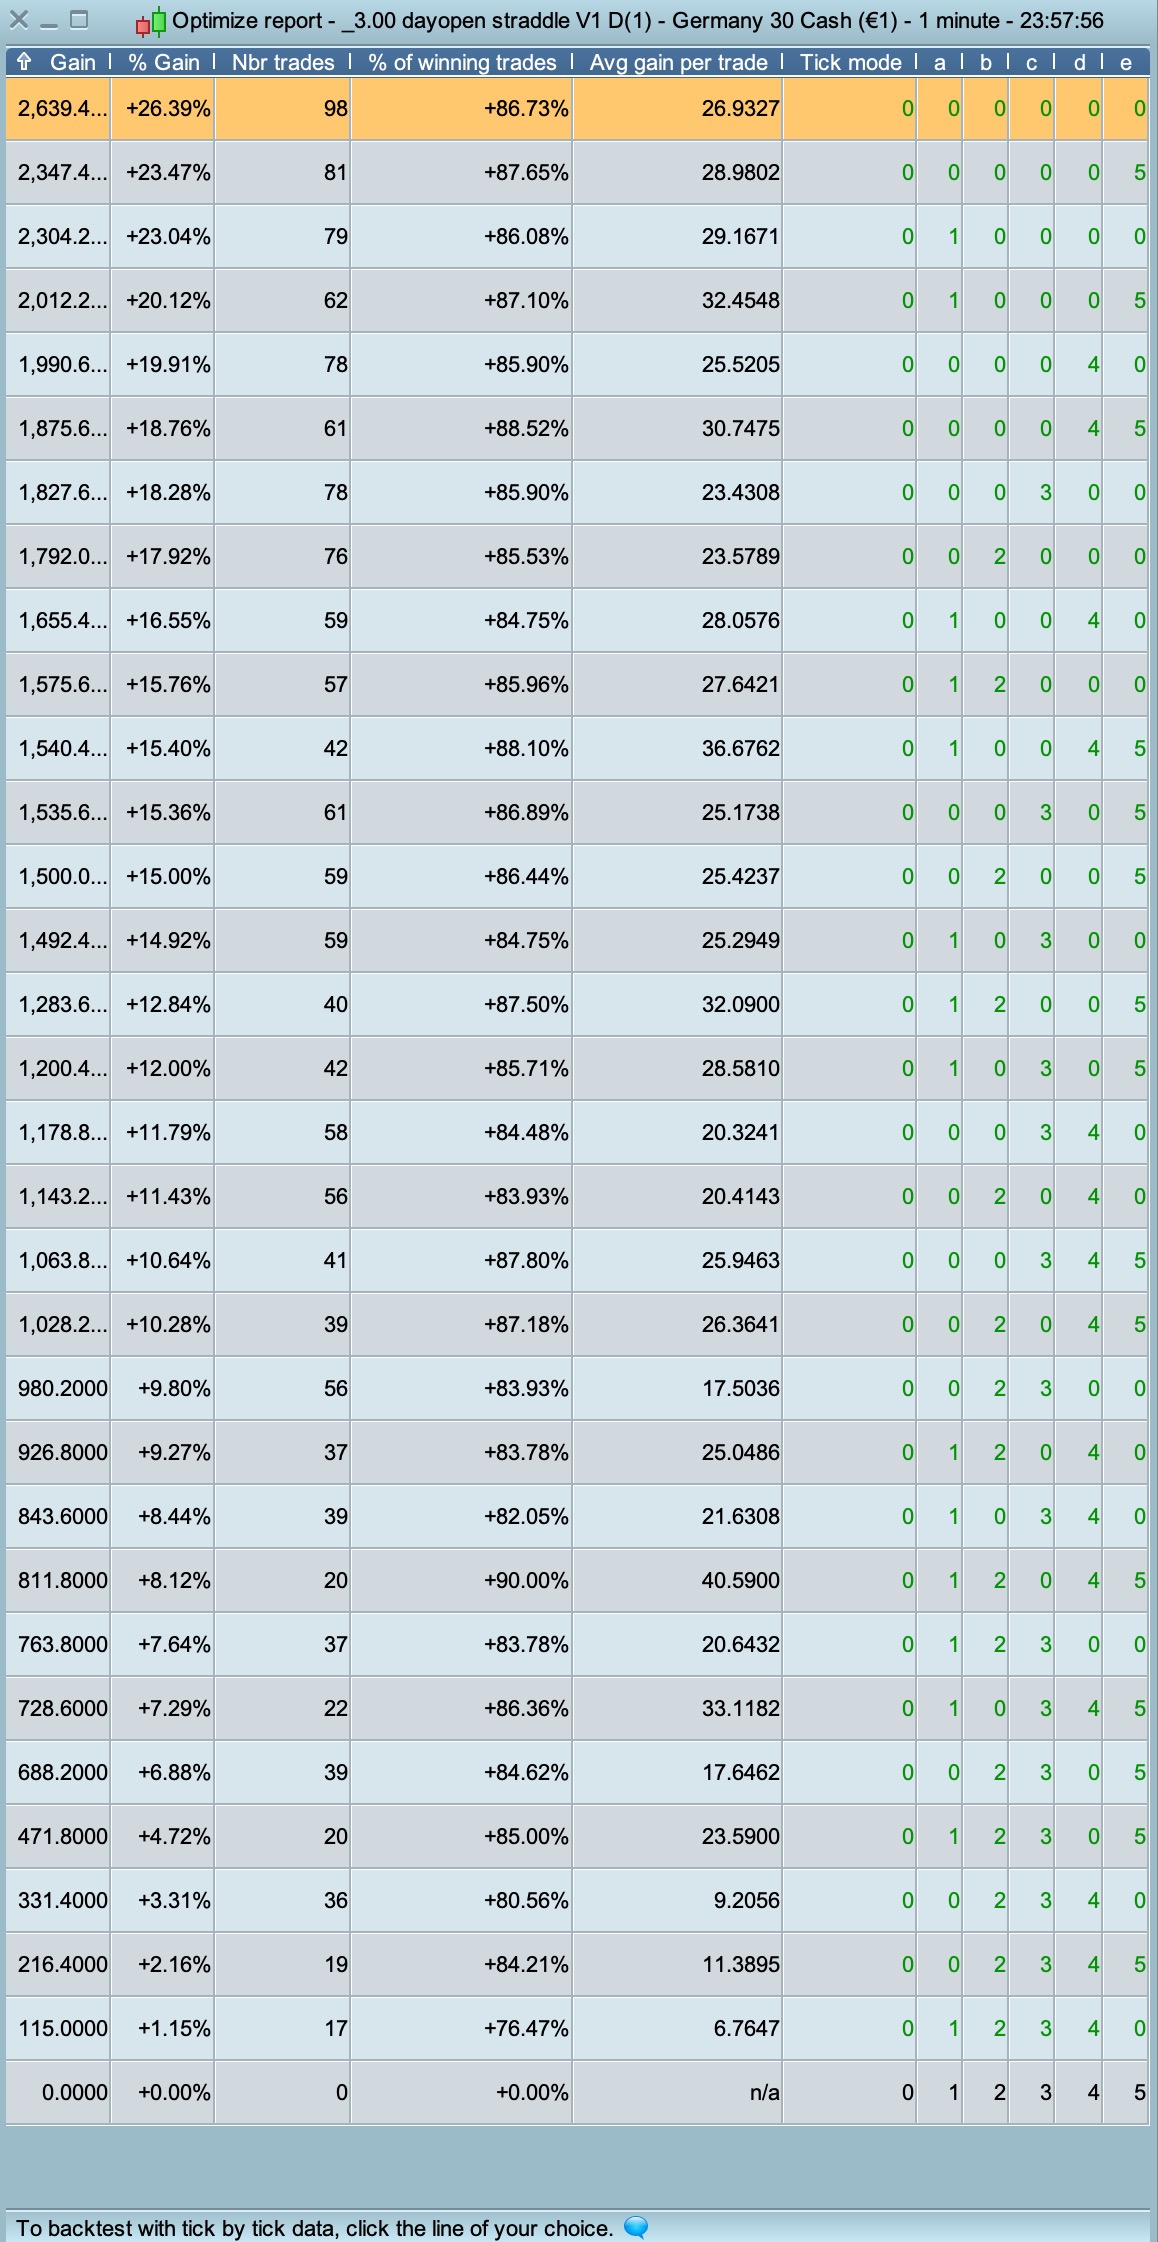
then optimise as in pic attached. (32 combinations)
if kolom a to e has a number higher then 0, all days are excluded en the gain =0 & trades=0
if kolom a to e are all 0 and on top when sorted by gain then the highest payout is when all days are traded.
- Wednesday is the best day to trade (winratio 90% & €40,59 avg/gain)
- Friday is the worst day (winratio 75,47% & €6,76 avg/gain), followed by monday
Not meant to over-optimising, but nice to understand if there are potential weak days where the risk is higher & gain lower.
Easy to use in every strategy.
Above code added to here Snippet Link Library
Thank you for the new addition. It is true that when operating dax I realised that Mondays and Fridays were normally the worst days, so it is good to add this new feature to the system.
I have another question that I would like to see how it works in the different systems. What I’d like to do is close a operation when the profit gets down a certain %. How could I code that?
Thank you so much as always for your incredible work!
Only focus is 1 minute. As you saw, it doesn’t work in a downtrend with more data with 2 or 3 minutes. So that’s makes the 1 minute a bit questionable in the longer run.
Same thing, focus on ut1 and ony on dax…
PaulParticipant
Master
the uptrend continues
on 4 of july markets in US where closed and resulted in a flat market on the dax. Trading would’ve resulted in a small loss.
same for 18 feb, presidents day
At the moment it is performing better than expected but for how long
Hi Paul,
I’m running it in live. I’ve have some errors because a short and a long order are opened and closed on the same time (like on last friday). No way to benefit from the last gain 🙁 . How could we fix it? Thanks