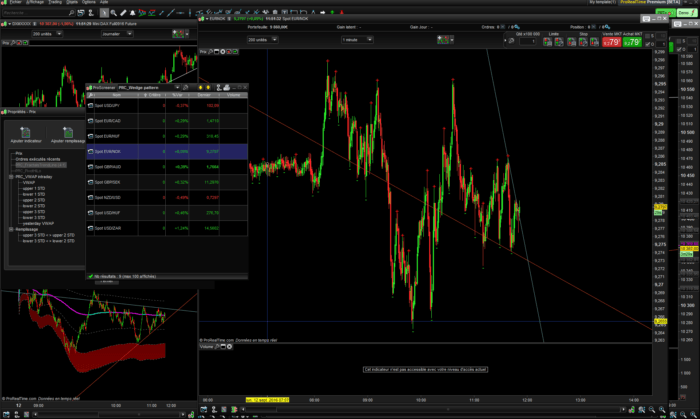
This screener can detect wedge patterns : rising, falling and symmetrical ones. The wedge is drawn with the last fractals detected on charts (lookback = 10 periods in the past).
The rising wedge is a bearish reversal pattern formed by two converging upward slants. To confirm a rising wedge, there must have oscillation between the two lines. Each line must be touched at least twice for validation.
This pattern marks the shortness of buyers. This one is characterized by a progressive reduction of the amplitude of the waves. The lowest reaches during the first correction on the resistance of the wedge will form the support. A second wave of increase will then occur, but with lower amplitude, which make appear the weakness of buyers. A second wave is formed thereafter but prices will increase less and less at the contact with the support. Volumes are then at their lowest and gradually decrease as the waves. The movement then has almost no buying power which indicates the willingness of a bearish reversal.
The target price is given by the lowest point that resulted in the formation of the wedge.
The falling wedge is a bullish reversal pattern formed by two converging downward slants. To confirm a falling wedge, there must have oscillation between the two lines. Each line must be touched at least twice for validation.
This pattern marks the shortness of sellers. This one is characterized by a progressive reduction of the amplitude of the waves. The highest reaches during the first correction on the support of the wedge will form the resistance. A second wave of decrease will then occur, but with lower amplitude, which make appear the weakness of sellers. A second wave is formed thereafter but prices will decrease less and less at the contact with the resistance. Volumes are then at their lowest and gradually decrease as the waves. The movement then has almost no selling power which indicates the willingness of a bullish reversal.
The target price is given by the highest point that resulted in the formation of the wedge.
(explanation from : http://www.forex-tribe.com/)
|
1 2 3 4 5 6 7 8 9 10 11 12 13 14 15 16 17 18 19 20 21 22 23 24 25 26 27 28 29 30 31 32 33 34 35 36 37 38 39 |
//PRC_Wedge pattern | screener //12.09.2016 //Nicolas @ www.prorealcode.com //Sharing ProRealTime knowledge //fractals cp = 10 //lookback if high[cp] >= highest[(cp)*2+1](high) then LLH = 1 else LLH = 0 endif if low[cp] <= lowest[(cp)*2+1](low) then LLL = -1 else LLL = 0 endif if LLH = 1 then a = b[1] abar = bbar[1] b = high[cp] bbar = barindex[cp] endif if LLL = -1 then c = d[1] cbar = dbar[1] d = low[cp] dbar = barindex[cp] endif c1 = a<b and c<d and abs(abar-bbar)>abs(cbar-dbar) and abs(a-b)<abs(c-d) c2 = a>b and c<d c3 = a>b and c>d and abs(abar-bbar)<abs(cbar-dbar) and abs(a-b)>abs(c-d) SCREENER [c1 or c2 or c3] |
Share this
No information on this site is investment advice or a solicitation to buy or sell any financial instrument. Past performance is not indicative of future results. Trading may expose you to risk of loss greater than your deposits and is only suitable for experienced investors who have sufficient financial means to bear such risk.
ProRealTime ITF files and other attachments :
Find other exclusive trading pro-tools on ![]()
PRC is also on YouTube, subscribe to our channel for exclusive content and tutorials


Hi, am trying to use the same principle for monitoring CCI. Is it possible to use Highest with CCI so that it returns the highest value of the CCI over the previous x bars? Or to get the screener to return positive if the price has never crossed lower than the SMA over x bars?
salut!
Hi, everything’s possible 🙂 If your plan is to change a lot this screener, you’d better ask your questions on forum instead.
Hi Nicolas,
Thanks for the good work. I’ve been reading O’Neil’s book and his thing with the Cup & Handle pattern. Could your here above wedge screener be further developed to screen the markets for Cup & Handle patterns. Would you by any chance have already done it, and, if not, would you have any advice on how to do that?
Thanks again
Peter
Cup and handle pattern are way different from this basic triangle pattern! Graphical patterns are difficult to retrieve with code while human eyes can recognize them easily. If you find any documented code about how to find cup patterns, I can have a look for sure. Please add a request on forums if you have found anything that could help me recode it.
OK thanks a lot. I will do that
P
Hi Nicolas,
I’ not the author of the request. but I’m interresting too. I find this article about cup & handle describing the pattern. It is possible to code it in PRT?
Thanks
Louis
Hi Nicolas
Can you detail what c1, c2 and c3 represent? Are they bullish (so falling wedge), triangle, and bearish, (rising wedge)?
Thanks
Copperwave
I don’t remember, but you can test yourself by deleting 2 of the these 3 conditions to see what kind of wedge is detected 🙂
Bonjour Nicolas,
Est-il possible d’avoir les lignes qui se dessinent directement sur le graphe plutôt que sous forme de screener et uniquement les deux dernières lignes (afin de ne pas surcharger le graphe)?
Merci d’avance,
Phil4910
Il y a un indicateur sur ce principe dans ce sujet du forum (traçage des trend lines) : https://www.prorealcode.com/topic/trendline-une-approche-du-trading/
Merci Nicolas.
Je l’avais vu mais je ne m’en sors pas : les trendlines ne se placent pas où je le désire. Plutôt qu’un long discours, je te fais parvenir une image dans un nouveau topic.
Phil4910
Bonjour ,
Pourriez-vous expliciter l’algorithme de ce programme , ou bien y ajouter des commentaires , afin de permettre son adaptation à une stratégie ?
Par avance , merci.
Bonjour à tous , bonjour Nicolas
Est-il possible d’avoir trois screeners qui sache différencier les triangles :
1- ascendants
2- symetriques
3- descendants
merci pour ton aide
Je ne comprends pas, c’est bien le rôle de celui-ci
EDIT: identifying pattern number in the ProScreener window:
https://www.prorealcode.com/topic/wefge-pattern-screener/#post-79216
Nicolas ,
Could you communicate to us the indicator you have used to draw patterns ,
and trendlines in your initial illustration graph of the “Wedge Pattern screener” ?
The site “http://www.forex-tribe.com ” no more exist –
Do you know an alternative ressource that give some explainations of the principle used for “fractals” applied to pattern detection ?
Description of falling/rising wedges: https://www.centralcharts.com/en/gm/1-learn/7-technical-analysis/27-chart-patterns/502-rising-wedge
Fractals is just a way to identify tops and bottoms in order to plot the patterns correctly, you could also use zigzag or any other custom code that find peaks and troughs!