

Screener for detecting hammers in a downtrend
July 9, 2020, 10:22 AM
Screeners
1 Comment
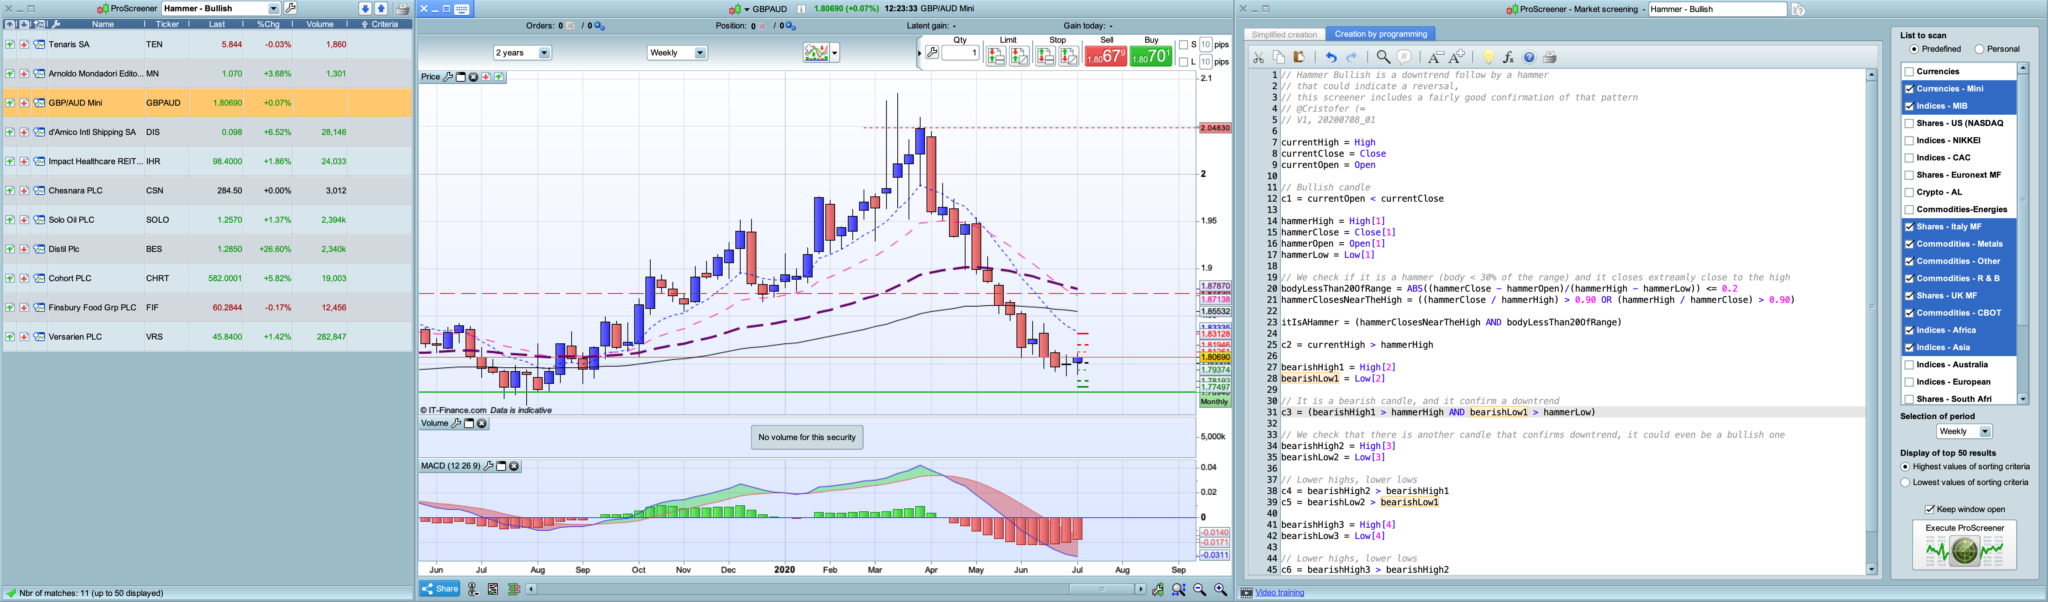
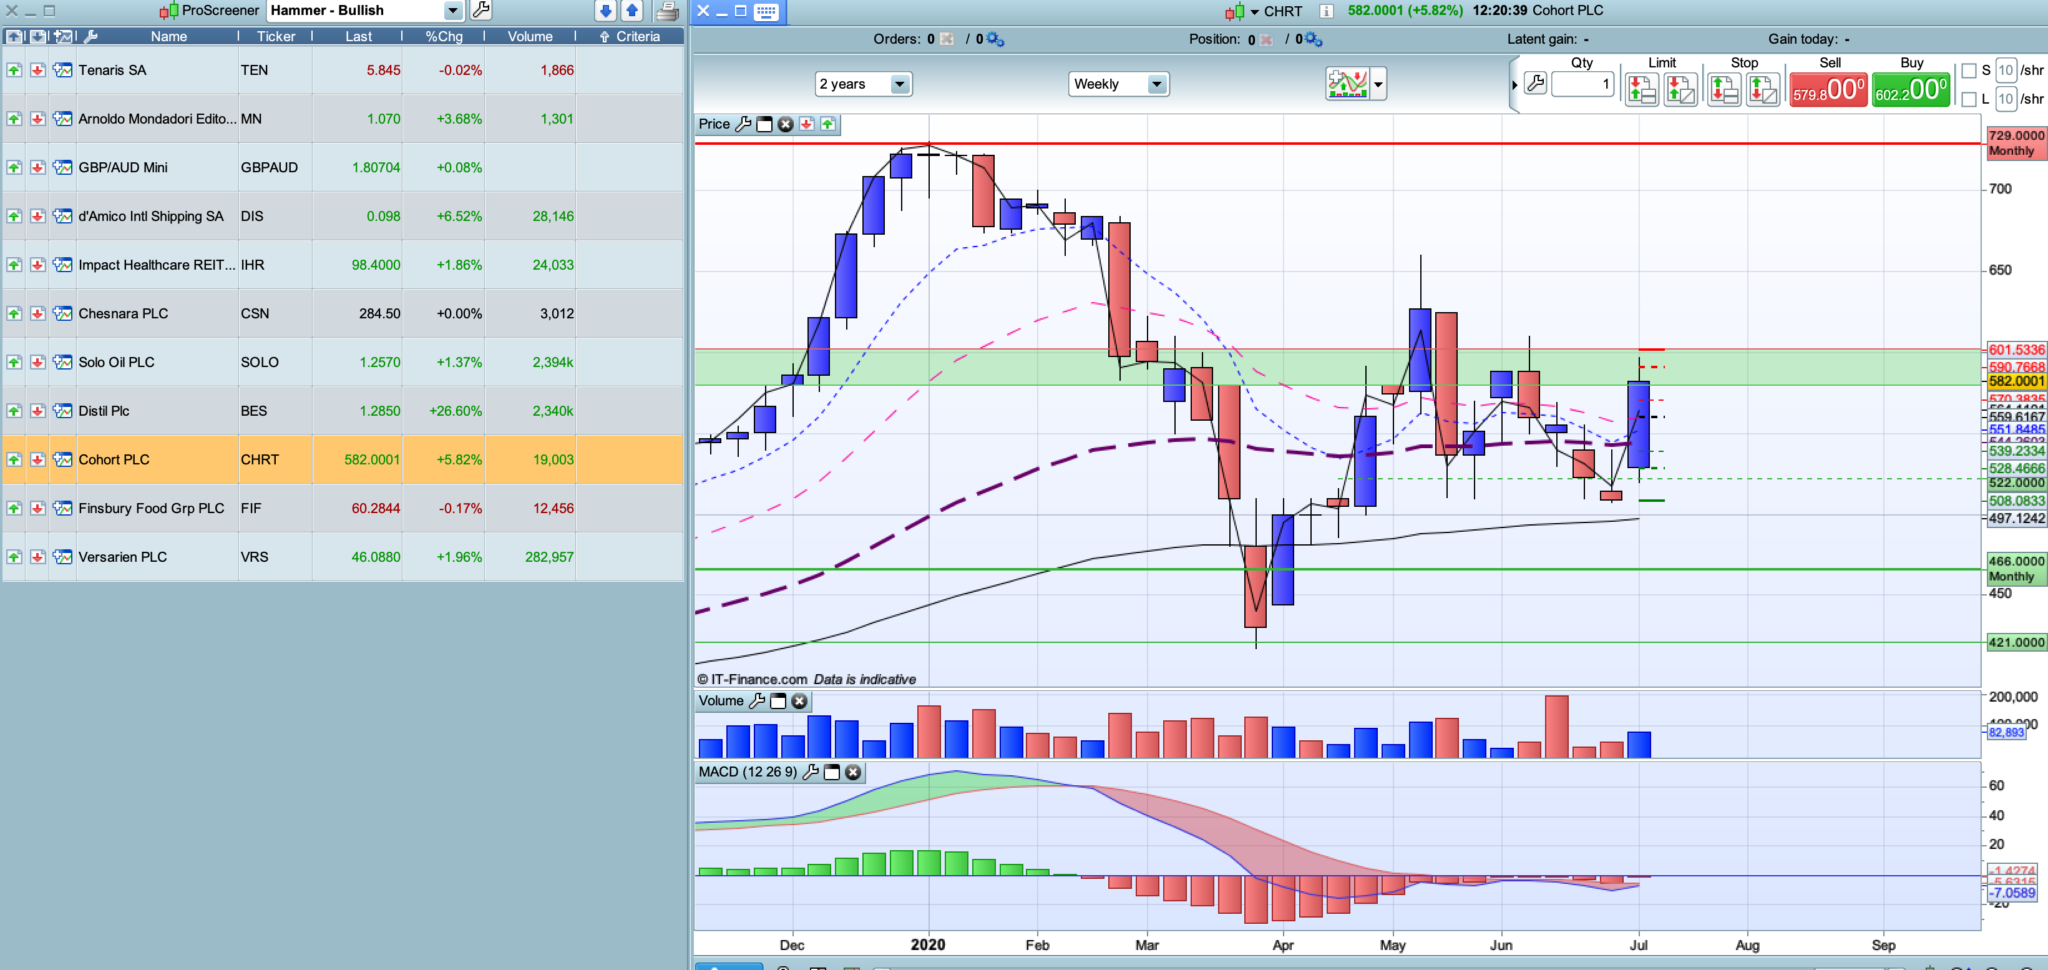
This follows the simple logic that during a downtrend, when we see a hammer follows by a bullish candle, then it could be a reversal. This screener includes the first check, for the first bullish candle after the hammer. It only checks 3 downtrend candles, you could add more if you want an even stronger sign of downtrend, however you can easily see the trend when opening the charts. Enjoy!
// Hammer Bullish is a downtrend follow by a hammer
// that could indicate a reversal,
// this screener includes a fairly good confirmation of that pattern
// @Cristofer (=
// V1, 20200708_01

currentHigh = High
currentClose = Close
currentOpen = Open

// Bullish candle
c1 = currentOpen < currentClose

hammerHigh = High[1]
hammerClose = Close[1]
hammerOpen = Open[1]
hammerLow = Low[1]

// We check if it is a hammer (body < 30% of the range) and it closes extreamly close to the high
bodyLessThan20OfRange = ABS((hammerClose - hammerOpen)/(hammerHigh - hammerLow)) <= 0.2
hammerClosesNearTheHigh = ((hammerClose / hammerHigh) > 0.90 OR (hammerHigh / hammerClose) > 0.90)

itIsAHammer = (hammerClosesNearTheHigh AND bodyLessThan20OfRange)

c2 = currentHigh > hammerHigh

bearishHigh1 = High[2]
bearishLow1 = Low[2]

// It is a bearish candle, and it confirm a downtrend
c3 = (bearishHigh1 > hammerHigh AND bearishLow1 > hammerLow)

// We check that there is another candle that confirms downtrend, it could even be a bullish one
bearishHigh2 = High[3]
bearishLow2 = Low[3]

// Lower highs, lower lows
c4 = bearishHigh2 > bearishHigh1
c5 = bearishLow2 > bearishLow1

bearishHigh3 = High[4]
bearishLow3 = Low[4]

// Lower highs, lower lows
c6 = bearishHigh3 > bearishHigh2
c7 = bearishLow3 > bearishLow2

SCREENER[itIsAHammer AND c1 AND c2 AND c3 AND c4 AND c5 AND c6 AND c7]
Download
Filename:
Hammer-Bullish-downtrend.itf
Downloads:
451
Download
Filename:
Screenshot-2020-07-08-at-13.25.07.png
Downloads:
111
Download
Filename:
Screenshot-2020-07-08-at-13.23.34.png
Downloads:
196
Download
Filename:
screenshot-at-1593889284lp4c8.png
Downloads:
106
Average
I usually let my code do the talking, which explains why my bio is as empty as a newly created file. Bio to be initialized...
Author’s Profile
Loading...