

Price Action Toolkit Screener
Introduction
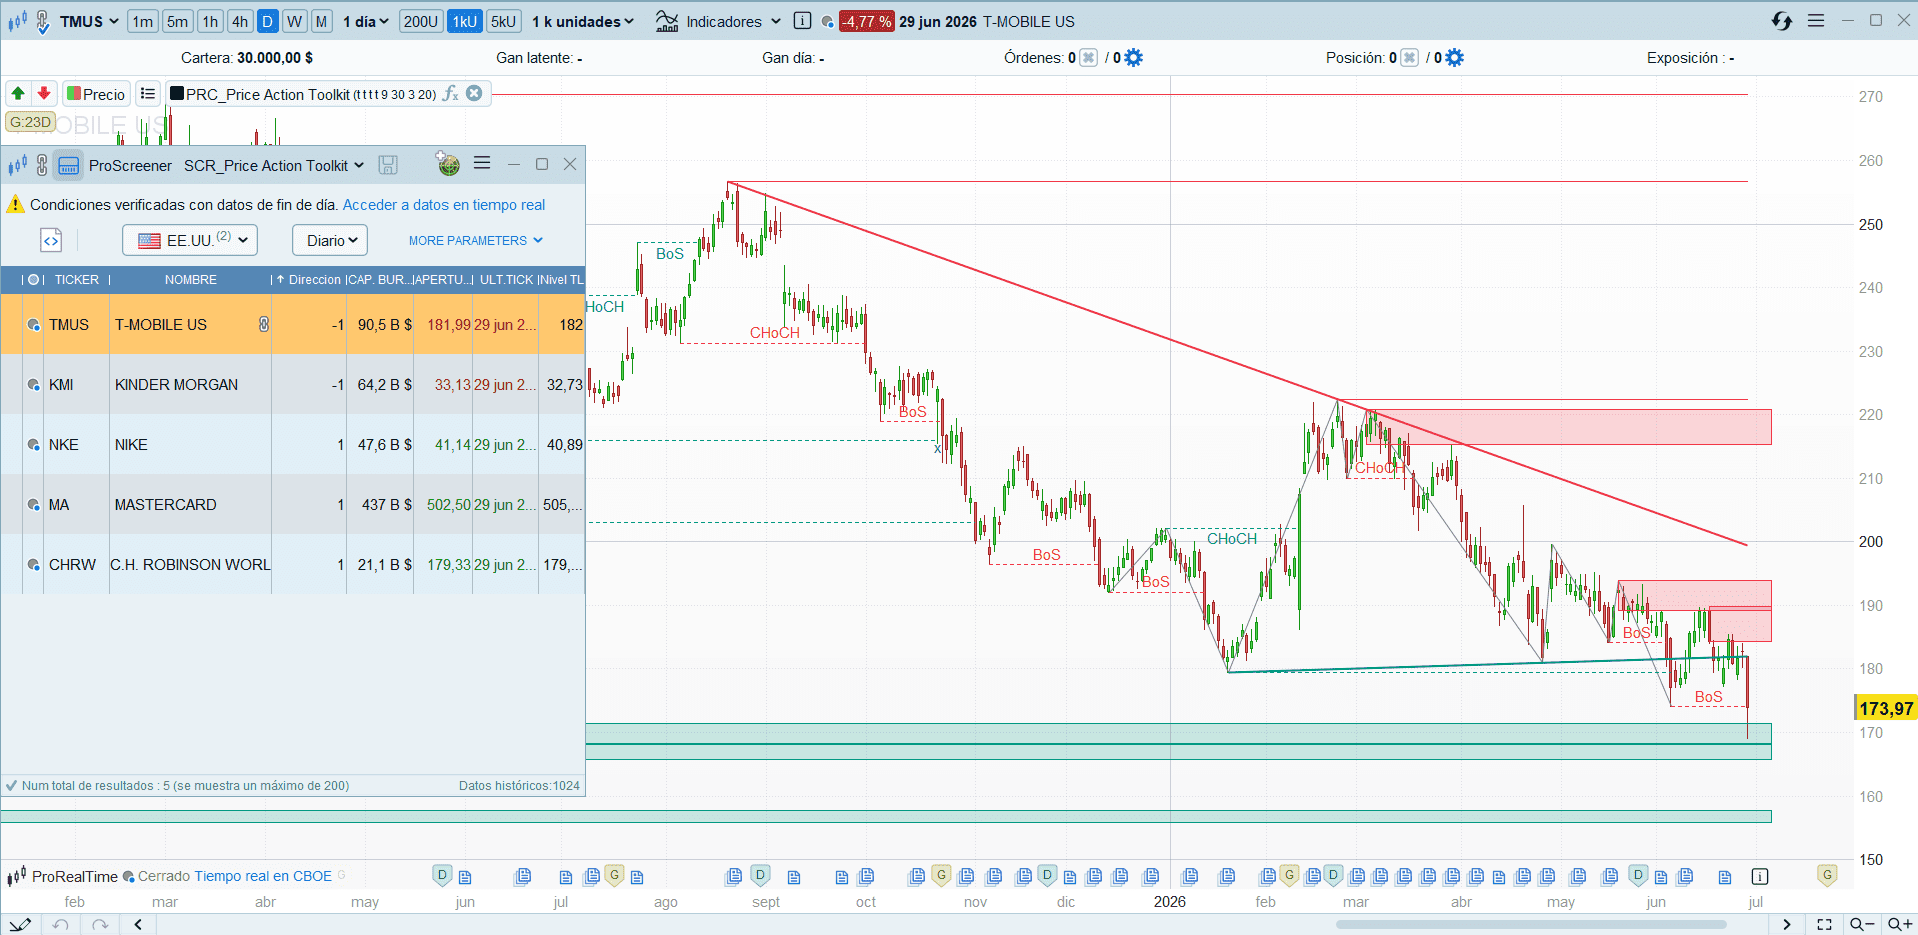
Drawing trend lines by hand does not scale, and neither does watching them. The Price Action Toolkit already draws two automatic trend lines on the chart (a descending resistance and an ascending support), but you still have to flip through hundreds of charts one by one to catch the moment price actually breaks one of them. This ProScreener does that for you: it rebuilds the same two trend lines the indicator draws and returns only the instruments whose latest closed candle has just broken one of them.
It is the natural companion to the indicator: that overlay draws the lines on a single chart; this screener filters the whole universe and brings back the names that just triggered.
The Two Trend Lines It Reconstructs
The Trend Lines module of the Price Action Toolkit draws two slope-filtered diagonals:
- Descending resistance: connects the last two pivot highs, and is only valid if its slope is negative (the highs are falling).
- Ascending support: connects the last two pivot lows, and is only valid if its slope is positive (the lows are rising).
Both use a centred pivot of half-window tlSens = 20 (a full window of 2·tlSens + 1 = 41 bars). The slope filter is what stops the line from being drawn through unrelated pivots, so the screener only ever reports a break of a line the indicator would genuinely show.
What the Screener Does
It re-implements the indicator’s // ── TREND LINES ── block without the drawing part, projects each line to the current and previous bar, and checks whether the close has crossed it. The two breaks with operational meaning are:
- Close crosses up through the descending resistance → bullish break (
Direccion = 1). - Close crosses down through the ascending support → bearish break (
Direccion = -1).
Output columns:
- Direccion:
1bullish break /-1bearish break. - Nivel TL: price of the broken line on the current bar (the level price just defeated).
How It Stays Faithful to the Indicator
Three design choices keep the screener’s signals lined up with the lines you see on the chart, and make it lighter than the usual trend-line scanner:
- Same pivot engine, no arrays. The indicator keeps only the two most recent pivots per side in scalar
oncevariables, promotingend → starton every new pivot (the classicvaluewhenshift). The screener reuses that exact pattern, so unlike the array-based trend-line screeners it does not accumulate vectors over the whole history. It is cheap to run on a large universe. - It does not repaint. Pivots are centred and confirmed (
high[tlSens] = highest[2·tlSens+1](high)and its mirror). A confirmed pivot lands the signal on a line that is already fixed, so it will not vanish on the next bar. The trade-off is the sametlSens-bar confirmation delay the indicator already has. - Native cross, no indexed user variables. The break is tested with
close/close[1]against the projected line, never by indexing a user variable with[n](something ProScreener does not resolve reliably). The point-slope projectionvalue = endVal + slope·(barindex − end)is evaluated for the current and previous bar so the cross is exact.
Code
//----------------------------------------------
//PRC_Price Action Toolkit - Trend Line Break (screener)
//version = 1
//29.06.2026
//Ivan Gonzalez @ www.prorealcode.com
//Sharing ProRealTime knowledge
//----------------------------------------------
// Replica las trend lines del indicador "Price Action Toolkit" (UAlgo)
// y filtra los valores cuya ultima vela ROMPE una de ellas:
//   - Resistencia bajista (2 pivots high, pendiente < 0) -> cruce al alza
//   - Soporte alcista     (2 pivots low,  pendiente > 0) -> cruce a la baja
// Sin DEFPARAM (no permitido en screeners).

tlSens = 20

//--- Pivots high/low centrados y confirmados (mismo metodo que el indicador) ---
once tlBearEnd = -1
once tlBearEndVal = 0
once tlBearStart = -1
once tlBearStartVal = 0
once tlBullEnd = -1
once tlBullEndVal = 0
once tlBullStart = -1
once tlBullStartVal = 0

IF barindex >= 2*tlSens THEN
   IF high[tlSens] = highest[2*tlSens+1](high) THEN
      tlBearStart = tlBearEnd
      tlBearStartVal = tlBearEndVal
      tlBearEnd = barindex - tlSens
      tlBearEndVal = high[tlSens]
   ENDIF
   IF low[tlSens] = lowest[2*tlSens+1](low) THEN
      tlBullStart = tlBullEnd
      tlBullStartVal = tlBullEndVal
      tlBullEnd = barindex - tlSens
      tlBullEndVal = low[tlSens]
   ENDIF
ENDIF

//--- Resistencia bajista proyectada (vela actual y anterior) ---
bearValid = 0
tlBearNow = 0
tlBearPrev = 0
IF tlBearStart > 0 AND tlBearEnd > tlBearStart THEN
   tlBearSlope = (tlBearEndVal - tlBearStartVal) / (tlBearEnd - tlBearStart)
   IF tlBearSlope < 0 THEN
      bearValid = 1
      tlBearNow  = tlBearEndVal + tlBearSlope * (barindex - tlBearEnd)
      tlBearPrev = tlBearEndVal + tlBearSlope * (barindex - 1 - tlBearEnd)
   ENDIF
ENDIF

//--- Soporte alcista proyectado (vela actual y anterior) ---
bullValid = 0
tlBullNow = 0
tlBullPrev = 0
IF tlBullStart > 0 AND tlBullEnd > tlBullStart THEN
   tlBullSlope = (tlBullEndVal - tlBullStartVal) / (tlBullEnd - tlBullStart)
   IF tlBullSlope > 0 THEN
      bullValid = 1
      tlBullNow  = tlBullEndVal + tlBullSlope * (barindex - tlBullEnd)
      tlBullPrev = tlBullEndVal + tlBullSlope * (barindex - 1 - tlBullEnd)
   ENDIF
ENDIF

//--- Cruces sobre la prolongacion de cada linea ---
crossUp   = bearValid AND close > tlBearNow AND close[1] <= tlBearPrev
crossDown = bullValid AND close < tlBullNow AND close[1] >= tlBullPrev

//--- Direccion (1 = ruptura alcista, -1 = ruptura bajista) y nivel roto ---
signal = 0
lvl = 0
IF crossUp THEN
   signal = 1
   lvl = tlBearNow
ELSIF crossDown THEN
   signal = -1
   lvl = tlBullNow
ENDIF

SCREENER[signal <> 0](signal AS "Direccion", lvl AS "Nivel TL")
