

Pivot Support/Resistance screener
January 6, 2020, 4:03 PM
Screeners
3 Comments
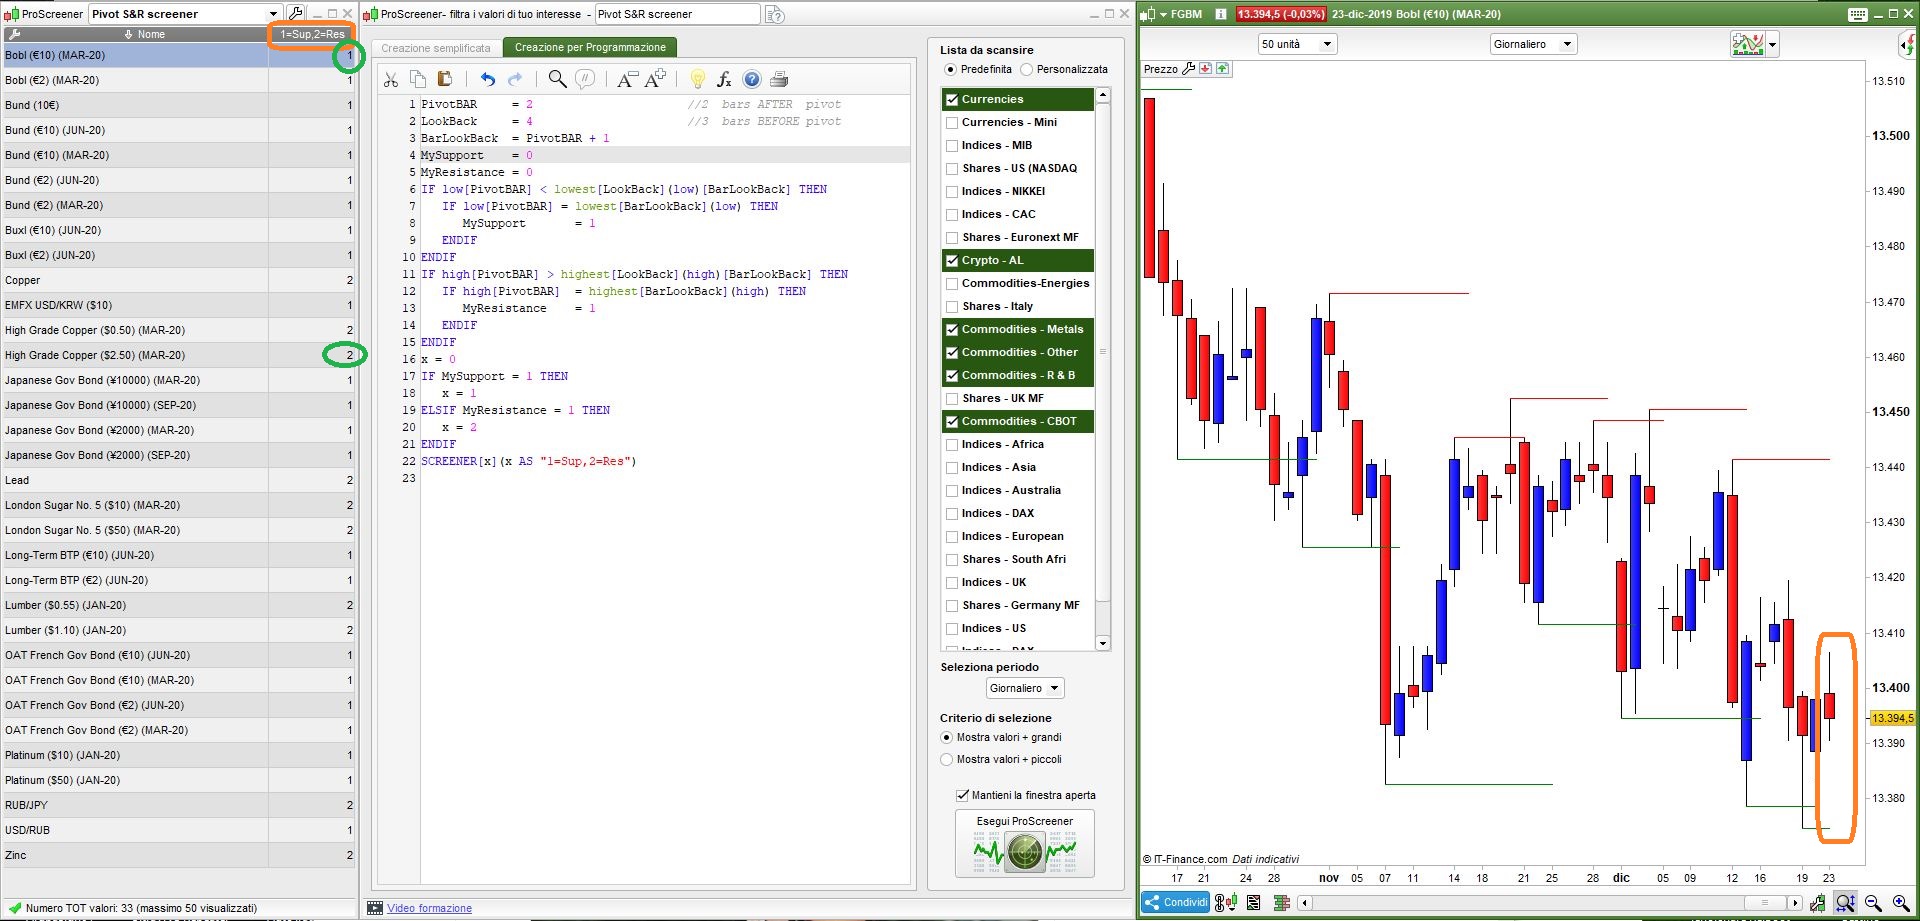
I made this screener out of the indicator https://www.prorealcode.com/prorealtime-indicators/pivot-support-resistance-zones/ following a request on the forum.
Price levels of support/resistance are calculated with high/low pivot points:
At a price bar preceded by 4 higher lows and followed by 2 higher lows, a new support line is found. The same for a resistance line at a price bar with 4 lower Highs before and followed by 2 lower Highs.
// Pivot S&R screener
//
// Indicator at:   https://www.prorealcode.com/prorealtime-indicators/pivot-support-resistance-zones/
//
PivotBAR     = 2                      //2  bars AFTER  pivot
LookBack     = 4                      //4  bars BEFORE pivot
BarLookBack  = PivotBAR + 1
MySupport    = 0
MyResistance = 0
IF low[PivotBAR] < lowest[LookBack](low)[BarLookBack] THEN
   IF low[PivotBAR] = lowest[BarLookBack](low) THEN
      MySupport       = 1
   ENDIF
ENDIF
IF high[PivotBAR] > highest[LookBack](high)[BarLookBack] THEN
   IF high[PivotBAR]  = highest[BarLookBack](high) THEN
      MyResistance    = 1
   ENDIF
ENDIF
x = 0
IF MySupport = 1 THEN
   x = 1
ELSIF MyResistance = 1 THEN
   x = 2
ENDIF
SCREENER[x](x AS "1=Sup,2=Res")
Download
Filename:
Pivot-SR-screener.txt
Downloads:
142
Download
Filename:
Pivot-SR-screener.itf
Downloads:
398
Download
Filename:
Pivot-SR-screener.jpg
Downloads:
178

Master
Roberto
https://www.ots-onlinetradingsoftware.com
Author’s Profile
Loading...