




More from ProRealCode
ProRealCode - Trading & Coding with ProRealTime™
The ProRealTime™ community on the web! Officially sharing ProRealTime knowledge to Worldwide users since 2015!



Double low screener
August 30, 2017, 7:49 PM
Screeners
2 Comments
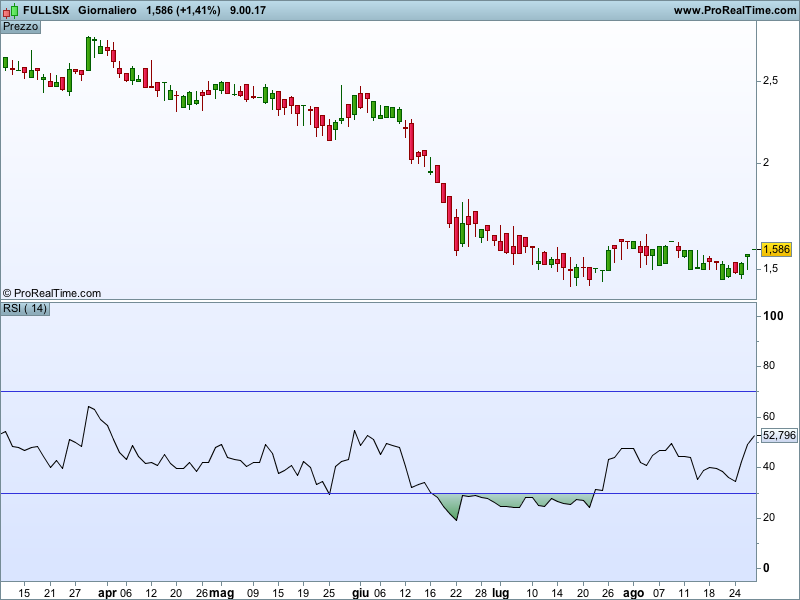
This simple screener helps to detect a double low’s on prices confirmed by a double low’s on RSI. It’s not spot on and you still need to filter the results one by one but I found it really helpful so far to narrow down the results. It can be modified to detect also double high’s. I like to see double low’s in a 30-day period but this period can be customised.
Blue skies.
// esempio di codice di screener
corto=lowest[5](low)>lowest[10](low[20])
rs=lowest[5](rsi[14](close))>lowest[10](rsi[14](close[20]))
rsold=lowest[10](rsi[14](close[20]))<30
z=lowest[5](rsi[14](close))-lowest[10](rsi[14](close[20]))

SCREENER [corto and rs and rsold] (z as "Delta RSI")
Download
Filename:
Double-low-screener.itf
Downloads:
263
Master
Developer by day, aspiring writer by night. Still compiling my bio... Error 404: presentation not found.
Author’s Profile
Similar code
Elliott Wave 3 ScreenerScreeners
Screener ABC PatternsScreeners
Order Block Retest ScreenerScreeners
Detecting Double Top and Bottom PatternsIndicators
Comments
You must be logged in to post a comment.

9 years ago
How do you modify this for a 7-10 day period? Thanks
Loading...
I am not sure I understand what you mean?