







Hyperfork Matrix: Andrews Pitchfork with action and reaction lines
Introduction
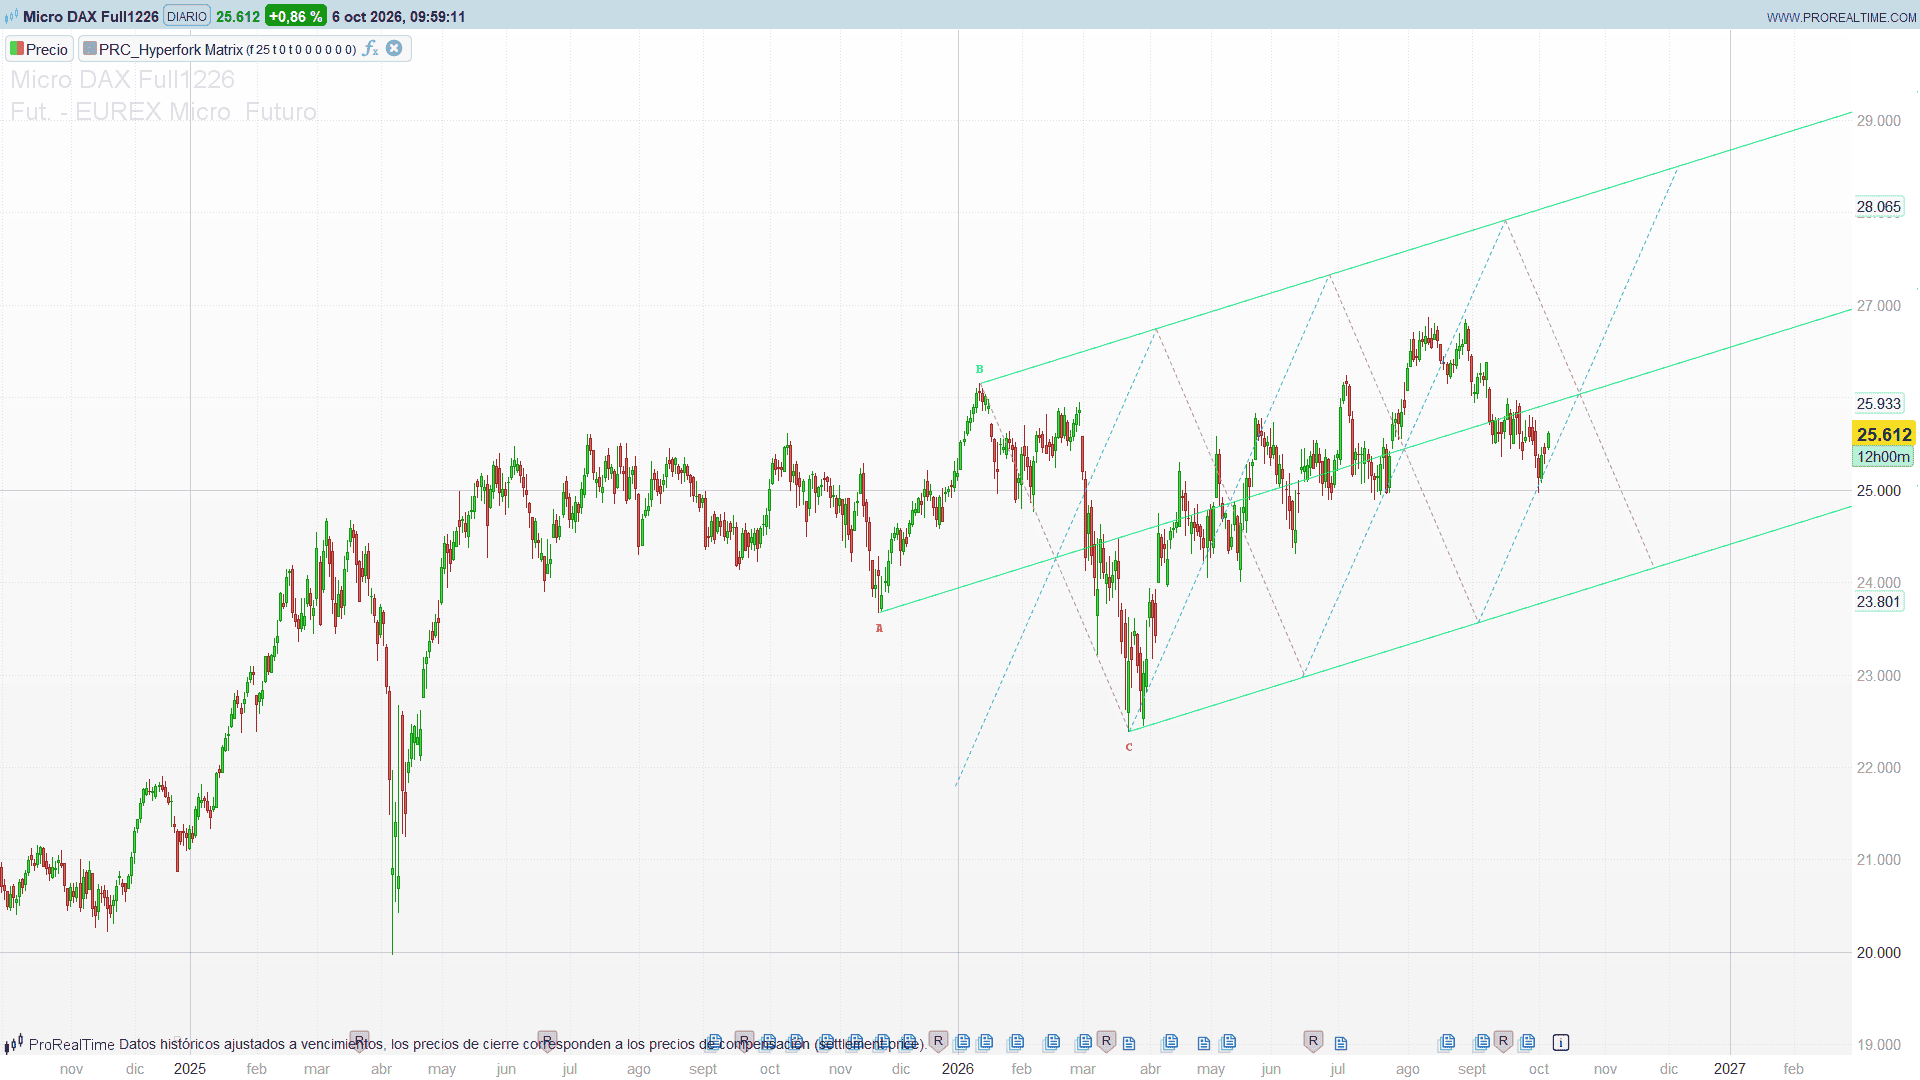
The Andrews Pitchfork is one of the classic tools for drawing a trend channel from three swing points. Hyperfork Matrix takes it further: on top of the pitchfork it projects the action and reaction lines along the handle, adds extra parallel levels outside the fork and can build a lattice of horizontal and vertical lines from their intersections. The result is a grid of price and time references that grows from three swing pivots, found automatically on the chart or set by you.
The concept builds on Patrick Mikula’s “Super Pitchfork” from his book on trendline methods, with automatic projections, three pitchfork variants and logarithmic scale support.
Theory Behind the Indicator
The pitchfork
The three pivots are A (the anchor), B and C (the two swings that follow). In automatic mode they are the last three swing pivots: a swing high is the highest high of prd bars on each side, a swing low the lowest low, and highs and lows alternate (of two consecutive highs, the higher one is kept). The fork is redrawn when a new pivot is confirmed, prd bars after it, and never changes afterwards. The median line starts at the anchor and passes through the midpoint of B and C. Two parallels to it pass through B and C: the upper and lower tines. Three variants change the anchor:
- Original: the anchor is pivot A.
- Schiff: the anchor is moved halfway up (or down) towards B, which gives a flatter fork.
- Modified Schiff: the anchor is moved halfway towards B both in price and in time.
Each tine starts on the reaction line through B, so the fork has a clean starting edge. Extra parallels can be added outside the fork, at the same spacing as the tines; with the price range filter, levels outside a minimum and maximum price are not drawn.
Action and reaction lines
The action line has the slope from A to B; the reaction line, the slope from B to C. Both are copied at regular steps along the handle (the segment from the anchor to the midpoint of B and C) and drawn between the outermost parallels. Forward, the copies reach the current bar automatically, and an offset adds or removes steps; backward, you choose how many. Where price meets one of these transversals is often where the swing changes pace.
The lattice
The lattice draws a horizontal line at the price of the chosen pivot (A, B or C) and finds where it crosses the median and parallels, the action lines or the reaction lines. The horizontal runs from the pivot to the farthest crossing, limited to the fork’s envelope, and a vertical is drawn at each crossing, between the outermost parallels. Those verticals are time references derived from the geometry of the swing.
Logarithmic scale
With the logarithmic option, everything is calculated on the logarithm of price, so the lines stay straight on a log-scale chart.
Key Features at a Glance
- Automatic swing pivots: the fork is always drawn on the latest swings, with the option to go back to previous forks
- Manual mode with the date and time of each pivot
- Three pitchfork variants: Original, Schiff and Modified Schiff
- Low-High-Low or High-Low-High pattern, automatic or forced by the user
- Extra parallel levels with an optional price range filter
- Action and reaction lines propagated forward (up to the current bar) and backward
- Lattice of horizontal and vertical lines from the intersections
- Lines extended to the right or in both directions
- Colour, style and width for every group of lines
- Median line and main parallels returned as hidden series for price alerts
- Logarithmic scale support
How to Read the Indicator
- The median line is the attraction line of the channel: in a healthy trend price tends to come back to it.
- The tines (upper and lower parallels) are the usual limits of the move; the extra parallels are the next levels when they break.
- Action and reaction lines cut the channel into steps. A reaction of price at one of them is a timing signal inside the trend.
- The lattice verticals mark bars where the geometry of the swing meets the chosen pivot’s level, useful as time windows.
Practical Applications
- Trend channel trading. Buy pullbacks to the median line or the lower tine in an uptrend, with the next parallel as target.
- Breakout levels. A close outside a tine points to the next extra parallel as the following objective.
- Timing. Crossings of action and reaction lines with price, and the lattice verticals, give candidate dates for a reaction.
- Alerts. The median line and the two main parallels are returned as series: in the ProRealTime alert window you can set an alert when price crosses any of them.
Indicator Configuration
Pivot points
pivotMode(default: 0): 0 = automatic swing pivots, 1 = manual pivots (dates and times below).prd(default: 15): automatic mode, bars on each side of a swing pivot. Lower values give shorter, more frequent forks.forkBack(default: 0): automatic mode, 0 = fork on the latest pivot, 1 = the previous fork, 2 = the one before, and so on.startType(default: 0): 0 = Auto (automatic mode: the last three pivots; manual mode: the stronger of Low-High-Low and High-Low-High), 1 = Low-High-Low, 2 = High-Low-High.dateA,dateB,dateC(default: 0): manual mode, date of each pivot bar as YYYYMMDD, for example 20260115. Nothing is drawn until the three dates are set.timeA,timeB,timeC(default: 0): manual mode, opening time of each pivot bar as HHMMSS, for example 143000. With 0, the first bar of that date (enough on daily charts).showLabels(default: 1): A, B and C labels on the pivots.hiPivR/G/BandloPivR/G/B: label colours of high and low pivots.labelSize(default: 2): 0 = tiny, 1 = small, 2 = normal, 3 = large.
Pitchfork
useLog(default: 0): 1 = calculations in log space, for log-scale charts.pfType(default: 0): 0 = Original, 1 = Schiff, 2 = Modified Schiff.extraLevels(default: 0): extra parallels outside the fork, on each side.pfR/G/B,pfWidth(default: 1, from 1 to 4) andpfStyle(default: 0; 0 = solid, 1 = dashed, 2 = dotted): colour, width and style of the fork.extendBoth(default: 0): 0 = lines extended to the right, 1 = in both directions.usePriceRange(default: 1),rangeMin(default: 0) andrangeMax(default: 1000000): hide the extra parallels outside this price range.
Action and reaction lines
drawType(default: 3): 0 = none, 1 = action only, 2 = reaction only, 3 = both.fwdOffset(default: 0): forward lines. 0 = up to the current bar; positive adds lines beyond it, negative removes them.backCount(default: 0): number of lines backward from the anchor.acR/G/B,acWidth,acStyle(default: dotted) andreR/G/B,reWidth,reStyle(default: dotted): appearance of action and reaction lines.
Lattice
drawLattice(default: 0): 1 = draw the lattice.latPivot(default: 0): pivot for the horizontal. 0 = A, 1 = B, 2 = C.latSource(default: 0): intersections with 0 = pitchfork and parallels, 1 = action lines, 2 = reaction lines, 3 = action and reaction lines.latR/G/B,latWidth,latStyle(default: dotted): appearance of the lattice.
Code
//---------------------------------------------------------------
// PRC_Hyperfork Matrix
// version = 0
// 06.10.2026
// Iván González @ www.prorealcode.com
// Author: BlueprintResearch (Javonnii)
// Sharing ProRealTime knowledge
//--------------------------------------------------------------------//
DEFPARAM DRAWONLASTBARONLY = TRUE
//--------------------------------------------------------------------//
// 1. PIVOT POINTS
//--------------------------------------------------------------------//
pivotMode = 0 // 0 = automatic (last swing pivots), 1 = manual (dates and times below)
prd = 15 // automatic: bars on each side of a pivot
forkBack = 0 // automatic: 0 = fork on the last pivot, 1 = on the previous one, 2 = ...
startType = 0 // Starting pivot type: 0 = Auto, 1 = Low (Low-High-Low), 2 = High (High-Low-High)
// manual mode: date YYYYMMDD and opening time HHMMSS of each pivot bar
dateA = 0 // Pivot A date, e.g. 20260115 (0 = not set)
timeA = 0 // Pivot A bar opening time, e.g. 143000 (0 = first bar of that date)
dateB = 0 // Pivot B date
timeB = 0 // Pivot B bar opening time
dateC = 0 // Pivot C date
timeC = 0 // Pivot C bar opening time
showLabels = 1 // show A, B, C labels
hiPivR = 0 // High pivot colour
hiPivG = 230
hiPivB = 118
loPivR = 255 // Low pivot colour
loPivG = 82
loPivB = 82
labelSize = 2 // 0 = Tiny, 1 = Small, 2 = Normal, 3 = Large
//--------------------------------------------------------------------//
// 2. PITCHFORK SETTINGS
//--------------------------------------------------------------------//
useLog = 0 // 1 = logarithmic scale (calculations in log space)
pfType = 0 // 0 = Original, 1 = Schiff, 2 = Modified Schiff
extraLevels = 0 // additional parallel lines outside the main pitchfork
pfR = 0 // pitchfork colour
pfG = 230
pfB = 118
pfWidth = 1 // pitchfork line width (1 to 4)
pfStyle = 0 // 0 = Solid, 1 = Dashed, 2 = Dotted
extendBoth = 0 // extend direction: 0 = Right, 1 = Both
usePriceRange = 1 // hide the extra parallels outside the price range
rangeMin = 0 // price range min
rangeMax = 1000000 // price range max
//--------------------------------------------------------------------//
// 3. ACTION / REACTION LINES
//--------------------------------------------------------------------//
drawType = 3 // 0 = None, 1 = Action only, 2 = Reaction only, 3 = Both
fwdOffset = 0 // forward lines offset: 0 = up to the current bar, + adds, - removes
backCount = 0 // number of lines backward from the median
acR = 0 // action lines colour
acG = 188
acB = 212
acWidth = 1 // action line width (1 to 4)
acStyle = 2 // 0 = Solid, 1 = Dashed, 2 = Dotted
reR = 255 // reaction lines colour
reG = 140
reB = 105
reWidth = 1 // reaction line width (1 to 4)
reStyle = 2 // 0 = Solid, 1 = Dashed, 2 = Dotted
//--------------------------------------------------------------------//
// 4. LATTICE
//--------------------------------------------------------------------//
drawLattice = 0 // 1 = draw the horizontal and vertical lattice lines
latPivot = 0 // pivot for the horizontal: 0 = A, 1 = B, 2 = C
latSource = 0 // intersections: 0 = Pitchfork & Parallels, 1 = Action, 2 = Reaction, 3 = Action & Reaction
latR = 120 // lattice colour (mid grey, visible on light and dark backgrounds)
latG = 120
latB = 120
latWidth = 1 // lattice line width (1 to 4)
latStyle = 2 // 0 = Solid, 1 = Dashed, 2 = Dotted
//--------------------------------------------------------------------//
// AUTOMATIC PIVOTS (closed bars only: the right window never reads the live bar)
// Highs and lows alternate: a new pivot of the same type as the last one
// replaces it only if it is more extreme.
//--------------------------------------------------------------------//
ONCE nPv = 0
IF pivotMode = 0 AND barindex >= 2 * prd + 1 THEN
cX = barindex - 1 - prd
cH = high[prd + 1]
cL = low[prd + 1]
IF cH = highest[2 * prd + 1](high)[1] THEN
IF nPv > 0 THEN
IF $pvT[nPv] = 1 THEN
IF cH > $pvY[nPv] THEN
$pvX[nPv] = cX
$pvY[nPv] = cH
ENDIF
ELSE
nPv = nPv + 1
$pvX[nPv] = cX
$pvY[nPv] = cH
$pvT[nPv] = 1
ENDIF
ELSE
nPv = 1
$pvX[nPv] = cX
$pvY[nPv] = cH
$pvT[nPv] = 1
ENDIF
ENDIF
IF cL = lowest[2 * prd + 1](low)[1] THEN
IF nPv > 0 THEN
IF $pvT[nPv] = -1 THEN
IF cL < $pvY[nPv] THEN
$pvX[nPv] = cX
$pvY[nPv] = cL
ENDIF
ELSE
nPv = nPv + 1
$pvX[nPv] = cX
$pvY[nPv] = cL
$pvT[nPv] = -1
ENDIF
ELSE
nPv = 1
$pvX[nPv] = cX
$pvY[nPv] = cL
$pvT[nPv] = -1
ENDIF
ENDIF
ENDIF
//--------------------------------------------------------------------//
// MANUAL PIVOT BARS
//--------------------------------------------------------------------//
ONCE fA = 0
ONCE fB = 0
ONCE fC = 0
ONCE xA = 0
ONCE xB = 0
ONCE xC = 0
ONCE hA = 0
ONCE hB = 0
ONCE hC = 0
ONCE lA = 0
ONCE lB = 0
ONCE lC = 0
// first bar of the chosen date opening at or after the chosen time
hitA = 0
IF dateA > 0 AND date = dateA AND opentime >= timeA THEN
hitA = 1
IF barindex > 0 THEN
IF date[1] = dateA AND opentime[1] >= timeA THEN
hitA = 0
ENDIF
ENDIF
ENDIF
IF hitA = 1 THEN
fA = 1
xA = barindex
hA = high
lA = low
ENDIF
hitB = 0
IF dateB > 0 AND date = dateB AND opentime >= timeB THEN
hitB = 1
IF barindex > 0 THEN
IF date[1] = dateB AND opentime[1] >= timeB THEN
hitB = 0
ENDIF
ENDIF
ENDIF
IF hitB = 1 THEN
fB = 1
xB = barindex
hB = high
lB = low
ENDIF
hitC = 0
IF dateC > 0 AND date = dateC AND opentime >= timeC THEN
hitC = 1
IF barindex > 0 THEN
IF date[1] = dateC AND opentime[1] >= timeC THEN
hitC = 0
ENDIF
ENDIF
ENDIF
IF hitC = 1 THEN
fC = 1
xC = barindex
hC = high
lC = low
ENDIF
//--------------------------------------------------------------------//
// PITCHFORK GEOMETRY
//--------------------------------------------------------------------//
okFork = 0
mlS = undefined
upS = undefined
loS = undefined
okPiv = 0
IF pivotMode = 0 THEN
// last three alternating pivots: A and C share the type, B is the opposite one
ic = nPv - forkBack
IF startType = 1 AND ic >= 1 THEN
IF $pvT[ic] = 1 THEN
ic = ic - 1 // Low-High-Low: C must be a low
ENDIF
ELSIF startType = 2 AND ic >= 1 THEN
IF $pvT[ic] = -1 THEN
ic = ic - 1 // High-Low-High: C must be a high
ENDIF
ENDIF
IF ic >= 3 THEN
okPiv = 1
IF $pvT[ic - 2] = 1 THEN
aHigh = 1
ELSE
aHigh = 0
ENDIF
rawA = $pvY[ic - 2]
rawB = $pvY[ic - 1]
rawC = $pvY[ic]
pAx = $pvX[ic - 2]
pBx = $pvX[ic - 1]
pCx = $pvX[ic]
ENDIF
ELSIF fA = 1 AND fB = 1 AND fC = 1 THEN
okPiv = 1
pAx = xA
pBx = xB
pCx = xC
// pivot types: A and C share the type, B is the opposite one
IF startType = 0 THEN
lhlStr = (hB - lA) + (hB - lC)
hlhStr = (hA - lB) + (hC - lB)
IF lhlStr >= hlhStr THEN
aHigh = 0
ELSE
aHigh = 1
ENDIF
ELSIF startType = 1 THEN
aHigh = 0
ELSE
aHigh = 1
ENDIF
IF aHigh = 1 THEN
rawA = hA
rawB = lB
rawC = hC
ELSE
rawA = lA
rawB = hB
rawC = lC
ENDIF
ENDIF
IF okPiv = 1 THEN
IF useLog = 1 THEN
pAy = log(rawA)
pBy = log(rawB)
pCy = log(rawC)
ELSE
pAy = rawA
pBy = rawB
pCy = rawC
ENDIF
// midpoint of B-C and anchor of the median line
midX = (pBx + pCx) / 2
midY = (pBy + pCy) / 2
IF pfType = 0 THEN
ancX = pAx
ancY = pAy
ELSIF pfType = 1 THEN
ancX = pAx
ancY = pAy + 0.5 * (pBy - pAy)
ELSE
ancX = pAx + 0.5 * (pBx - pAx)
ancY = pAy + 0.5 * (pBy - pAy)
ENDIF
// slopes: median (anchor -> mid B-C), reaction (B -> C), action (A -> B)
okMl = 0
sMl = 0
IF midX <> ancX THEN
okMl = 1
sMl = (midY - ancY) / (midX - ancX)
ENDIF
okTr = 0
sTr = 0
IF pCx <> pBx THEN
okTr = 1
sTr = (pCy - pBy) / (pCx - pBx)
ENDIF
okAc = 0
sAc = 0
IF pBx <> pAx THEN
okAc = 1
sAc = (pBy - pAy) / (pBx - pAx)
ENDIF
// upper and lower tines
upX = pBx
upY = pBy
loX = pCx
loY = pCy
IF pBy < pCy THEN
upX = pCx
upY = pCy
loX = pBx
loY = pBy
ENDIF
IF okMl = 1 THEN
okFork = 1
// the three main lines as series (alert source), from the bar after pivot C
IF barindex > pCx THEN
mlY = ancY + sMl * (barindex - ancX)
upLY = upY + sMl * (barindex - upX)
loLY = loY + sMl * (barindex - loX)
IF useLog = 1 THEN
mlS = exp(mlY)
upS = exp(upLY)
loS = exp(loLY)
ELSE
mlS = mlY
upS = upLY
loS = loLY
ENDIF
ENDIF
ENDIF
ENDIF
//--------------------------------------------------------------------//
// DRAWING
//--------------------------------------------------------------------//
IF islastbarupdate THEN
IF okFork = 0 THEN
IF pivotMode = 0 THEN
DRAWTEXT("Hyperfork Matrix: not enough pivots yet (lower prd or forkBack)", -300, -30, SansSerif, Bold, 11) COLOURED(255, 93, 0) ANCHOR(TOPRIGHT, XSHIFT, YSHIFT)
ELSIF dateA = 0 OR dateB = 0 OR dateC = 0 THEN
DRAWTEXT("Hyperfork Matrix: set the date (and time) of pivots A, B and C", -300, -30, SansSerif, Bold, 11) COLOURED(255, 93, 0) ANCHOR(TOPRIGHT, XSHIFT, YSHIFT)
ELSE
DRAWTEXT("Hyperfork Matrix: pivot A, B or C not found on the chart", -300, -30, SansSerif, Bold, 11) COLOURED(255, 93, 0) ANCHOR(TOPRIGHT, XSHIFT, YSHIFT)
ENDIF
ELSE
maxX = barindex + 500
minX = 0
allMinX = min(ancX, min(pBx, pCx))
nS = 0
// ---- pivot labels (Low below the bar, High above it)
IF showLabels = 1 THEN
lblOff = 0.5 * averagetruerange[14](close)
IF aHigh = 1 THEN
yLA = rawA + lblOff
yLB = rawB - lblOff
yLC = rawC + lblOff
acPR = hiPivR
acPG = hiPivG
acPB = hiPivB
bPR = loPivR
bPG = loPivG
bPB = loPivB
ELSE
yLA = rawA - lblOff
yLB = rawB + lblOff
yLC = rawC - lblOff
acPR = loPivR
acPG = loPivG
acPB = loPivB
bPR = hiPivR
bPG = hiPivG
bPB = hiPivB
ENDIF
IF labelSize = 0 THEN
DRAWTEXT("A", pAx, yLA, Monospaced, Bold, 8) COLOURED(acPR, acPG, acPB)
DRAWTEXT("B", pBx, yLB, Monospaced, Bold, 8) COLOURED(bPR, bPG, bPB)
DRAWTEXT("C", pCx, yLC, Monospaced, Bold, 8) COLOURED(acPR, acPG, acPB)
ELSIF labelSize = 1 THEN
DRAWTEXT("A", pAx, yLA, Monospaced, Bold, 10) COLOURED(acPR, acPG, acPB)
DRAWTEXT("B", pBx, yLB, Monospaced, Bold, 10) COLOURED(bPR, bPG, bPB)
DRAWTEXT("C", pCx, yLC, Monospaced, Bold, 10) COLOURED(acPR, acPG, acPB)
ELSIF labelSize = 2 THEN
DRAWTEXT("A", pAx, yLA, Monospaced, Bold, 12) COLOURED(acPR, acPG, acPB)
DRAWTEXT("B", pBx, yLB, Monospaced, Bold, 12) COLOURED(bPR, bPG, bPB)
DRAWTEXT("C", pCx, yLC, Monospaced, Bold, 12) COLOURED(acPR, acPG, acPB)
ELSE
DRAWTEXT("A", pAx, yLA, Monospaced, Bold, 15) COLOURED(acPR, acPG, acPB)
DRAWTEXT("B", pBx, yLB, Monospaced, Bold, 15) COLOURED(bPR, bPG, bPB)
DRAWTEXT("C", pCx, yLC, Monospaced, Bold, 15) COLOURED(acPR, acPG, acPB)
ENDIF
ENDIF
// ---- offsets of the parallels and extra levels inside the price range
offUp = upY - (ancY + sMl * (upX - ancX))
offLo = loY - (ancY + sMl * (loX - ancX))
effUp = extraLevels
effLo = extraLevels
IF usePriceRange = 1 THEN
IF useLog = 1 THEN
rMinY = log(max(rangeMin, 0.0001))
rMaxY = log(rangeMax)
ELSE
rMinY = rangeMin
rMaxY = rangeMax
ENDIF
IF offUp <> 0 AND extraLevels > 0 THEN
IF offUp > 0 THEN
mLev = floor((rMaxY - upY) / offUp)
ELSE
mLev = floor((upY - rMinY) / abs(offUp))
ENDIF
effUp = max(0, min(extraLevels, mLev))
ENDIF
IF offLo <> 0 AND extraLevels > 0 THEN
IF offLo < 0 THEN
mLev = floor((loY - rMinY) / abs(offLo))
ELSE
mLev = floor((rMaxY - loY) / offLo)
ENDIF
effLo = max(0, min(extraLevels, mLev))
ENDIF
ENDIF
effUpY = upY + effUp * offUp
effLoY = loY + effLo * offLo
// ---- start points of the pitchfork lines: median + tines (from the reaction line through B)
$lsX[0] = ancX
$lsY[0] = ancY
nL = 1
$ppX[0] = ancX
$ppY[0] = ancY
nPP = 1
IF okTr = 1 AND sTr <> sMl THEN
nT = 2 + effUp + effLo
FOR t = 0 TO nT - 1 DO
IF t = 0 THEN
tX = upX
tY = upY
ELSIF t = 1 THEN
tX = loX
tY = loY
ELSIF t < 2 + effUp THEN
tX = upX
tY = upY + (t - 1) * offUp
ELSE
tX = loX
tY = loY + (t - 1 - effUp) * offLo
ENDIF
ix = (tY - pBy + sTr * pBx - sMl * tX) / (sTr - sMl)
iy = sTr * (ix - pBx) + pBy
$ppX[nPP] = ix
$ppY[nPP] = iy
nPP = nPP + 1
IF ix < 0 THEN
$lsX[nL] = 0
$lsY[nL] = tY + sMl * (0 - tX)
ELSE
$lsX[nL] = ix
$lsY[nL] = iy
ENDIF
nL = nL + 1
NEXT
ENDIF
// pitchfork lines -> drawing list (kind 1)
FOR q = 0 TO nL - 1 DO
stX = $lsX[q]
stY = $lsY[q]
IF extendBoth = 1 THEN
sx1 = max(minX, allMinX)
sy1 = stY + sMl * (sx1 - stX)
$sE[nS] = 2
ELSE
sx1 = stX
sy1 = stY
$sE[nS] = 1
ENDIF
$sX1[nS] = sx1
$sY1[nS] = sy1
$sX2[nS] = maxX
$sY2[nS] = stY + sMl * (maxX - stX)
$sK[nS] = 1
nS = nS + 1
NEXT
// ---- outermost parallels (vertical extent of the lattice)
okOut = 0
IF okTr = 1 AND sTr <> sMl THEN
okOut = 1
ouX = (effUpY - pBy + sTr * pBx - sMl * upX) / (sTr - sMl)
ouY = sTr * (ouX - pBx) + pBy
olX = (effLoY - pBy + sTr * pBx - sMl * loX) / (sTr - sMl)
olY = sTr * (olX - pBx) + pBy
ENDIF
// ---- propagation points along the handle (anchor -> mid B-C)
hdx = midX - ancX
hdy = midY - ancY
hLen = sqrt(hdx * hdx + hdy * hdy)
autoF = 0
IF hdx <> 0 THEN
autoF = max(1, ceil(abs((barindex - ancX) / hdx)))
ENDIF
effF = max(1, autoF + fwdOffset)
nPr = 0
IF hLen > 0 THEN
IF backCount > 0 THEN
FOR i = 0 TO backCount DO
$prX[nPr] = ancX - i * hdx
$prY[nPr] = ancY - i * hdy
nPr = nPr + 1
NEXT
ENDIF
FOR i = 1 TO effF DO
$prX[nPr] = ancX + i * hdx
$prY[nPr] = ancY + i * hdy
nPr = nPr + 1
NEXT
ENDIF
// ---- action / reaction transversals between the outermost parallels
IF drawType > 0 AND hLen > 0 AND nPr > 0 THEN
FOR p = 0 TO nPr - 1 DO
prpX = $prX[p]
prpY = $prY[p]
FOR w = 0 TO 1 DO
okW = 0
IF w = 0 AND (drawType = 2 OR drawType = 3) AND okTr = 1 AND sTr <> sMl THEN
okW = 1
sW = sTr
kW = 2
ENDIF
IF w = 1 AND (drawType = 1 OR drawType = 3) AND okAc = 1 AND sAc <> sMl THEN
okW = 1
sW = sAc
kW = 3
ENDIF
IF okW = 1 THEN
uix = (effUpY - prpY + sW * prpX - sMl * upX) / (sW - sMl)
lix = (effLoY - prpY + sW * prpX - sMl * loX) / (sW - sMl)
uix = max(minX, min(maxX, uix))
lix = max(minX, min(maxX, lix))
IF uix <> lix THEN
$sX1[nS] = uix
$sY1[nS] = sW * (uix - prpX) + prpY
$sX2[nS] = lix
$sY2[nS] = sW * (lix - prpX) + prpY
$sE[nS] = 0
$sK[nS] = kW
nS = nS + 1
ENDIF
ENDIF
NEXT
NEXT
ENDIF
// ---- lattice: horizontal from the chosen pivot + verticals at the intersections
IF drawLattice = 1 THEN
IF latPivot = 1 THEN
hzY = pBy
pvX = pBx
ELSIF latPivot = 2 THEN
hzY = pCy
pvX = pCx
ELSE
hzY = pAy
pvX = pAx
ENDIF
nI = 0
IF latSource = 0 AND sMl <> 0 THEN
FOR q = 0 TO nPP - 1 DO
$inX[nI] = $ppX[q] + (hzY - $ppY[q]) / sMl
nI = nI + 1
NEXT
ENDIF
IF nPr > 0 THEN
IF (latSource = 2 OR latSource = 3) AND okTr = 1 AND sTr <> 0 THEN
FOR q = 0 TO nPr - 1 DO
$inX[nI] = $prX[q] + (hzY - $prY[q]) / sTr
nI = nI + 1
NEXT
ENDIF
IF (latSource = 1 OR latSource = 3) AND okAc = 1 AND sAc <> 0 THEN
FOR q = 0 TO nPr - 1 DO
$inX[nI] = $prX[q] + (hzY - $prY[q]) / sAc
nI = nI + 1
NEXT
ENDIF
ENDIF
IF nI > 0 THEN
// horizontal: up to the farthest intersection on the chart, clamped to the envelope
nF = 0
mxI = 0
FOR q = 0 TO nI - 1 DO
fx = $inX[q]
IF fx >= 0 AND fx <= maxX THEN
IF nF = 0 OR fx > mxI THEN
mxI = fx
ENDIF
nF = nF + 1
ENDIF
NEXT
IF nF > 0 AND sMl <> 0 THEN
ubX = upX + (hzY - effUpY) / sMl
lbX = loX + (hzY - effLoY) / sMl
IF ubX >= pvX AND lbX >= pvX THEN
envX = min(ubX, lbX)
ELSIF ubX >= pvX THEN
envX = ubX
ELSIF lbX >= pvX THEN
envX = lbX
ELSE
envX = pvX
ENDIF
$sX1[nS] = pvX
$sY1[nS] = hzY
$sX2[nS] = min(mxI, envX)
$sY2[nS] = hzY
$sE[nS] = 0
$sK[nS] = 4
nS = nS + 1
ENDIF
// verticals between the outermost parallels, right of the chosen pivot
IF okOut = 1 THEN
FOR q = 0 TO nI - 1 DO
vX = $inX[q]
IF vX >= pvX AND vX >= minX AND vX <= maxX THEN
yVa = ouY + sMl * (vX - ouX)
yVb = olY + sMl * (vX - olX)
$sX1[nS] = vX
$sY1[nS] = min(yVa, yVb)
$sX2[nS] = vX
$sY2[nS] = max(yVa, yVb)
$sE[nS] = 0
$sK[nS] = 4
nS = nS + 1
ENDIF
NEXT
ENDIF
ENDIF
ENDIF
// ---- draw the list (1 = pitchfork, 2 = reaction, 3 = action, 4 = lattice)
IF nS > 0 THEN
FOR q = 0 TO nS - 1 DO
kd = $sK[q]
IF kd = 1 THEN
segR = pfR
segG = pfG
segB = pfB
lnSt = pfStyle
lnW = pfWidth
ELSIF kd = 2 THEN
segR = reR
segG = reG
segB = reB
lnSt = reStyle
lnW = reWidth
ELSIF kd = 3 THEN
segR = acR
segG = acG
segB = acB
lnSt = acStyle
lnW = acWidth
ELSE
segR = latR
segG = latG
segB = latB
lnSt = latStyle
lnW = latWidth
ENDIF
dx1 = round($sX1[q])
dx2 = round($sX2[q])
IF useLog = 1 THEN
dy1 = exp($sY1[q])
dy2 = exp($sY2[q])
ELSE
dy1 = $sY1[q]
dy2 = $sY2[q]
ENDIF
ext = $sE[q]
IF ext = 1 THEN
IF lnSt = 0 THEN
IF lnW <= 1 THEN
DRAWRAY(dx1, dy1, dx2, dy2) COLOURED(segR, segG, segB) STYLE(line, 1)
ELSIF lnW = 2 THEN
DRAWRAY(dx1, dy1, dx2, dy2) COLOURED(segR, segG, segB) STYLE(line, 2)
ELSIF lnW = 3 THEN
DRAWRAY(dx1, dy1, dx2, dy2) COLOURED(segR, segG, segB) STYLE(line, 3)
ELSE
DRAWRAY(dx1, dy1, dx2, dy2) COLOURED(segR, segG, segB) STYLE(line, 4)
ENDIF
ELSIF lnSt = 1 THEN
IF lnW <= 1 THEN
DRAWRAY(dx1, dy1, dx2, dy2) COLOURED(segR, segG, segB) STYLE(dottedline2, 1)
ELSIF lnW = 2 THEN
DRAWRAY(dx1, dy1, dx2, dy2) COLOURED(segR, segG, segB) STYLE(dottedline2, 2)
ELSIF lnW = 3 THEN
DRAWRAY(dx1, dy1, dx2, dy2) COLOURED(segR, segG, segB) STYLE(dottedline2, 3)
ELSE
DRAWRAY(dx1, dy1, dx2, dy2) COLOURED(segR, segG, segB) STYLE(dottedline2, 4)
ENDIF
ELSE
IF lnW <= 1 THEN
DRAWRAY(dx1, dy1, dx2, dy2) COLOURED(segR, segG, segB) STYLE(dottedline, 1)
ELSIF lnW = 2 THEN
DRAWRAY(dx1, dy1, dx2, dy2) COLOURED(segR, segG, segB) STYLE(dottedline, 2)
ELSIF lnW = 3 THEN
DRAWRAY(dx1, dy1, dx2, dy2) COLOURED(segR, segG, segB) STYLE(dottedline, 3)
ELSE
DRAWRAY(dx1, dy1, dx2, dy2) COLOURED(segR, segG, segB) STYLE(dottedline, 4)
ENDIF
ENDIF
ELSIF ext = 2 THEN
IF lnSt = 0 THEN
IF lnW <= 1 THEN
DRAWLINE(dx1, dy1, dx2, dy2) COLOURED(segR, segG, segB) STYLE(line, 1)
ELSIF lnW = 2 THEN
DRAWLINE(dx1, dy1, dx2, dy2) COLOURED(segR, segG, segB) STYLE(line, 2)
ELSIF lnW = 3 THEN
DRAWLINE(dx1, dy1, dx2, dy2) COLOURED(segR, segG, segB) STYLE(line, 3)
ELSE
DRAWLINE(dx1, dy1, dx2, dy2) COLOURED(segR, segG, segB) STYLE(line, 4)
ENDIF
ELSIF lnSt = 1 THEN
IF lnW <= 1 THEN
DRAWLINE(dx1, dy1, dx2, dy2) COLOURED(segR, segG, segB) STYLE(dottedline2, 1)
ELSIF lnW = 2 THEN
DRAWLINE(dx1, dy1, dx2, dy2) COLOURED(segR, segG, segB) STYLE(dottedline2, 2)
ELSIF lnW = 3 THEN
DRAWLINE(dx1, dy1, dx2, dy2) COLOURED(segR, segG, segB) STYLE(dottedline2, 3)
ELSE
DRAWLINE(dx1, dy1, dx2, dy2) COLOURED(segR, segG, segB) STYLE(dottedline2, 4)
ENDIF
ELSE
IF lnW <= 1 THEN
DRAWLINE(dx1, dy1, dx2, dy2) COLOURED(segR, segG, segB) STYLE(dottedline, 1)
ELSIF lnW = 2 THEN
DRAWLINE(dx1, dy1, dx2, dy2) COLOURED(segR, segG, segB) STYLE(dottedline, 2)
ELSIF lnW = 3 THEN
DRAWLINE(dx1, dy1, dx2, dy2) COLOURED(segR, segG, segB) STYLE(dottedline, 3)
ELSE
DRAWLINE(dx1, dy1, dx2, dy2) COLOURED(segR, segG, segB) STYLE(dottedline, 4)
ENDIF
ENDIF
ELSE
IF lnSt = 0 THEN
IF lnW <= 1 THEN
DRAWSEGMENT(dx1, dy1, dx2, dy2) COLOURED(segR, segG, segB) STYLE(line, 1)
ELSIF lnW = 2 THEN
DRAWSEGMENT(dx1, dy1, dx2, dy2) COLOURED(segR, segG, segB) STYLE(line, 2)
ELSIF lnW = 3 THEN
DRAWSEGMENT(dx1, dy1, dx2, dy2) COLOURED(segR, segG, segB) STYLE(line, 3)
ELSE
DRAWSEGMENT(dx1, dy1, dx2, dy2) COLOURED(segR, segG, segB) STYLE(line, 4)
ENDIF
ELSIF lnSt = 1 THEN
IF lnW <= 1 THEN
DRAWSEGMENT(dx1, dy1, dx2, dy2) COLOURED(segR, segG, segB) STYLE(dottedline2, 1)
ELSIF lnW = 2 THEN
DRAWSEGMENT(dx1, dy1, dx2, dy2) COLOURED(segR, segG, segB) STYLE(dottedline2, 2)
ELSIF lnW = 3 THEN
DRAWSEGMENT(dx1, dy1, dx2, dy2) COLOURED(segR, segG, segB) STYLE(dottedline2, 3)
ELSE
DRAWSEGMENT(dx1, dy1, dx2, dy2) COLOURED(segR, segG, segB) STYLE(dottedline2, 4)
ENDIF
ELSE
IF lnW <= 1 THEN
DRAWSEGMENT(dx1, dy1, dx2, dy2) COLOURED(segR, segG, segB) STYLE(dottedline, 1)
ELSIF lnW = 2 THEN
DRAWSEGMENT(dx1, dy1, dx2, dy2) COLOURED(segR, segG, segB) STYLE(dottedline, 2)
ELSIF lnW = 3 THEN
DRAWSEGMENT(dx1, dy1, dx2, dy2) COLOURED(segR, segG, segB) STYLE(dottedline, 3)
ELSE
DRAWSEGMENT(dx1, dy1, dx2, dy2) COLOURED(segR, segG, segB) STYLE(dottedline, 4)
ENDIF
ENDIF
ENDIF
NEXT
ENDIF
ENDIF
ENDIF
RETURN mlS COLOURED(pfR, pfG, pfB, 0) AS "Median line", upS COLOURED(pfR, pfG, pfB, 0) AS "Upper parallel", loS COLOURED(pfR, pfG, pfB, 0) AS "Lower parallel"