







ZigZag SupDem (supply and demand zones)
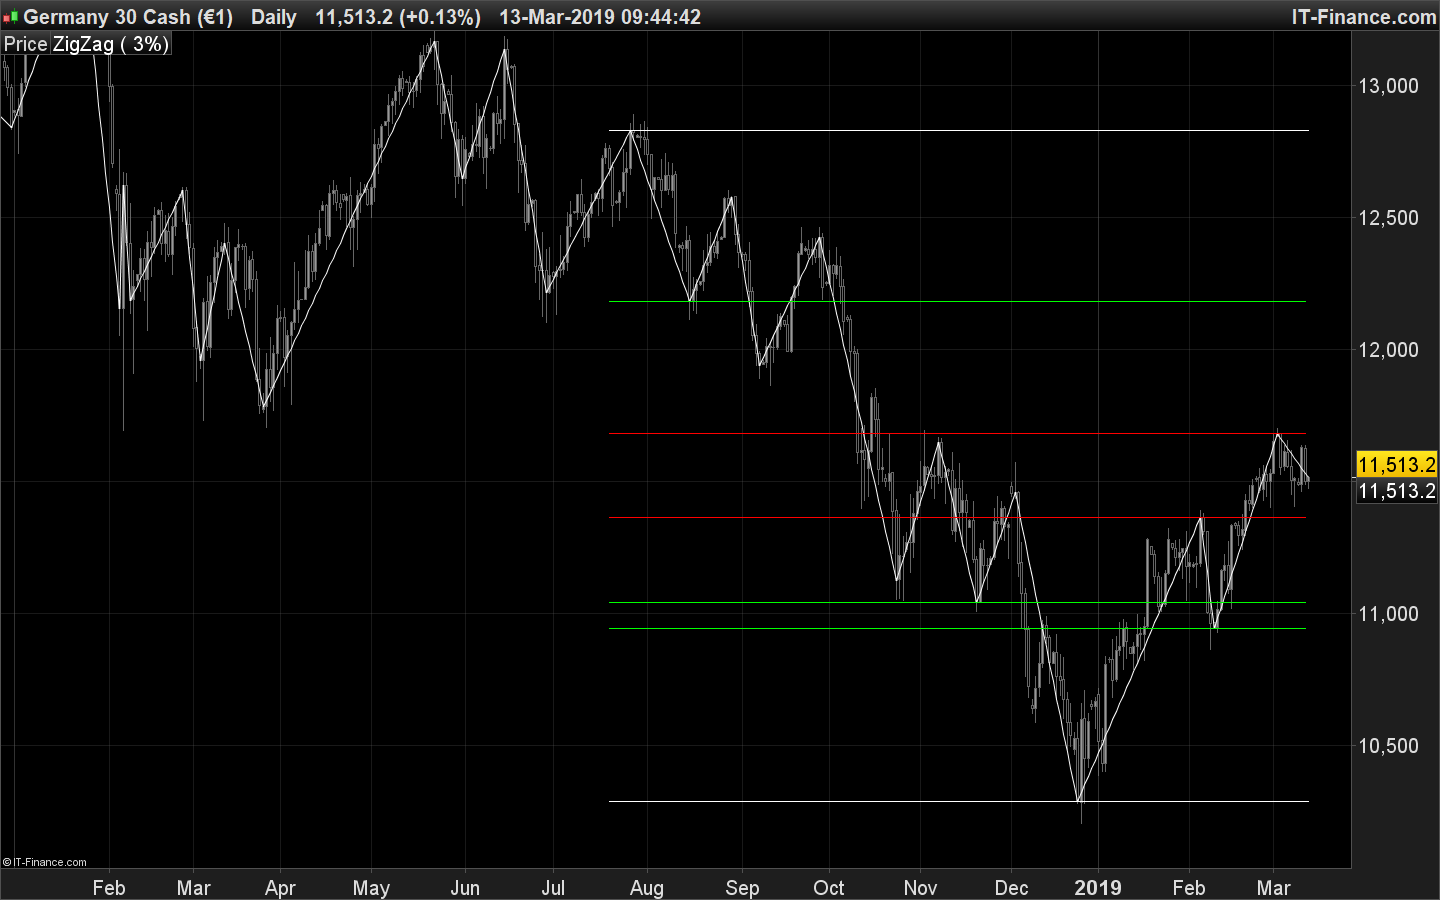
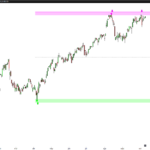
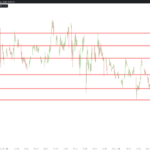
The ZigZag SupDem Zones Indicator detects support and resistance (supply and demand) zones using peaks and troughs formed by the ZigZag.
Depending on the timeframe used, it is necessary to set the necessary percentage to form a new peak or trough, by default that is set to 3%, ideal for most instruments on a unit of daily time.
The detection will be done only on the last periods set by the variable “lookback”.
The detection is validated if the indicator finds at least “minPoints” troughs or peaks not more distant than at most “threshold” in percentage.
- percent = 3 (percentage change of ZigZag to get new peaks and troughs, new swings)
- lookback = 200 (the period to search for supports and resistances)
- threshold = 1 (percentage to validate another zigzag from the one previously found to validate a support or a resistance)
- minPoint = 2 (at least it takes 2 swings of the same type, located one another less than “threshold” percent to validate a support or resistance)
//PRC_ZigZag SupDem | indicator
//13.03.2019
//Nicolas @ www.prorealcode.com
//Sharing ProRealTime knowledge

defparam drawonlastbaronly=true
defparam calculateonlastbars=1000

// --- settings
percent = 3 //zigzag percent
lookback = 100 //max history lookback
threshold = 1 //price percent between 2 ZZ points
minPoint = 2 //minimal points to confirm S/R
showSupport = 1 //plot support zones or not? (0=false;1=true)
showResistance = 1 //plot resistance zones or not? (0=false;1=true)
// --- end of settings

//zz s/r
zz = ZigZag[percent](customclose)
p = zz<zz[1] and zz[1]>zz[2]
t = zz>zz[1] and zz[1]<zz[2]
if p then
 top = zz[1]
endif
if t then
 bottom = zz[1]
endif

once minPoint = max(2,minPoint)

for i = 1 to lookback do
 if showResistance then
 //new peak
  if p[i] then
   topdata = top[i]
   hhtop = topdata+(customclose[i]*(threshold/100))
   lltop = topdata-(customclose[i]*(threshold/100))

   resttest=0
   for y = i to lookback do
    resttest = resttest + (top[y]<hhtop and top[y]>lltop)
    if resttest>=minPoint then
     //drawarrowdown(barindex[i],topdata) coloured(255,0,0)
     drawsegment(barindex[lookback],topdata,barindex[1],topdata) coloured(255,0,0)
     break
    endif
   next
  endif
 endif
 if showSupport then
  //new through
  if t[i] then
   data = bottom[i]
   hh = data+(customclose[i]*(threshold/100))
   ll = data-(customclose[i]*(threshold/100))

   suptest=0
   for y = i to lookback do
    suptest = suptest + (bottom[y]<hh and bottom[y]>ll)
    if suptest>=minPoint then
     //drawarrowup(barindex[i],data) coloured(0,255,0)
     drawsegment(barindex[lookback],data,barindex[1],data) coloured(0,255,0)
     break
    endif
   next
  endif
 endif
next

hprice = highest[lookback](customclose)
lprice = lowest[lookback](customclose)
drawsegment(barindex[lookback],hprice,barindex,hprice)
drawsegment(barindex[lookback],lprice,barindex,lprice)

return
Comments
You must be logged in to post a comment.


Modifs: ajout du prix A faire tourner en 1 heure 50 unités dans tout petite fenêtre. Alors merci au créateur. //PRC_ZigZag SupDem | indicator //13.03.2019 //Nicolas @ www.prorealcode.com //Sharing ProRealTime knowledge defparam drawonlastbaronly=true defparam calculateonlastbars=1000 // --- settings //ecartmini = 3 //zigzag ecartmini //lookback = 100 //max history lookback //eliminanciens = 1 //price ecartmini between 2 ZZ points //minPoint = 2 //minimal points to confirm S/R //showSupport = 1 //plot support zones or not? (0=false;1=true) //showResistance = 1 //plot resistance zones or not? (0=false;1=true) // --- end of settings //zz s/r zz = ZigZag[ecartmini](customclose) p = zzzz[2] t = zz>zz[1] and zz[1]<zz[2] if p then top = zz[1] endif if t then bottom = zz[1] endif once minPoint = max(2,minPoint) for i = 1 to lookback do if showResistance then //new peak if p[i] then topdata = top[i] hhtop = topdata+(customclose[i]*(eliminanciens/100)) lltop = topdata-(customclose[i]*(eliminanciens/100)) resttest=0 for y = i to lookback do resttest = resttest + (top[y]lltop) if resttest>=minPoint then //drawarrowdown(barindex[i],topdata) coloured(255,0,0) drawsegment(barindex[lookback],topdata,barindex[1],topdata) coloured(255,0,0) DRAWTEXT("#topdata#",barindex+5,topdata,SansSerif,Bold,14)coloured(153,153,0) break endif next endif endif if showSupport then //new through if t[i] then data = bottom[i] hh = data+(customclose[i]*(eliminanciens/100)) ll = data-(customclose[i]*(eliminanciens/100)) suptest=0 for y = i to lookback do suptest = suptest + (bottom[y]ll) if suptest>=minPoint then //drawarrowup(barindex[i],data) coloured(0,255,0) drawsegment(barindex[lookback],data,barindex[1],data) coloured(0,255,0) DRAWTEXT("#data#",barindex+5,data,SansSerif,Bold,14)coloured(153,153,0) break endif next endif endif next hprice = highest[lookback](customclose) lprice = lowest[lookback](customclose) drawsegment(barindex[lookback],hprice,barindex,hprice) DRAWTEXT("#hprice#",barindex+5,hprice,SansSerif,Bold,16)coloured(153,153,153) drawsegment(barindex[lookback],lprice,barindex,lprice) DRAWTEXT("#lprice#",barindex+5,lprice,SansSerif,Bold,16)coloured(153,153,153) prix = Close return prix as "supports et résistances" //coloured(153,153,0) //




Hola Nicolas, por si acaso tienes el código de la funccion ' ZIgZAG' ? O... sabrias como desarrollar solamente esta funccion? Muchas Gracias!!!
Esta función es interna y no puede reproducirse con el mismo comportamiento por código (repita en tiempo real la última parte superior o inferior). Los indicadores de fractales también son un buen enfoque para encontrar las partes superiores e inferiores, hay muchos indicadores basados en ellos en la biblioteca.

Hola Nicolas,.... ¿Tienes disponible algún screener para ondas de wolfe? Haces un trabajo increíble!!!! Gracias!!!

Hola Nicolas,tengo un problema cuando importo el .itf pone que esta instalado correctamente,pero cuando lo añado ,se añade debajo del precio en una ventana nueva,como si fuese un rsi o un macd...me salen las velas de frenada y compra, pero me salen por abajo no en el mismo precio...como podría arreglarlo ? Felicidades por el trabajo realizado.
NE fonctionne pas ( ou plus ... )