

Dynamic Support & Resistance
Identifying key price levels through weighted pivot distribution
Most support and resistance indicators rely on simple pivot points or fixed lookback periods, producing static levels that fail to capture the true “memory” of the market. This indicator takes a fundamentally different approach: it collects pivots across four configurable timeframes, weights them by relevance, and builds a statistical distribution of where price has historically reversed. A sinc filter then smooths the distribution to reveal the dominant price levels — the zones where the market has the strongest structural memory.
The result is a set of dynamic S/R levels that adapt to the instrument’s price history, complete with visual zones, a projected histogram, and automatic bounce detection.
How it works
The indicator operates in four stages that transform raw price action into actionable support and resistance levels.
Multi-length pivot detection — Four independent pivot detectors scan for swing highs and swing lows using configurable lookback lengths (default: 5, 10, 20, 50). Shorter lengths capture minor reversals while longer lengths identify major structural pivots. Each detected pivot is stored with its price, bar index, and a calculated weight. This multi-scale approach ensures that both short-term reaction levels and long-term structural zones are represented in the final output.
Weighting system — Each pivot receives a weight that determines its influence on the distribution. Three weighting styles are available:
- Linear — All pivots carry equal weight regardless of when they occurred. Best for instruments with consistent behavior over time.
- Time — Recent pivots receive higher weight based on their bar index. Useful when recent price action is more relevant than historical levels.
- Volume — Pivots are weighted by the volume at the time of the reversal. Ideal for identifying levels where significant institutional activity occurred.
Binned distribution with sinc filter — The full price range of all stored pivots is divided into a configurable number of bins (default: 75). Each pivot’s weight is accumulated into the bin corresponding to its price level, creating a raw distribution profile. A sinc filter (windowed cardinal sine function) is then applied to smooth the distribution. The filter strength parameter controls how aggressively the noise is removed — higher values produce fewer, more dominant levels while lower values preserve more granular detail. Setting the filter to 0 disables smoothing entirely.
Peak detection — After filtering, the indicator scans the smoothed distribution for local maxima. Each peak represents a price zone where pivot density is significantly higher than its neighbors — these are the final support and resistance levels. Levels below the current close are classified as support (green), levels above as resistance (red).
Features
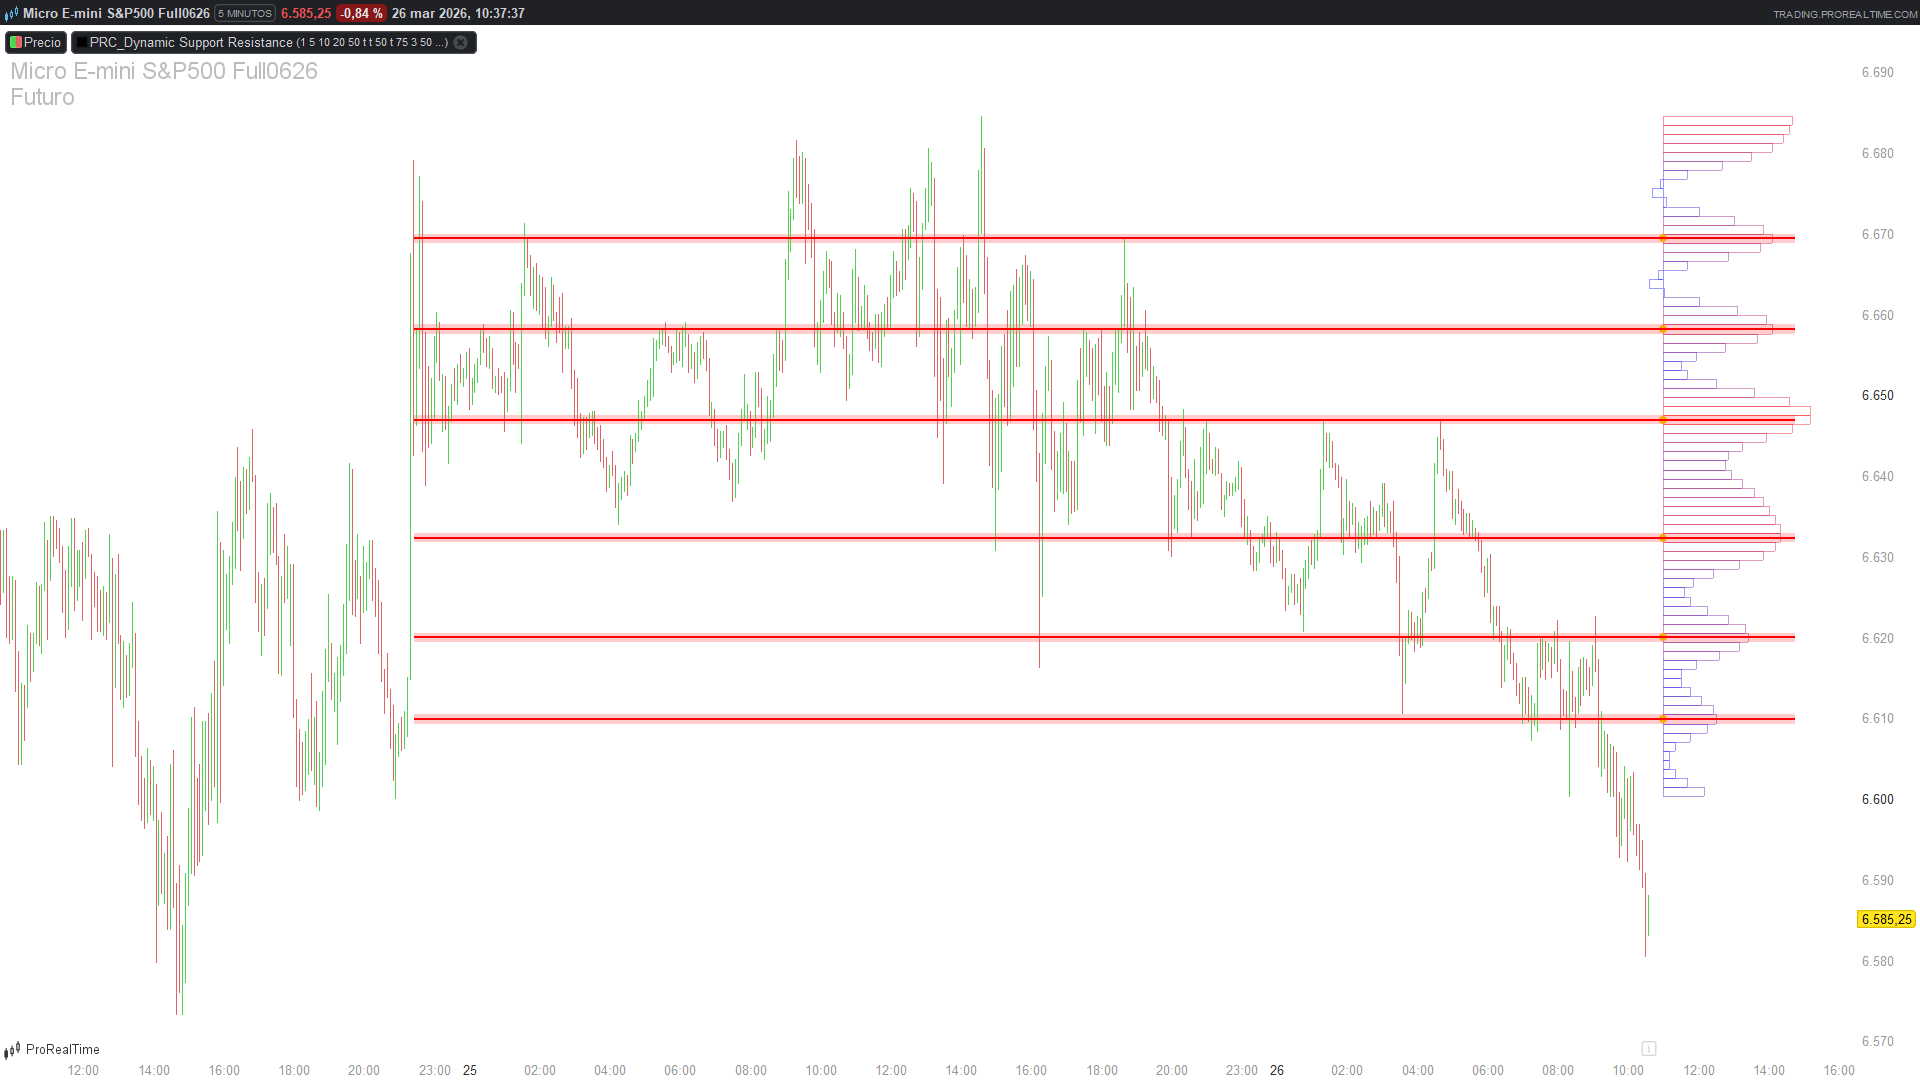
Projected histogram — A color-coded histogram is drawn to the right of the last bar, showing the full filtered distribution. Bar length represents relative pivot density at each price level, with color transitioning from blue (low density) to red (high density). This gives an immediate visual map of where the market’s structural memory is concentrated.
S/R lines and zones — Each detected peak generates a horizontal line extending from the earliest stored pivot to beyond the current bar. When zone display is enabled, a shaded rectangle spans the full width of the corresponding bin, providing a visual representation of the level’s price range rather than just a single line. Color dynamically updates based on whether the current close is above (support = green) or below (resistance = red) each level.
Bounce detection — The indicator scans the last N bars (configurable via hitLookback) for price interactions with each S/R level. A bullish bounce is identified when the level sits below the open, price crosses through it, and the bar closes bullish above the level. Bearish bounces follow the inverse logic. Each confirmed bounce is marked with a colored dot offset from the bar’s extreme by half the ATR, making them easy to spot without cluttering the price action.
Full customization — Every visual element can be toggled independently. Support and resistance colors are fully configurable via RGB inputs. Zone transparency, histogram scale, and the number of distribution bins can all be fine-tuned to match different instruments and timeframes.
Parameters
- weightStyle — Weighting method for pivots. 1 = Linear (equal weight), 2 = Time (recent pivots weighted higher), 3 = Volume (weighted by volume at reversal).
- length1 / length2 / length3 / length4 — Lookback periods for the four independent pivot detectors. Default values of 5, 10, 20, and 50 provide a good balance between short-term reaction levels and long-term structure.
- pivotLookback — Maximum number of pivots stored per type (highs and lows). Higher values incorporate more history but may dilute recent levels. Default: 50.
- precision — Number of bins used to divide the price range. Higher values produce finer granularity in the distribution. Default: 75.
- filter — Sinc filter strength. Higher values smooth more aggressively, producing fewer dominant levels. Set to 0 to disable filtering. Default: 3.
- scale — Controls how far to the right the histogram and S/R lines extend beyond the current bar. Default: 50.
- showHisto / showLines / showZone / showHits — Toggle switches (1/0) for each visual component.
- zoneAlpha — Transparency of the S/R zone rectangles, from 0 (invisible) to 100 (opaque). Default: 50.
- hitLookback — Number of bars to scan for bounce detection. Default: 200.
- supportColorR/G/B and resistanceColorR/G/B — RGB color values for support and resistance elements.
Code
//---------------------------------------------------------------------//
//PRC_Dynamic Support Resistance
//version = 0
//11.06.2025
//Iván González @ www.prorealcode.com
//Sharing ProRealTime knowledge
//---------------------------------------------------------------------//
DEFPARAM DrawOnLastBarOnly = true
// =====================================================================
// === INPUTS (Configuración del Usuario) ===
// =====================================================================
// -- Estilo de Ponderación: 1=""Linear"", 2=""Time"", 3=""Volume"" --
weightStyle = 1
// -- Longitudes para la detección de Pivotes --
length1 = 5
length2 = 10
length3 = 20
length4 = 50
// -- Incluir Pivotes Altos y Bajos: 1 = sí, 0 = no --
includePH = 1
includePL = 1
// -- Límite de Pivotes a Almacenar --
pivotLookback = 50
// -- Configuración de la Distribución y Filtro --
precision = 75 // Número de ""contenedores"" para dividir el rango de precios
filter = 3    // Fuerza del filtro de suavizado. 0 para desactivar.
scale = 50     // Escala visual para el dibujo de objetos en el futuro
showHisto = 1
// -- Configuración de Visualización --
showLines = 1      // Mostrar líneas de S/R
showZone = 1       // Mostrar zonas de S/R
zoneAlpha = 50     // Transparencia de la zona (0-100)
showHits = 1       // Mostrar rebotes en los niveles
hitLookback = 200  // Cuántas velas hacia atrás buscar rebotes
// -- Colores de Soporte (Verde) --
supportColorR = 0
supportColorG = 255
supportColorB = 0
// -- Colores de Resistencia (Rojo) --
resistanceColorR = 255
resistanceColorG = 0
resistanceColorB = 0
// =====================================================================
// === INICIALIZACIÓN DE ARRAYS Y VARIABLES ===
// =====================================================================
ONCE phIndex = 0
ONCE plIndex = 0
ONCE $phPrice[0] = -1
ONCE $phWeight[0] = -1
ONCE $phIdx[0] = -1
ONCE $plPrice[0] = -1
ONCE $plWeight[0] = -1
ONCE $plIdx[0] = -1
PI = 3.14159
// Pre-calculamos el ATR para usarlo en el dibujo de los rebotes
atr = AverageTrueRange[14](close)
// =====================================================================
// === PASO 1: DETECCIÓN Y ALMACENAMIENTO DE PIVOTES ===
// =====================================================================
// --- Pivotes de Longitud 1 ---
isHigh1 = high[length1] > highest[length1](high)[length1+1] AND high[length1] >= highest[length1](high)
isLow1 = low[length1] < lowest[length1](low)[length1+1] AND low[length1] <= lowest[length1](low)

IF isHigh1 AND includePH THEN
   IF weightStyle = 1 THEN
      w = 1
   ELSIF weightStyle = 2 THEN
      w = barindex - length1
   ELSIF weightStyle = 3 THEN
      w = volume[length1]
   ENDIF

   $phPrice[phIndex] = high[length1]
   $phWeight[phIndex] = w
   $phIdx[phIndex] = barindex[length1]
   phIndex = phIndex + 1
ENDIF

IF isLow1 AND includePL THEN
   IF weightStyle = 1 THEN
      w = 1
   ELSIF weightStyle = 2 THEN
      w = barindex - length1
   ELSIF weightStyle = 3 THEN
      w = volume[length1]
   ENDIF

   $plPrice[plIndex] = low[length1]
   $plWeight[plIndex] = w
   $plIdx[plIndex] = barindex[length1]
   plIndex = plIndex + 1
ENDIF

// --- Pivotes de Longitud 2 ---
isHigh2 = high[length2] > highest[length2](high)[length2+1] AND high[length2] >= highest[length2](high)
isLow2 = low[length2] < lowest[length2](low)[length2+1] AND low[length2] <= lowest[length2](low)

IF isHigh2 AND includePH THEN
   IF weightStyle = 1 THEN
      w = 1
   ELSIF weightStyle = 2 THEN
      w = barindex - length2
   ELSIF weightStyle = 3 THEN
      w = volume[length2]
   ENDIF

   $phPrice[phIndex] = high[length2]
   $phWeight[phIndex] = w
   $phIdx[phIndex] = barindex[length2]
   phIndex = phIndex + 1
ENDIF

IF isLow2 AND includePL THEN
   IF weightStyle = 1 THEN
      w = 1
   ELSIF weightStyle = 2 THEN
      w = barindex - length2
   ELSIF weightStyle = 3 THEN
      w = volume[length2]
   ENDIF

   $plPrice[plIndex] = low[length2]
   $plWeight[plIndex] = w
   $plIdx[plIndex] = barindex[length2]
   plIndex = plIndex + 1
ENDIF

// --- Pivotes de Longitud 3 ---
isHigh3 = high[length3] > highest[length3](high)[length3+1] AND high[length3] >= highest[length3](high)
isLow3 = low[length3] < lowest[length3](low)[length3+1] AND low[length3] <= lowest[length3](low)

IF isHigh3 AND includePH THEN
   IF weightStyle = 1 THEN
      w = 1
   ELSIF weightStyle = 2 THEN
      w = barindex - length3
   ELSIF weightStyle = 3 THEN
      w = volume[length3]
   ENDIF

   $phPrice[phIndex] = high[length3]
   $phWeight[phIndex] = w
   $phIdx[phIndex] = barindex[length3]
   phIndex = phIndex + 1
ENDIF

IF isLow3 AND includePL THEN
   IF weightStyle = 1 THEN
      w = 1
   ELSIF weightStyle = 2 THEN
      w = barindex - length3
   ELSIF weightStyle = 3 THEN
      w = volume[length3]
   ENDIF

   $plPrice[plIndex] = low[length3]
   $plWeight[plIndex] = w
   $plIdx[plIndex] = barindex[length3]
   plIndex = plIndex + 1
ENDIF

// --- Pivotes de Longitud 4 ---
isHigh4 = high[length4] > highest[length4](high)[length4+1] AND high[length4] >= highest[length4](high)
isLow4 = low[length4] < lowest[length4](low)[length4+1] AND low[length4] <= lowest[length4](low)

IF isHigh4 AND includePH THEN
   IF weightStyle = 1 THEN
      w = 1
   ELSIF weightStyle = 2 THEN
      w = barindex - length4
   ELSIF weightStyle = 3 THEN
      w = volume[length4]
   ENDIF

   $phPrice[phIndex] = high[length4]
   $phWeight[phIndex] = w
   $phIdx[phIndex] = barindex[length4]
   phIndex = phIndex + 1
ENDIF

IF isLow4 AND includePL THEN

   IF weightStyle = 1 THEN
      w = 1
   ELSIF weightStyle = 2 THEN
      w = barindex - length4
   ELSIF weightStyle = 3 THEN
      w = volume[length4]
   ENDIF

   $plPrice[plIndex] = low[length4]
   $plWeight[plIndex] = w
   $plIdx[plIndex] = barindex[length4]
   plIndex = plIndex + 1
ENDIF

// --- Gestión del tamaño de los arrays ---

IF phIndex >= pivotLookback THEN

   FOR i = 0 TO phIndex - 2 DO
      $phPrice[i] = $phPrice[i+1]
      $phWeight[i] = $phWeight[i+1]
      $phIdx[i] = $phIdx[i+1]
   NEXT

   phIndex = phIndex - 1

ENDIF

IF plIndex >= pivotLookback THEN

   FOR i = 0 TO plIndex - 2 DO
      $plPrice[i] = $plPrice[i+1]
      $plWeight[i] = $plWeight[i+1]
      $plIdx[i] = $plIdx[i+1]
   NEXT

   plIndex = plIndex - 1

ENDIF

// =====================================================================
// === INICIO DEL BLOQUE DE CÁLCULO Y DIBUJO EN LA ÚLTIMA VELA ===
// =====================================================================

IF ISLASTBARUPDATE THEN

   // --- PASO 2: CONSTRUIR LA DISTRIBUCIÓN ---
   // 1. Calcular rango de precios
   IF phIndex > 0 THEN
      maxRange = $phPrice[0]
   ELSE
      maxRange = high
   ENDIF

   IF plIndex > 0 THEN
      minRange = $plPrice[0]
   ELSE
      minRange = low
   ENDIF

   FOR i = 1 TO phIndex - 1 DO
      IF $phPrice[i] > maxRange THEN
         maxRange = $phPrice[i]
      ENDIF
   NEXT

   FOR i = 0 TO plIndex - 1 DO
      IF $plPrice[i] > maxRange THEN
         maxRange = $plPrice[i]
      ENDIF
   NEXT

   FOR i = 0 TO phIndex - 1 DO
      IF $phPrice[i] < minRange THEN
         minRange = $phPrice[i]
      ENDIF
   NEXT

   FOR i = 1 TO plIndex - 1 DO
      IF $plPrice[i] < minRange THEN
         minRange = $plPrice[i]
      ENDIF
   NEXT

   // 2. Definir tamaño de Bins
   IF maxRange > minRange THEN
      binSize = (maxRange - minRange) / precision
   ELSE
      binSize = 0
   ENDIF

   // 3. Construir la Puntuación ($scores)
   UnSet($scores)

   FOR i = 0 TO precision - 1 DO
      $scores[i] = 0
   NEXT

   IF binSize > 0 THEN
      IF includePH THEN
         FOR i = 0 TO phIndex - 1 DO
            pivotPrice = $phPrice[i]
            pivotWeight = $phWeight[i]
            idx = MIN(FLOOR((pivotPrice - minRange) / binSize), precision - 1)
            IF idx >= 0 THEN
               $scores[idx] = $scores[idx] + pivotWeight
            ENDIF
         NEXT
      ENDIF

      IF includePL THEN
         FOR i = 0 TO plIndex - 1 DO
            pivotPrice = $plPrice[i]
            pivotWeight = $plWeight[i]
            idx = MIN(FLOOR((pivotPrice - minRange) / binSize), precision - 1)
            IF idx >= 0 THEN
               $scores[idx] = $scores[idx] + pivotWeight
            ENDIF
         NEXT
      ENDIF
   ENDIF

   // --- PASO 3: FILTRO SINC Y DETECCIÓN DE PICOS ---
   // 4. Aplicar Filtro Sinc
   UnSet($filteredScores)

   IF filter > 0 AND binSize > 0 THEN
      FOR i = 0 TO precision - 1 DO
         sum = 0
         sumw = 0
         FOR j = 0 TO precision - 1 DO
            diff = i - j
            IF diff = 0 THEN
               weight = 1
            ELSE
               angle = (PI * diff / (filter + 1)) * 180 / PI
               weight = SIN(angle) / (PI * diff / (filter + 1))
            ENDIF
            sum = sum + $scores[j] * weight
            sumw = sumw + weight
         NEXT

         IF sumw <> 0 THEN
            $filteredScores[i] = sum / sumw
         ELSE
            $filteredScores[i] = 0
         ENDIF
      NEXT
   ELSE
      FOR i = 0 TO precision - 1 DO
         $filteredScores[i] = $scores[i]
      NEXT
   ENDIF

   // 5. Detección de Picos
   UnSet($peakIdx)

   peakCount = 0
   FOR i = 1 TO precision - 2 DO
      isPeak = ($filteredScores[i] > $filteredScores[i-1]) AND ($filteredScores[i] > $filteredScores[i+1])
      IF isPeak THEN
         $peakIdx[peakCount] = i
         peakCount = peakCount + 1
      ENDIF
   NEXT

   // Encontramos la puntuación máxima para escalar el histograma
   maxFilteredScore = 0

   FOR i = 0 TO precision - 1 DO
      IF $filteredScores[i] > maxFilteredScore THEN
         maxFilteredScore = $filteredScores[i]
      ENDIF
   NEXT

   // Posición inicial del histograma en el eje X
   startHisto = barindex + 5

   // Dibujamos cada barra del histograma FILTRADO
   IF maxFilteredScore > 0 and showHisto THEN
      FOR i = 0 TO precision - 1 DO
         binTop = minRange + binSize * (i + 1)
         binBottom = minRange + binSize * i
         score = $filteredScores[i]
         barLength = (score / maxFilteredScore) * scale
         // Color basado en la puntuación
         r = (score / maxFilteredScore) * 255
         g = 0
         b = 255 - r
         DRAWRECTANGLE(startHisto, binTop, startHisto + barLength, binBottom) coloured(r,g,b, 100)
      NEXT
   ENDIF

   // --- PASO 4: VISUALIZACIÓN FINAL ---
   IF binSize > 0 THEN
      FOR i = 0 TO peakCount - 1 DO
         idx = $peakIdx[i]
         binTop = minRange + binSize * (idx + 1)
         binBottom = minRange + binSize * idx
         level = (binTop + binBottom) / 2
         // Dibujamos un punto en el nivel del pico
         DRAWPOINT(startHisto, level,2) coloured("orange")

         IF close > level THEN
            r = supportColorR
            g = supportColorG
            b = supportColorB
         ELSE
            r = resistanceColorR
            g = resistanceColorG
            b = resistanceColorB
         ENDIF

         if includePH and includePL then
            startIdx=min($phIdx[0],$plIdx[0])
         elsif includePH then
            startIdx=$phIdx[0]
         elsif includePL then
            startIdx=$plIdx[0]
         else
            startIdx=0
         endif
         IF showLines THEN
            DRAWSEGMENT(startIdx, level, barindex + scale, level) coloured(r,g,b) style(line, 2)
         ENDIF

         IF showZone THEN
            DRAWRECTANGLE(startIdx, binTop, barindex + scale, binBottom) coloured(r,g,b,0)fillcolor(r,g,b,zoneAlpha)
         ENDIF

         IF showHits THEN
            FOR j = 0 TO hitLookback - 1 DO
               IF level <= high[j] AND level >= low[j] THEN
                  isBullBounce = (level < open[j]) AND (close[j] > level) AND (close[j] > open[j])
                  IF isBullBounce THEN
                     drawpoint(barindex[j], low[j] - atr/2, 2) coloured(supportColorR, supportColorG, supportColorB, 255)
                  ENDIF

                  isBearBounce = (level > open[j]) AND (close[j] < level) AND (close[j] < open[j])

                  IF isBearBounce THEN
                     drawpoint(barindex[j], high[j] + atr/2, 2) coloured(resistanceColorR, resistanceColorG, resistanceColorB, 255)
                  ENDIF
               ENDIF
            NEXT
         ENDIF
      NEXT
   ENDIF
ENDIF

RETURN
