

ZigZag Cumulative Volume
February 17, 2017, 5:08 PM
Indicators
27 Comments
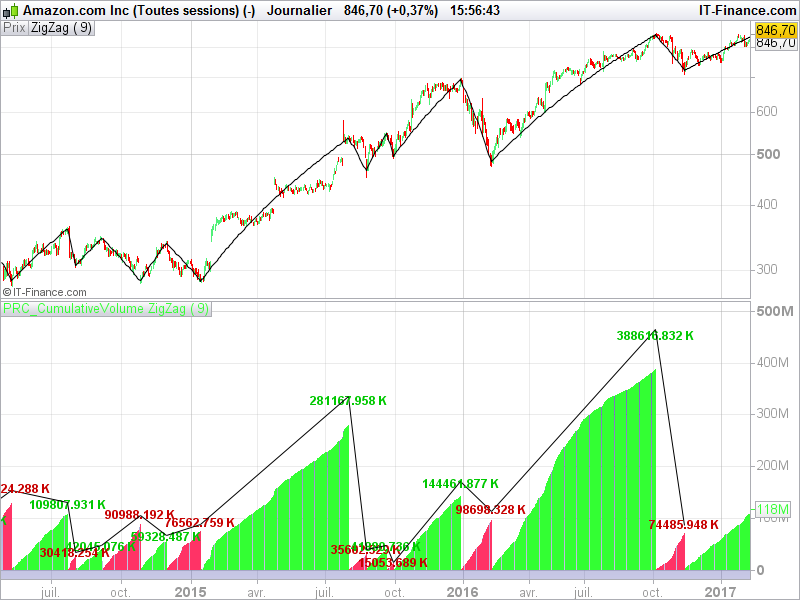
The theory is based on R Wyckoff works and refined by D Weis. In the nutshell cumulative volume helps to asses the strength of the ZigZag section which is difficult to measure if you looking at the individual volume bars only.
This indicator has been coded from a request on the english support forum:
https://www.prorealcode.com/topic/zigzag-with-cumulative-volume/
The indicator is based on percent variation ZigZag, the new peak or tough are triggered by a new price variation of X percent you can change with the “percentVariation” parameter in the indicator window.
I hope it will be helpful for people interested in Wave Weis analysis.
//PRC_CumulativeVolume ZigZag | indicator
//17.02.2017
//Nicolas @ www.prorealcode.com
//Sharing ProRealTime knowledge

// --- parameters
// percentVariation = 9

zz = ZigZag[percentVariation](close)

peak = zz<zz[1] and zz[1]>zz[2]
tough = zz>zz[1] and zz[1]<zz[2]

cumV = cumV+volume

if peak then
 text = cumV/1000
 drawtext("#text#K",barindex[1],cumV[1]+0.17*cumV[1],Dialog,Bold,12) coloured(0,200,0)
 drawsegment(barindex[1],cumV[1]+0.20*cumV[1],previousX,previousY)
 cumV = Volume
 color = -1
 previousX = barindex[1]
 previousY = cumV[1]+0.20*cumV[1]
elsif tough then
 text = cumV/1000
 drawtext("#text#K",barindex[1],cumV[1]+0.23*cumV[1],Dialog,Bold,12) coloured(200,0,0)
 drawsegment(barindex[1],cumV[1]+0.20*cumV[1],previousX,previousY)
 cumV = Volume
 color = 1
 previousX = barindex[1]
 previousY = cumV[1]+0.20*cumV[1]
endif

return cumV coloured by color
Download
Filename:
PRC_CumulativeVolume-ZigZag.itf
Downloads:
745
Master
I created ProRealCode because I believe in the power of shared knowledge. I spend my time coding new tools and helping members solve complex problems.
If you are stuck on a code or need a fresh perspective on a strategy, I am always willing to help. Welcome to the community!
Author’s Profile
Loading...