

Williams Vix Fix
The Williams Vix Fix (WVF) is Larry Williams’ answer to a simple problem: the VIX is great at marking market bottoms — fear spikes when price panics — but most instruments don’t have a volatility index of their own. The Vix Fix rebuilds that “fear gauge” from price alone, so you can apply it to any stock, future or currency. This version keeps the classic bottom detector intact and adds a mirror mode for tops, plus an automatic mode that picks the right side for you.
How It Works
The core idea is to measure how far the current low has collapsed below the highest close of the recent window:
WVF = (highest(close, 22) - low) / highest(close, 22) * 100
When price panics into a low, this value spikes — exactly when capitulation bottoms tend to form. To know when a spike is significant, the WVF is wrapped in two reference layers:
- Bollinger Bands over the WVF itself (length 20, 2.0 standard deviations). The upper band marks a statistically high reading.
- A percentile range (highest(WVF, 50) * 0.85). This marks the top 15% of the WVF’s own recent range.
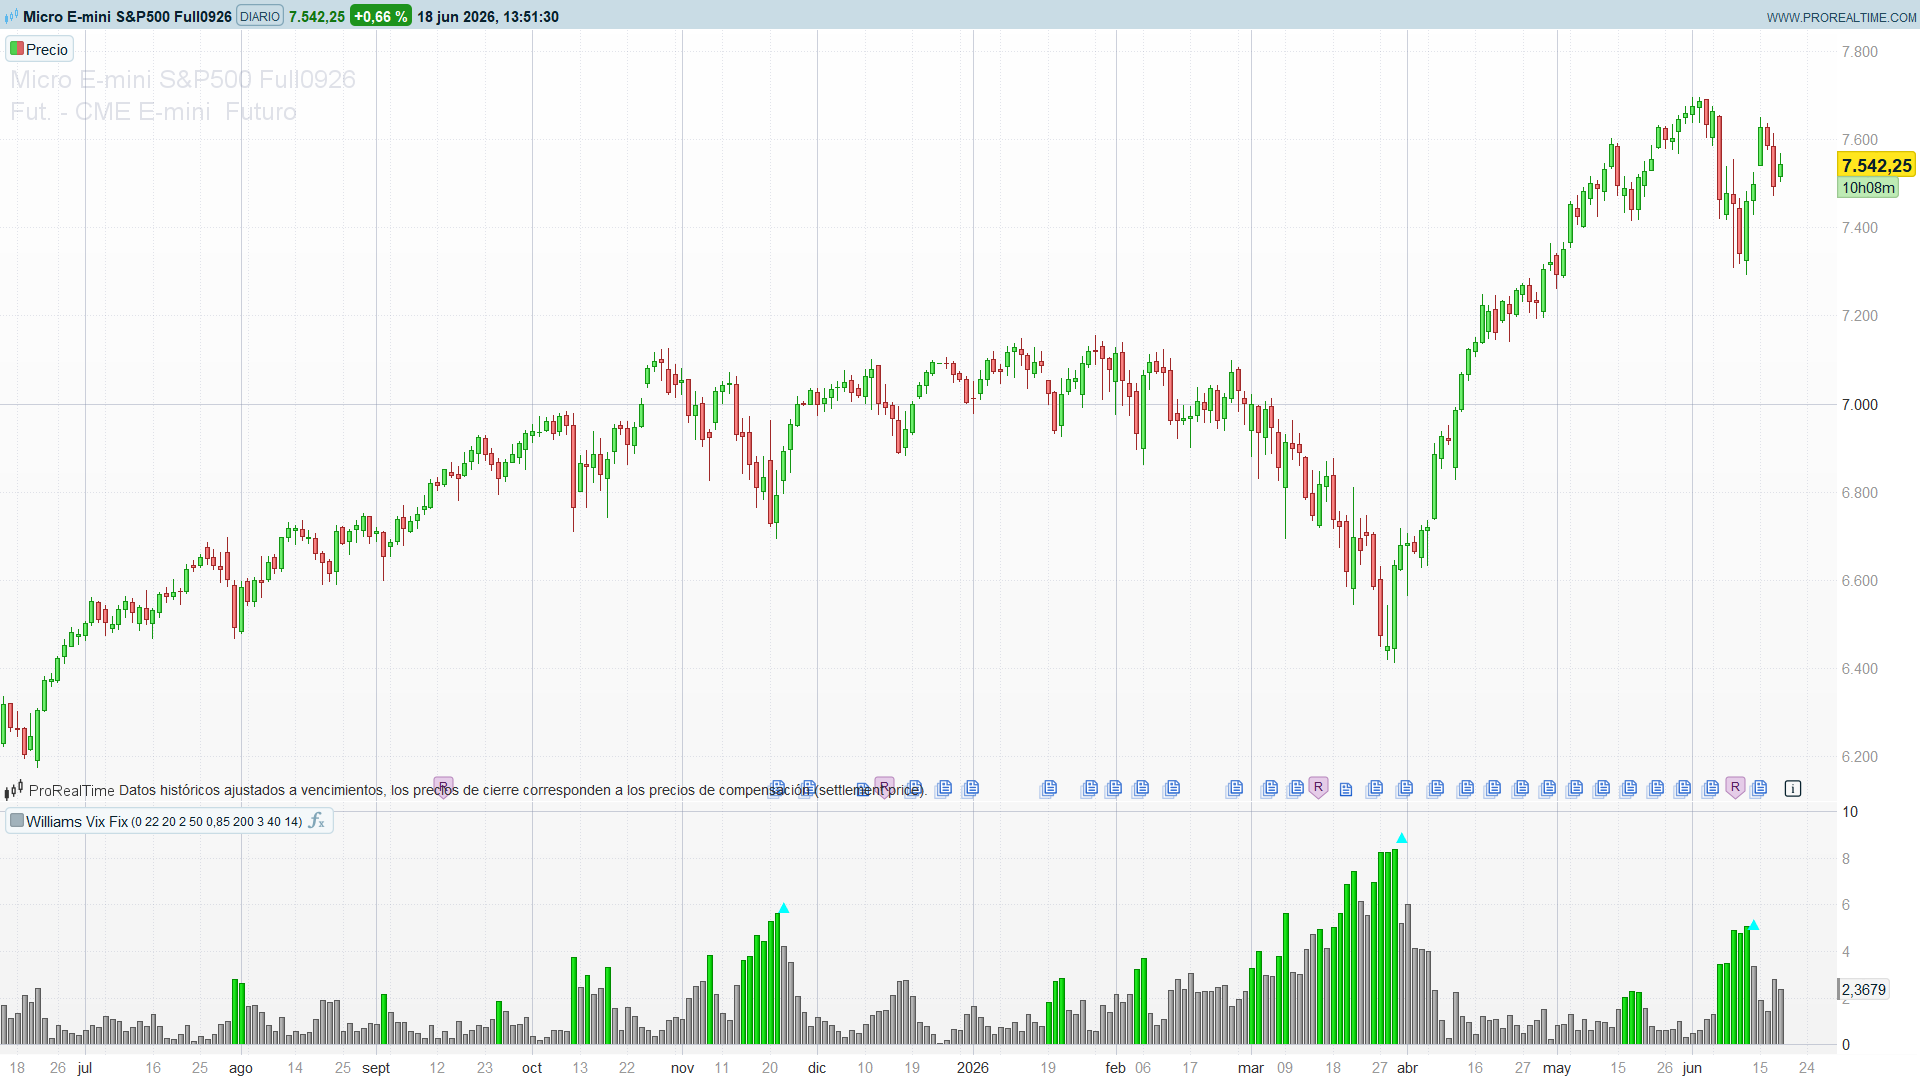
When the WVF pushes above the upper band or above the percentile line, the histogram bar lights up: volatility is at an extreme, and a bottom may be near.
Bottoms, Tops and Auto
This version exposes a single modo parameter:
- modo = 0 — Bottoms (Lows). The classic Williams Vix Fix. The histogram spikes on panic lows; extreme bars are coloured green.
- modo = 1 — Tops (Highs). The mirror: it measures how far the current high has stretched above the recent low, so it spikes on euphoric tops. Extreme bars are coloured red.
- modo = 2 — Auto. It compares price to a trend average (EMA 200): above the average it hunts bottoms (buy the dip in an uptrend); below it, it hunts tops.
A small implementation note: both the bottom and the top formulas are defined as positive values, so the same upper-band / percentile logic drives the signal in either direction — only the colour changes. That keeps the indicator simple and consistent across modes.
How to Read It
- Green spike above the band/percentile (Bottoms) — a volatility extreme consistent with a capitulation low. It is a context signal, not a blind buy: wait for price to confirm (e.g. the WVF rolling back down below the band, or a reversal bar).
- Red spike (Tops) — an exhaustion extreme to the upside, useful as a warning to tighten stops or fade strength.
- Band and percentile lines — they tell you how extreme the current reading is relative to the instrument’s own recent behaviour, which keeps the tool comparable across markets and timeframes.
Parameters
- modo (default 0) — 0 bottoms, 1 tops, 2 auto.
- pd (default 22) — Vix Fix lookback. The window for the highest/lowest close.
- bbl (default 20) — Bollinger length over the WVF.
- mult (default 2.0) — Bollinger standard-deviation multiplier.
- lb (default 50) — percentile lookback.
- ph (default 0.85) — percentile factor (top 15% of the WVF range).
- trendLen (default 200) — trend average length used only by the auto mode.
Code
//----------------------------------------------
//PRC_Williams Vix Fix [TheeHoganator]
//version = 1
//18.06.2026
//Ivan Gonzalez @ www.prorealcode.com
//Sharing ProRealTime knowledge
//----------------------------------------------
//-----Inputs-----------------------------------
//----------------------------------------------
modo = 0
pd = 22
bbl = 20
mult = 2.0
lb = 50
ph = 0.85
trendLen = 200
strBars = 3
ltLB = 40
mtLB = 14

bHighs = 0
if modo = 1 then
   bHighs = 1
elsif modo = 2 then
   src3 = (high + low + close) / 3
   trendMa = average[trendLen,1](src3)
   if src3 < trendMa then
      bHighs = 1
   endif
endif

if bHighs = 1 then
   wvf = (high - lowest[pd](close)) / lowest[pd](close) * 100
else
   wvf = (highest[pd](close) - low) / highest[pd](close) * 100
endif

sDev = mult * std[bbl](wvf)
midLine = average[bbl](wvf)
upperBand = midLine + sDev
rangeHigh = highest[lb](wvf) * ph

senal = wvf >= upperBand or wvf >= rangeHigh

if senal then
   if bHighs = 1 then
      r = 255
      g = 60
      b = 60
   else
      r = 0
      g = 200
      b = 0
   endif
else
   r = 150
   g = 150
   b = 150
endif

// === SEÑAL FILTRADA (los 3 criterios del original) ===
bFiltered = senal[1] and not senal

if bHighs = 1 then
   pa = high < high[1] and close < low[1] and close < close[strBars] and (close > close[ltLB] or close > close[mtLB])
else
   pa = low > low[1] and close > high[1] and close > close[strBars] and (close < close[ltLB] or close < close[mtLB])
endif

filtered = bFiltered and pa

if filtered then
   if bHighs = 1 then
      drawtext("▼", barindex, upperBand) coloured("orange")
   else
      drawtext("▲", barindex, upperBand) coloured("cyan")
   endif
endif

return wvf coloured(r,g,b) style(histogram) as "Williams Vix Fix"
