







Vostro - VST
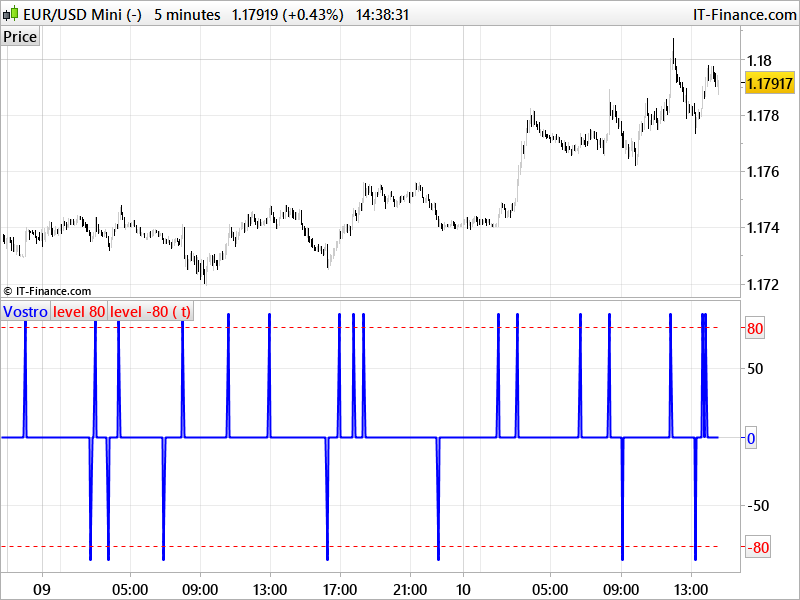
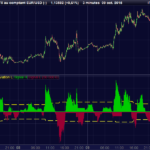
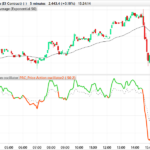
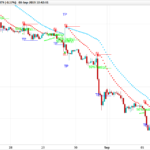
The VOSTRO indicator is a trend indicator that automatically provides buying and selling signals. The indicator marks in a window the potential turning points. The indicator is recommended for scalping.
The Vostro indicator determines the overbought zones (value greater than +80) and the oversold zones (less than the -80 level)
BUY signal: The Vostro curve moves below the -80 level and forms a trough – Turnaround of the upward trend
SELL signal: The Vostro curve moves above the +80 level and forms a peak – Downward trend
(description found on the web, conversion from MT4 code by a request in the english indicator section).
//PRC_Vostro VST | indicator
//10.10.2017
//Nicolas @ www.prorealcode.com
//Sharing ProRealTime knowledge
//converted from MT4 version

//--- settings
//scalping = 1 //1=true / 0=false
//--- end of settings

if scalping then
 period156=100
else
 period156=300
endif

if barindex>period156 then

 gd120=summation[5]((high+low)/2)
 gd128=gd120/5

 gd120=summation[5](high-low)
 gd136=0.2*(gd120/5)

 ibuf116=(low-gd128)/gd136
 ibuf112=(high-gd128)/gd136

 if(ibuf112>8.0 and high>average[period156,2](medianprice)) then
  ibuf108=90
 else
  if(ibuf116<-8.0 and low<average[period156,2](medianprice)) then
   ibuf108=-90
  else
   ibuf108=0
  endif
 endif

 if ibuf112>8 and ibuf112[1]>8 then
  ibuf108=0
 endif
 if ibuf112>8 and ibuf112[1]>8 and ibuf112[2]>8 then
  ibuf108=0
 endif
 if ibuf116<-8 and ibuf116[1]<-8 then
  ibuf108=0
 endif
 if ibuf116<-8 and ibuf116[1]<-8 and ibuf116[2]<-8 then
  ibuf108=0
 endif
endif

return ibuf108 coloured(0,0,255) style(line,2) as "Vostro", 80 coloured(255,0,0) style(dottedline,1) as "level 80", -80 coloured(255,0,0) style(dottedline,1) as "level -80"
Comments
You must be logged in to post a comment.

Il faut changer la dernière ligne du code par : return ibuf108 style(line,2) as "Vostro", 80 coloured(255,0,0) style(dottedline,1) as "level 80", -80 coloured(255,0,0) style(dottedline,1) as "level -80" et sélectionner soit même les couleurs désirées directement dans la fenêtre de paramétrage de l'indicateur pour hausse/baisse

Hello! I would like to test the indicator Balance of power! The Balance of Power indicator measures the market strength of buyers against sellers by assessing the ability of each side to drive prices to an extreme level. The calculation is: Balance of Power = (Close price – Open price) / (High price – Low price) I found this code in internet but it doesn´t work in Prorealtime so I need your help please! Thank you very much //@version=3 study("True Balance of power") per=input(30, title="periods for Emoline", type=integer, step=1, minval=4) trhi = max(high, close[1]) //true high trlo = min(low, close[1]) //true low trop = close[1] //true open bop = 100*(close-trop)/(trhi-trlo) //True Balance of Power as percent lin= 1.5*linreg(bop, per, 0) //linear regression as emoline bgcolor(lin0?green:orange, style=columns) //plot BOP as columns plot(lin, title="Emoline", color=rising(lin,2)?blue :black, linewidth=3) //plot emoline as line hline(0, linestyle=line) //zero level
Merci beaucoup Nicolas, c'est mieux ainsi ...