







Volume Supertrend AI
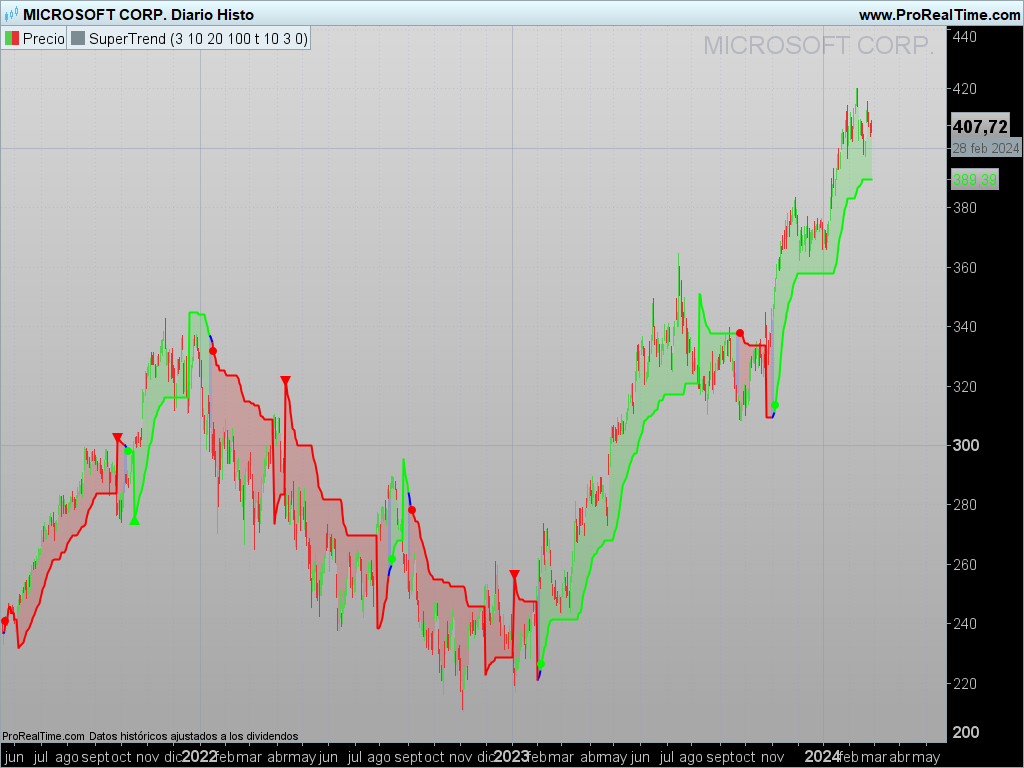
Overview of the Volume SuperTrend AI Indicator
The Volume SuperTrend AI Indicator is a cutting-edge technical tool designed for forecasting price movement trends by integrating traditional SuperTrend calculations with artificial intelligence techniques, notably the k-nearest neighbors (KNN) algorithm. Its purpose is to arm traders with a more accurate means of discerning market trends, combining volume-weighted moving averages (VWMA) and the KNN algorithm to deliver both bullish and bearish signals.
How It Works
– Volume Analysis:
Leveraging volume-weighted moving averages (VWMA), the Volume SuperTrend AI underscores the significance of trading volume in determining trend direction. This enables a more precise reaction to market dynamics.
– Artificial Intelligence Integration – k-Nearest Neighbors (k-NN) Algorithm:
The k-NN algorithm is utilized to intelligently assess historical data points by comparing current parameters with past data. The nearest neighbors are used to generate predictive modeling, thus adapting to complex market patterns.
Usage Guide
– Trend Identification:
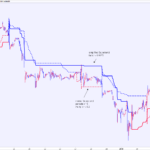
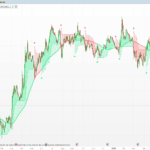
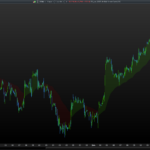
The indicator evaluates not just price movements but also trading volume, adding an additional layer to trend analysis. A green line below the price usually indicates an uptrend, reflecting bullish market sentiment, whereas a red line above the price denotes a downtrend, indicative of bearish conditions.
– Trend Continuation Signals:
The AI algorithm plays a critical role in determining the coloration of the Volume SuperTrend, facilitating trend prediction while retaining the fundamental attributes of the traditional SuperTrend.
– Dynamic Trailing Stop:
The Volume SuperTrend AI indicator acts as a dynamic trailing stop loss, adjusting to both price movement and trading volume. This method safeguards profits while allowing the trade to develop, incorporating volume for a more nuanced response to market shifts.
Settings
– AI Settings:
These include adjustments for the number of nearest neighbors to consider in the k-Nearest Neighbors (k-NN) algorithm and the amount of data points to analyze. These settings influence the model’s sensitivity to market fluctuations.
– AI Trend Settings:
This allows for the customization of the lengths of the weighted moving averages used for calculating both the price trend and the prediction trend. It includes options to enable or disable AI-generated trend signals.
– SuperTrend Settings:
These settings adjust the length of the SuperTrend and the factor, which is the multiplier for the Average True Range (ATR) in the SuperTrend calculation, as well as selecting the type of moving average for the SuperTrend calculation. This customization aligns with individual trading strategies and market conditions.
This comprehensive approach to market trend prediction merges traditional technical analysis with artificial intelligence innovations, offering traders a robust tool for decision-making in their trading activities.
//PRC_Volume SuperTrend AI
//version = 0
//29.02.24
//Iván González @ www.prorealcode.com
//Sharing ProRealTime knowledge
///////////////////////////////////////////////////////////////////////
//inputs
// ~~ Input settings for K and N values
k = 3 // Neighbors 1 to 100
m = 10 // Data
n = max(k,m)
//// ~~ Input settings for prediction values
KNNPriceLen = 20 // Price Trend 2 - 500 step 10
KNNSTlen = 100 // Prediction Trend 2 - 500 step 10
aisignals = 1 // Boolean AI Trend Signals
//// ~~ Define SuperTrend parameters
len = 10 // Length
factor = 3.0 // step 0.1
maSrc = 0 // MaType
// ~~ Calculate the SuperTrend based on the user's choice
vwma = average[len,maSrc](close*volume)/average[len,maSrc](volume)
atr = averagetruerange[len](close)

upperband = vwma + factor*atr
lowerband = vwma - factor*atr

if barindex < len then
upperband = close
lowerband = close
direction = 1
else
//Redefine upperband
if upperband < upperband[1] or close[1] > upperband[1] then
upperband = upperband
else
upperband = upperband[1]
endif
//Redefine lowerband
if lowerband > lowerband[1] or close[1] < lowerband[1] then
lowerdband = lowerband
else
lowerband = lowerband[1]
endif
//Define upperband
prevSupertrend = mysuperTrend[1]
if prevSupertrend = upperband[1] then
if close > upperband then
direction = -1
else
direction = 1
endif
else
if close < lowerband then
direction = 1
else
directon = -1
endif
endif
endif

if direction = -1 then
mysupertrend = lowerband
else
mysupertrend = upperband
endif
// ~~ Collect data points and their corresponding labels
myprice = WeightedAverage[KNNPriceLen](close)
sT = WeightedAverage[kNNSTlen](mysupertrend)

for i=0 to n-1 do
$data[i]=mysupertrend[i]
if myprice[i] > sT[i] then
$labels[i] = 1
else
$labels[i] = 0
endif
next

// ~~ Classify the current data point
currentsuperTrend = mysuperTrend
//label = knn_weighted(data, labels, k, current_superTrend)

// Compute distances from the current point to all other points
n1 = lastset($data)
for i = 0 to n1-1 do
$distances[i] = abs(currentsuperTrend[i]-$data[i])
$indices[i] = i
next
// Sort distances and corresponding indices in ascending order
// Bubble sort method
for i=0 to n1-2 do
for j=0 to n1-i-2 do
if $distances[j]>$distances[j+1] then
tempDist = $distances[j]
$distances[j]=$distances[j+1]
$distances[j+1]=tempDist
tempindex = $indices[j]
$indices[j]=$indices[j+1]
$indices[j+1]=tempindex
endif
next
next
// Compute weighted sum of labels of the k nearest neighbors
weightedsum=0
totalweight=0
for i=0 to k-1 do
myindex = $indices[i]
labeli = $labels[i]
weighti = 1 / ($distances[i]+pow(10,-6) )
weightedsum = weighti*labeli+weightedsum
totalweight = weighti+totalweight
next

label = floor(weightedsum / totalweight,2)

// ~~ Plot
if label = 1 then
r=0
g=250
b=0
elsif label = 0 then
r=250
g=0
b=0
else
r=0
g=0
b=250
endif

middleprice = (open+close)/2
colorbetween(middleprice,mysupertrend,r,g,b,40)

// ~~ Ai Super Trend Signals
starttrendup = label = 1 and label[1]<>1 and aisignals
starttrenddn = label = 0 and label[1]<>0 and aisignals
TrendUp = direction = -1 and direction[1] = 1 and label = 1 and aisignals
TrendDn = direction = 1 and direction[1] = -1 and label = 0 and aisignals

if starttrendup or starttrenddn then
drawpoint(barindex,currentsuperTrend,2)coloured(r,g,b)
elsif Trendup then
drawtext("▲",barindex,currentsuperTrend)coloured(r,g,b)
elsif Trenddn then
drawtext("▼",barindex,currentsuperTrend)coloured(r,g,b)
endif

return currentsuperTrend as "SuperTrend" coloured(r,g,b)style(line,2)
Comments
You must be logged in to post a comment.

Yes, I am sure it should work perfectly, but I found very strange vehavior like this one: If I set these lines right after the code: if g=250 then test=1 elsif r=250 then test=-1 else test=0 endif graph test and then there is non matching between the colors of the indicator and what the code gives. Would you see something similar? (sorry but I can't find how to attach a picture)
Dear Iván, I am trying to set this indicator in a trading system. However, I have some issue at the end of the first part, when your indicator evaluates ‘mysupertrend’ before collecting data points. If used as an indicator then it returns a proper ‘mysupertrend’ signal, but when used in a code then it does not give any value. What could be the reason for that? // ~~ Calculate the SuperTrend based on the user's choice vwma = average[len,maSrc](close*volume)/average[len,maSrc](volume) atr = averagetruerange[len](close) upperband = vwma + factor*atr lowerband = vwma - factor*atr if barindex < len then upperband = close lowerband = close direction = 1 else //Redefine upperband if upperband < upperband[1] or close[1] > upperband[1] then upperband = upperband else upperband = upperband[1] endif //Redefine lowerband if lowerband > lowerband[1] or close[1] < lowerband[1] then lowerdband = lowerband else lowerband = lowerband[1] endif //Define Supertrend prevSupertrend = mysuperTrend[1] if prevSupertrend = upperband[1] then if close > upperband then direction = -1 else direction = 1 endif else if close < lowerband then direction = 1 else direction = -1 endif endif endif if direction = -1 then mysupertrend = lowerband else mysupertrend = upperband endif
Hi. It works... just delete drawing lines and place buy and sell conditions. For example, if you want to enter long/short when the arrow appears: if Trendup then //drawtext("▲",barindex,currentsuperTrend)coloured(r,g,b) buy 1 contract at market elsif Trenddn then //drawtext("▼",barindex,currentsuperTrend)coloured(r,g,b) sellshort 1 contract at market endif graphonprice currentsuperTrend as "SuperTrend" coloured(r,g,b)

Many thanks Ivan, I copy/paste your code to try it but could only get a constant stable uniform value for the SuperTrend. Is anything missing in the code? I think the problem is coming from "vwma = average[len,maSrc](close*volume)/average[len,maSrc](volume)" What did you intend to write here? Also, what is the use of "myindex = $indices[i]"?

Dear Ivan, why, in line 86, there is "currentsuperTrend[i]" and not "currentsuperTrend" only?