

Machine Learning Adaptive SuperTrend
If you have been trading for a while, you likely know and love the classic SuperTrend indicator. It is a fantastic tool for riding trends and managing trailing stops. However, traditional SuperTrend relies on a raw ATR (Average True Range) calculation, which means it can sometimes lag or get easily triggered during sudden, erratic volatility spikes.
What if your SuperTrend could actually learn from the market’s recent behavior and adapt its sensitivity based on real-time volatility regimes?
Enter the Machine Learning Adaptive SuperTrend (originally inspired by AlgoAlpha). This custom indicator uses a Machine Learning algorithm known as K-Means Clustering to dynamically categorize market volatility, giving you a much smarter, context-aware trend-following tool.
How It Works: The Machine Learning Engine
Instead of blindly multiplying the current ATR by a fixed factor, this indicator looks back over a specific “Training Period” to analyze the market’s behavior. It uses the K-Means algorithm to group the recent volatility into three distinct regimes:
- Low Volatility
- Medium Volatility
- High Volatility
By continuously analyzing the distance between the current ATR and these three historical “clusters” (centroids), the indicator assigns the current market action to the most appropriate volatility regime. The SuperTrend bands are then calculated using the clustered ATR value rather than the raw, noisy ATR.
The Result?
- Fewer false signals during sudden, short-lived volatility spikes.
- Tighter stops when the market enters a consistent low-volatility grind.
- Wider breathing room when the market transitions into a genuine high-volatility environment.
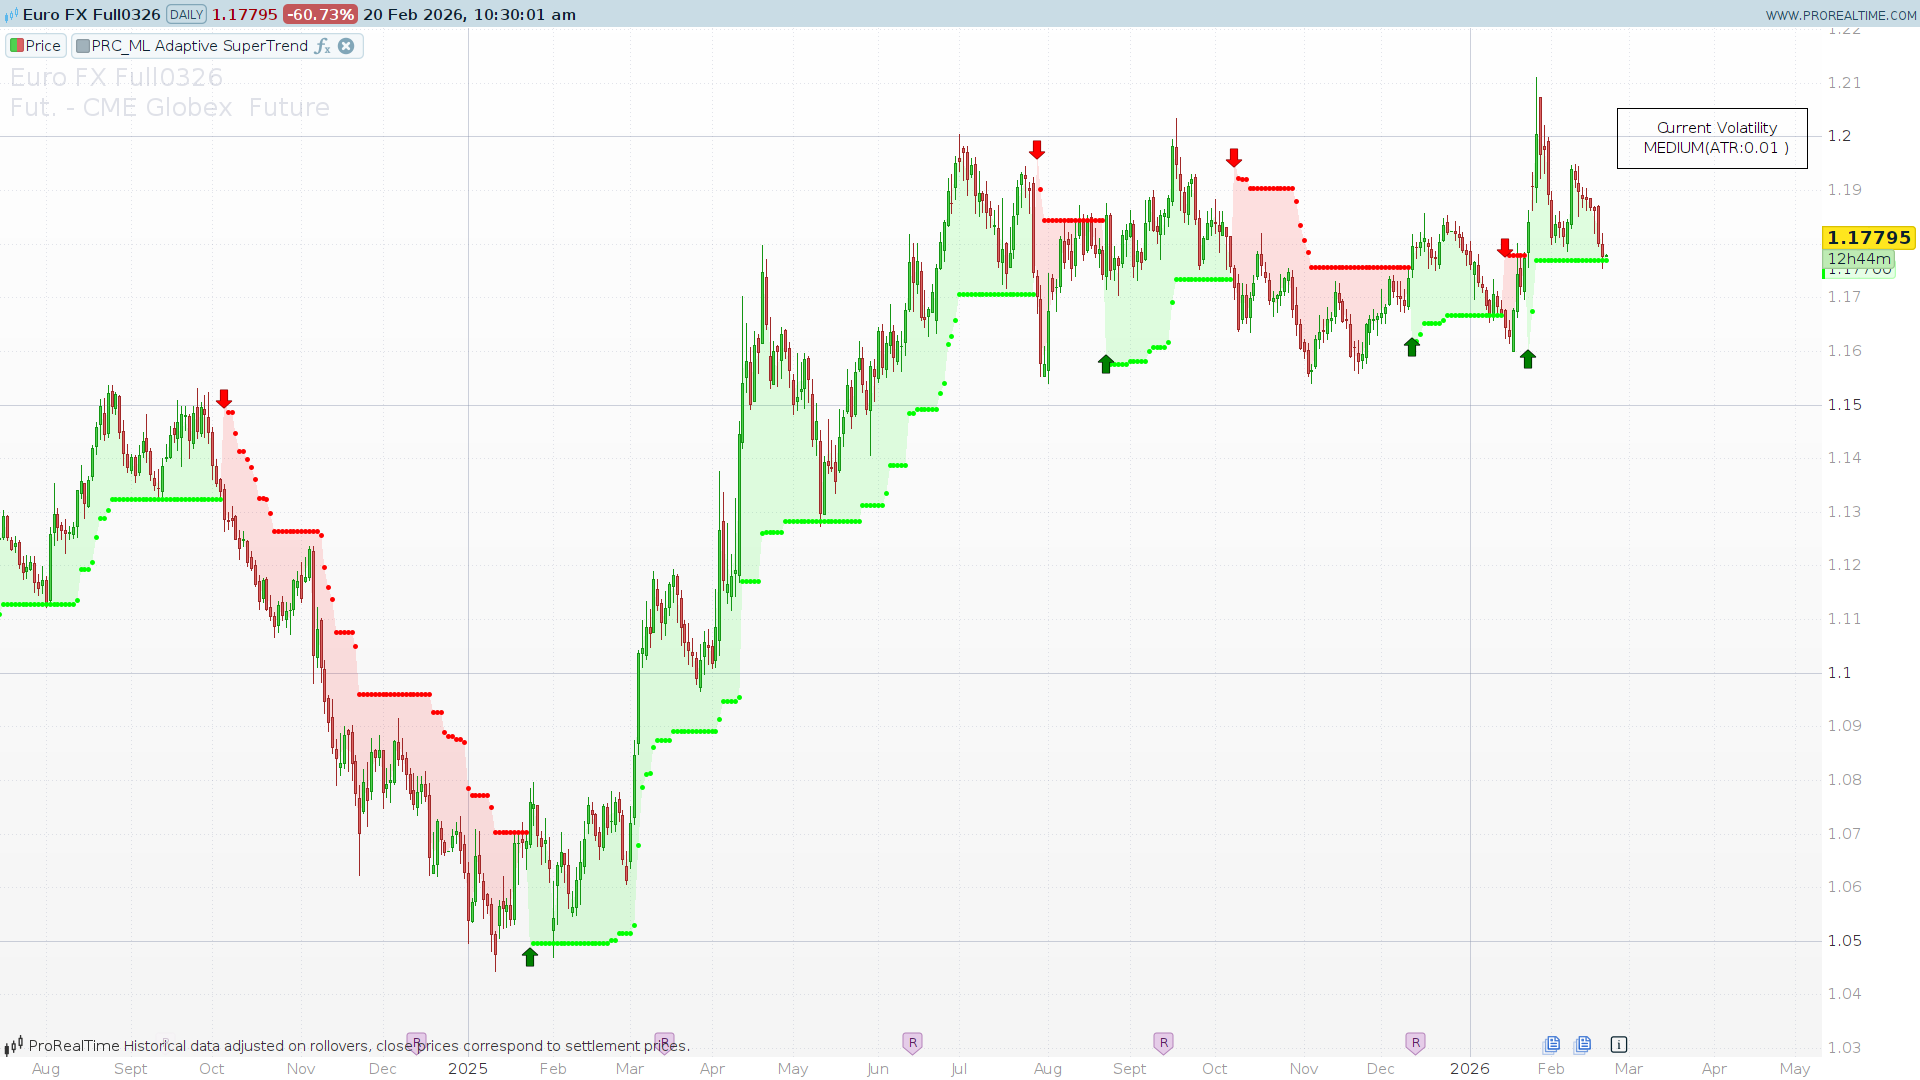
Visual Features on Your Chart
When you apply this indicator to your ProRealTime chart, you will get a comprehensive visual setup:
- Dynamic Colored Bands: The area between the price median and the SuperTrend level is shaded (Green for bullish, Red for bearish) to give you an immediate read on the trend direction.
- Entry Signals: Clean, clear Up and Down arrows appear precisely when the trend direction flips.
- Live Volatility Dashboard: A sleek text box in the top right corner of your chart constantly updates to show you the current Volatility Regime (HIGH, MEDIUM, or LOW) and the raw ATR value.
Configuration Guide (Inputs)
This indicator is highly customizable. You can tweak the engine to suit any timeframe or asset class (Forex, Indices, Stocks, Commodities) by adjusting the following variables in the code:
atrLen(Default: 10): The lookback period for the standard ATR calculation.fact(Default: 3.0): The SuperTrend multiplier. A higher number keeps you in trades longer but gives back more open profit; a lower number provides tighter stops but may get stopped out earlier.trainingPeriod(Default: 100): The amount of historical bars the Machine Learning algorithm uses to “train” itself and calculate the volatility clusters. Increase this for a longer-term memory of market conditions.highPct,midPct,lowPct: These are the starting percentiles for the K-Means algorithm initialization. You generally won’t need to change these, but they are available for advanced tweaking.maxIter&eps: Controls the K-Means loop limits to ensure the platform processes the code efficiently without freezing.
ProBuilder Code
//---------------------------------------------------------------//
// PRC_Machine Learning Adaptive SuperTrend (byAlgoAlpha)
// version = 0
// 26.08.2025
// Iván González @ www.prorealcode.com
// Sharing ProRealTime knowledge
//---------------------------------------------------------------//

//========================
// Inputs (configuración)
//========================
atrLen           = 10     // ATR Length (Pine: atr_len)
fact             = 3.0    // SuperTrend Factor (Pine: fact)
trainingPeriod   = 100    // Training Data Length (Pine: training_data_period)
highPct          = 0.75   // Percentil alto (Pine: highvol)
midPct           = 0.50   // Percentil medio (Pine: midvol)
lowPct           = 0.25   // Percentil bajo (Pine: lowvol)
maxIter          = 20     // Tope de iteraciones K-means para evitar bucles largos
eps              = 0.00001   // Umbral de convergencia

//========================
// Volatilidad (ATR)
//========================
atr = AverageTrueRange[atrLen](close)

// Rango de ATR en ventana de entrenamiento
upATR   = Highest[trainingPeriod](atr)
lowATR  = Lowest[trainingPeriod](atr)

// Inicialización de centroides por percentil (igual que Pine)
aMean = lowATR + (upATR - lowATR) * highPct
bMean = lowATR + (upATR - lowATR) * midPct
cMean = lowATR + (upATR - lowATR) * lowPct

//========================
// Estructuras para K-means
// (usamos la convención $arr[0] = contador)
//========================
$hv[0] = 0     // elementos cercanos a aMean (alta vol)
$mv[0] = 0     // elementos cercanos a bMean (media vol)
$lv[0] = 0     // elementos cercanos a cMean (baja vol)

//========================
// Bucle K-means
//========================
iter = 0
converged = 0

IF atr > 0 AND BarIndex >= trainingPeriod - 1 THEN

   // Para comparar convergencia guardamos anteriores
   prevA = aMean
   prevB = bMean
   prevC = cMean

   WHILE converged = 0 DO

      // Limpiar clusters
      UnSet($hv)
      UnSet($mv)
      UnSet($lv)
      $hv[0] = 0
      $mv[0] = 0
      $lv[0] = 0

      // Asignación de cada ATR de la ventana al centroide más cercano
      FOR i = 0 TO trainingPeriod - 1 DO
         v = atr[i]
         d1 = ABS(v - aMean)
         d2 = ABS(v - bMean)
         d3 = ABS(v - cMean)

         IF d1 <= d2 AND d1 <= d3 THEN
            $hv[$hv[0] + 1] = v
            $hv[0] = $hv[0] + 1
         ELSIF d2 <= d1 AND d2 <= d3 THEN
            $mv[$mv[0] + 1] = v
            $mv[0] = $mv[0] + 1
         ELSE
            $lv[$lv[0] + 1] = v
            $lv[0] = $lv[0] + 1
         ENDIF
      NEXT

      // Recalcular centroides (medias de cada cluster)
      // Si algún cluster queda vacío, mantenemos el valor previo para estabilidad
      IF $hv[0] > 0 THEN
         sumA = 0
         FOR j = 1 TO $hv[0] DO
            sumA = sumA + $hv[j]
         NEXT
         aNew = sumA / $hv[0]
      ELSE
         aNew = aMean
      ENDIF

      IF $mv[0] > 0 THEN
         sumB = 0
         FOR j = 1 TO $mv[0] DO
            sumB = sumB + $mv[j]
         NEXT
         bNew = sumB / $mv[0]
      ELSE
         bNew = bMean
      ENDIF

      IF $lv[0] > 0 THEN
         sumC = 0
         FOR j = 1 TO $lv[0] DO
            sumC = sumC + $lv[j]
         NEXT
         cNew = sumC / $lv[0]
      ELSE
         cNew = cMean
      ENDIF

      // Comprobación de convergencia (cambios muy pequeños)
      da = ABS(aNew - aMean)
      db = ABS(bNew - bMean)
      dc = ABS(cNew - cMean)

      aMean = aNew
      bMean = bNew
      cMean = cNew

      iter = iter + 1
      IF (da < eps AND db < eps AND dc < eps) OR iter >= maxIter THEN
         converged = 1
      ENDIF

   WEND

ENDIF

//========================
// Asignación del centroide actual
//========================
vdistA = ABS(atr - aMean)
vdistB = ABS(atr - bMean)
vdistC = ABS(atr - cMean)

cluster = 0   // 0=high, 1=medium, 2=low
assigned = aMean

IF vdistB < vdistA AND vdistB <= vdistC THEN
   cluster = 1
   assigned = bMean
ELSIF vdistC < vdistA AND vdistC < vdistB THEN
   cluster = 2
   assigned = cMean
ENDIF

//========================
// SuperTrend con ATR adaptativo
//========================
src = (high + low) / 2
up  = src + fact * assigned
dn  = src - fact * assigned

ONCE upperBand = up
ONCE lowerBand = dn
prevUpper = upperBand[1]
prevLower = lowerBand[1]

candUpper = up
candLower = dn

IF (candLower <= prevLower AND close[1] >= prevLower) THEN
   lowerBand = prevLower
ELSE
   lowerBand = candLower
ENDIF

IF (candUpper >= prevUpper AND close[1] <= prevUpper) THEN
   upperBand = prevUpper
ELSE
   upperBand = candUpper
ENDIF

// Dirección y SuperTrend
ONCE isuperTrend = src
prevST = isuperTrend[1]
IF BarIndex = 0 THEN
   dir = 1
ELSE
   IF prevST = prevUpper THEN
      // Si venimos de banda superior, cambio a bajista solo si close > upperBand
      IF close > upperBand THEN
         dir = -1
      ELSE
         dir = 1
      ENDIF
   ELSE
      // Si venimos de banda inferior, cambio a alcista solo si close < lowerBand
      IF close < lowerBand THEN
         dir = 1
      ELSE
         dir = -1
      ENDIF
   ENDIF
ENDIF

IF dir = -1 THEN
   isuperTrend = lowerBand
ELSE
   isuperTrend = upperBand
ENDIF

//========================
// Color dinámico
//========================
IF dir = 1 THEN
   r = 255
   g = 0
ELSE
   r = 0
   g = 255
ENDIF
colorbetween(isupertrend,src,r,g,0,30)

//========================
// Señales de entrada
//========================
if dir=1 and dir<>dir[1] then
   drawarrowdown(barindex,isupertrend)coloured("red")
elsif dir=-1 and dir<>dir[1] then
   drawarrowup(barindex,isupertrend)coloured("green")
endif

if islastbarupdate then
   atr1=round(atr,2)
   drawtext("Current Volatility",-200,-100)anchor(topright,xshift,yshift)
   if cluster=0 then
      drawtext("HIGH(ATR:#atr1#)",-200,-120)anchor(topright,xshift,yshift)
   elsif cluster=1 then
      drawtext("MEDIUM(ATR:#atr1#)",-200,-120)anchor(topright,xshift,yshift)
   elsif cluster=2 then
      drawtext("LOW(ATR:#atr1#)",-200,-120)anchor(topright,xshift,yshift)
   endif
   drawrectangle(-300,-80,-110,-140)anchor(topright,xshift,yshift)
endif
//========================
// Salida
//========================
RETURN isuperTrend STYLE(Point,2) COLOURED(r,g,0)
