Triangles Patterns Detection
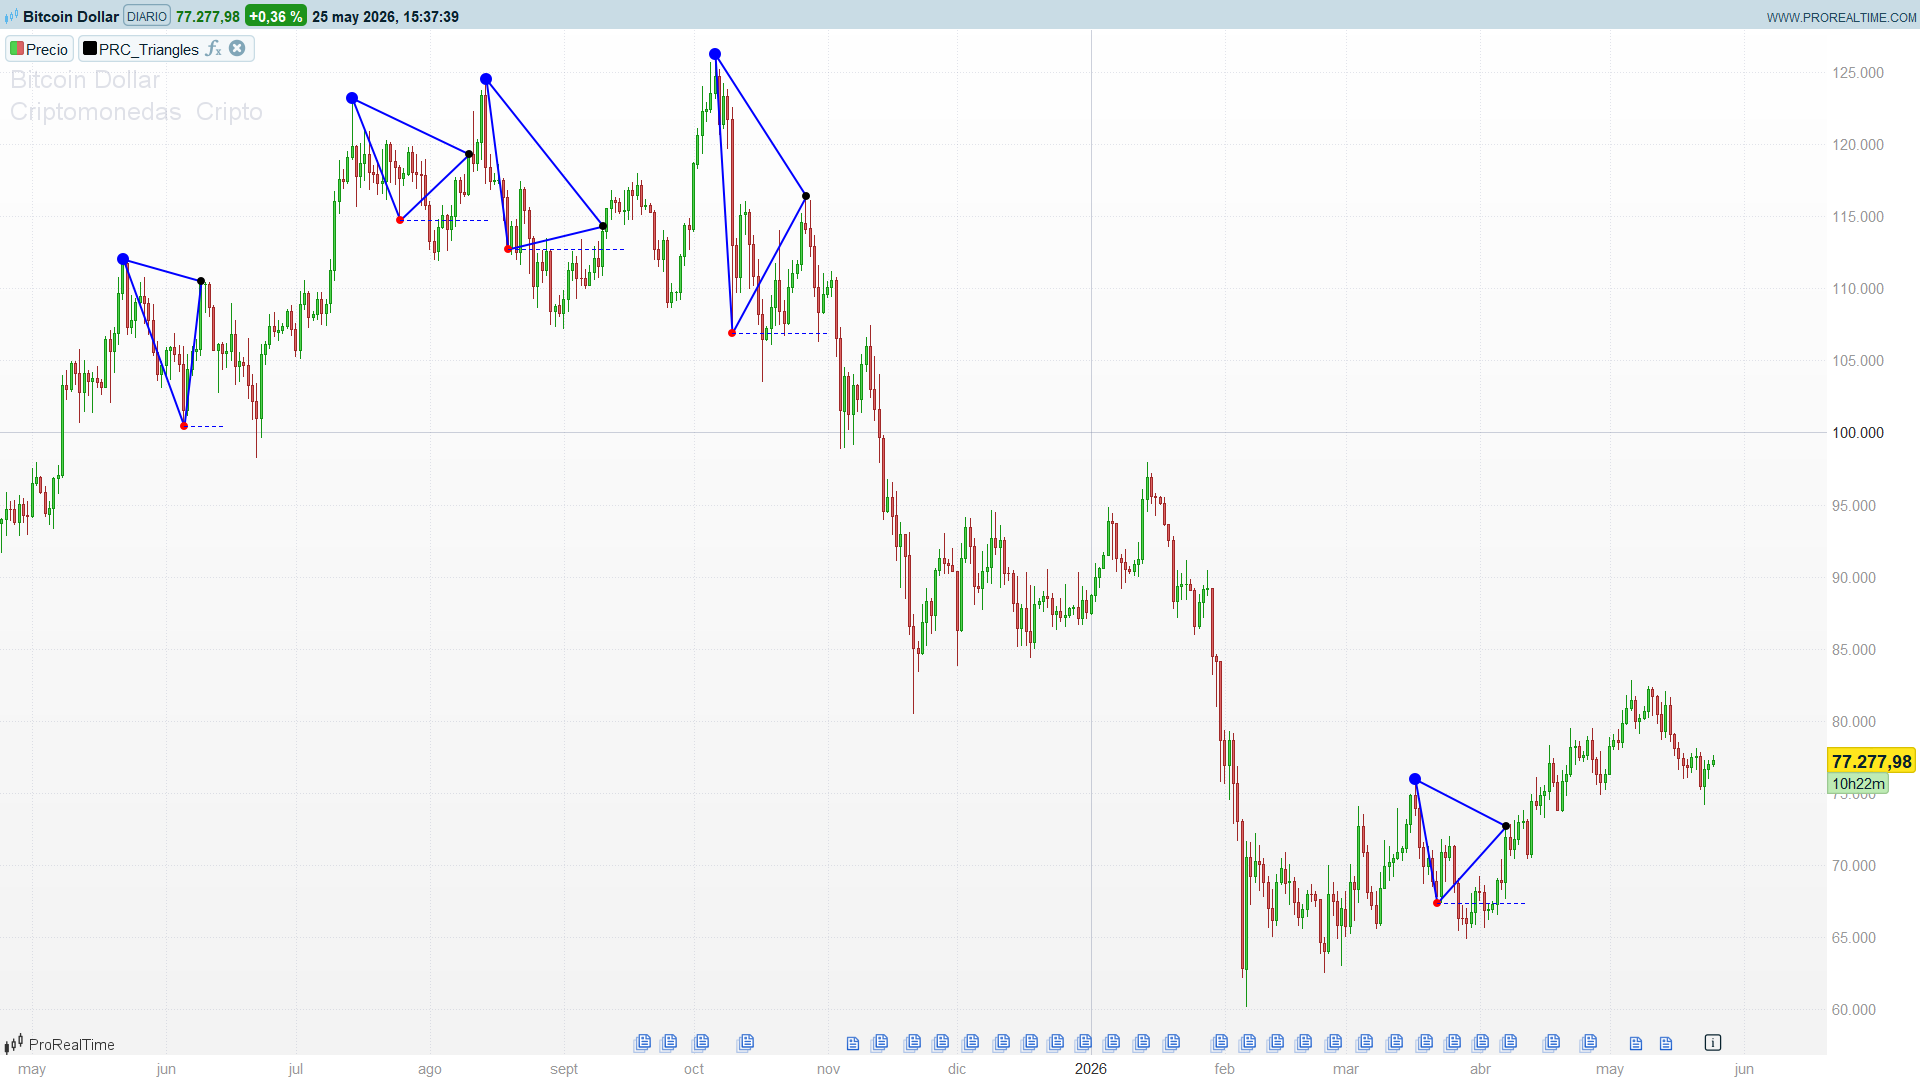
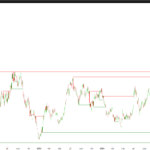
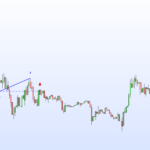
This indicator is an automatic detector of ascending triangles (flat top, rising lows) and descending triangles (flat bottom, falling highs). Every valid figure is drawn directly on the chart as a coloured triangle joining its three vertices, with a dotted projection line marking the level where the breakout is expected.
Theory Behind the Indicator
Two pivot scales
A triangle is, by definition, a figure with one structural extreme (the major pivot) and several intermediate extremes that converge towards it. The indicator captures this with two independent lookback windows:
- Period3 = 36 — the major scale. Detects the dominant low (for ascending triangles) or high (for descending triangles).
- Period1 = 13 — the minor scale. Detects the intermediate pivots that complete the figure.
On each bar, the script records every new pivot of each type into four parallel arrays — two for the major scale ($level3DN, $level3UP) and two for the minor scale ($level1DN, $level1UP) — together with their bar indices. Four counters (t3, z3, t1, z1) keep track of the last index filled in each array.
Pattern matching with double-nested loops
The actual triangle search runs only on islastbarupdate, which keeps the chart clean and the indicator fast even on thousands of bars.
For each major pivot the script walks the minor-pivot arrays with two nested for … next loops and a break on the first match. Each loop sets a semafor flag confirming that:
- Ascending triangle: the major low sits between two consecutive minor lows that are themselves above the major (rising support), while a matching minor high above the major low defines the flat resistance.
- Descending triangle: the major high sits between two consecutive minor highs that are below the major (falling resistance), with a matching minor low below the major high defining the flat support.
When both flags are set and the geometry is consistent (x3 < x2 and y3 > y2 for ascending; x3 < x2 and y3 < y2 for descending), the figure is drawn.
How to Read the Indicator
Each detected triangle is drawn as three connected segments plus three labelled vertices:
| Vertex | Meaning | Colour |
|---|---|---|
| Point 1 (V1) | Major pivot (apex of the converging side) | green (ascending) / blue (descending) |
| Point 2 (V2) | Intermediate pivot on the converging side | black |
| Point 3 (V3) | Intermediate pivot on the flat side | red |
A dotted projection line is drawn from V3, extending the flat side a few bars into the future. This is the level the trader watches for the breakout — a close beyond it is the canonical entry trigger.
The indicator is intentionally non-directional: it detects the figure but does not generate buy or sell signals. The user decides whether to fade the flat side (mean-reversion bias) or trade the breakout (continuation bias) according to context.
Indicator Configuration
| Parameter | Default | Description |
|---|---|---|
| `Period3` | 36 | Major lookback — defines the dominant pivot |
| `Period1` | 13 | Minor lookback — defines the intermediate pivots |
The 36 / 13 ratio (roughly 2.7:1). Increasing both proportionally produces fewer but larger figures; reducing Period1 alone makes the detector more sensitive to minor swings.
Implementation Notes
A few decisions worth flagging for anyone reading the source:
- No ZigZag buffer required — the MQ4 original feeds its pivot detection through iCustom calls into a separate ZigZag indicator. The PRT version detects pivots inline with low = lowest[Period3](low), which is enough for the use case and keeps everything in a single script.
- islastbarupdate for drawing — every triangle is searched and drawn only on the last update of the last bar, mirroring the chartist’s actual workflow (looking at the current state of the chart) and avoiding object accumulation across history.
- break inside for … next — once a minor pivot has been paired with a major one, the inner loop exits immediately. This matters when there are dozens of intermediate pivots: full O(n²) sweeps would visibly slow down the chart.
- Pivot detection without confirmation — the rule if low = lowest[Period3](low) then registers the pivot the same bar it occurs, without waiting for a lookahead confirmation. This is faithful to the MQ4 original and acceptable for a visual detector, but means that very recent pivots can be invalidated by subsequent lower lows. A stricter implementation would shift the pivot test by N/2 bars.
Code
//------------------------------------------
//PRC_Triangles
//version = 0
//17.06.24
//Iván González @ www.prorealcode.com
//Traducido de MQ4
//Sharing ProRealTime knowledge
//------------------------------------------
Period3=36
Period1=13
//------------------------------------------
lowestlow3=lowest[Period3](low)
highesthigh3=highest[Period3](high)

if low=lowestlow3 then
   $level3DN[t3+1]=Low
   $level3DNx[t3+1]=barindex
   t3=t3+1
endif
if high=highesthigh3 then
   $level3UP[z3+1]=high
   $level3UPx[z3+1]=barindex
   z3=z3+1
endif


lowestlow1=lowest[Period1](low)
highesthigh1=highest[Period1](high)

if low=lowestlow1 then
   $level1DN[t1+1]=Low
   $level1DNx[t1+1]=barindex
   t1=t1+1
endif
if high=highesthigh1 then
   $level1UP[z1+1]=high
   $level1UPx[z1+1]=barindex
   z1=z1+1
endif
//-------------------------------------------------//

if islastbarupdate then
   //----triangulo ascendente
   for i=t3 downto 0 do
      xx1=0
      yy1=0
      xx2=0
      yy2=0
      xx3=0
      yy3=0
      semafor1d=0
      semafor1u=0
      for j=t1 downto 0 do
         if $level3DNx[i]<$level1DNx[j] and $level3DNx[i]>=$level1DNx[max(0,j-1)] and $level3DN[i] < $level1DN[j] then
            semafor1d=1
            xx2=$level1DNx[j]
            yy2=$level1DN[j]
            break
         else
            semafor1d=0
         endif
      next
      for k=t1 downto 0 do
         if $level3DNx[i]<$level1UPx[k] and $level3DNx[i]>=$level1UPx[max(0,k-1)] and $level3UP[i]<$level1UP[k] then
            semafor1u=1
            xx1=$level3DNx[i]
            yy1=$level3DN[i]
            xx3=$level1UPx[k]
            yy3=$level1UP[k]
            break
         else
            semafor1u=0
         endif
      next
      if semafor1d and semafor1u and xx3<xx2 and yy3>yy2 and yy1<>0 then
         drawtriangle(xx1,yy1,xx2,yy2,xx3,yy3)coloured("purple")style(line,2)
         drawpoint(xx2,yy2,2)coloured("black")
         drawpoint(xx3,yy3,2)coloured("red")
         drawpoint(xx1,yy1,3)coloured("green")
         drawsegment(xx3,yy3,xx3+abs(xx2-xx3)+5,yy3)coloured("red")style(dottedline)
      endif
   next
   //----triangulo descendente
   for i=z3 downto 0 do
      x1=0
      y1=0
      x2=0
      y2=0
      x3=0
      y3=0
      semafor1d=0
      semafor1u=0
      for j=z1 downto 0 do
         if $level3UPx[i]<$level1UPx[j] and $level3UPx[i]>=$level1UPx[max(0,j-1)] and $level3UP[i]> $level1UP[j] then
            semafor1d=1
            x2=$level1UPx[j]
            y2=$level1UP[j]
            break
         else
            semafor1d=0
         endif
      next
      for k=t1 downto 0 do
         if $level3UPx[i]<$level1DNx[k] and $level3UPx[i]>=$level1DNx[max(0,k-1)] and $level3UP[i]>$level1DN[k] then
            semafor1u=1
            x1=$level3UPx[i]
            y1=$level3UP[i]
            x3=$level1DNx[k]
            y3=$level1DN[k]
            break
         else
            semafor1u=0
         endif
      next
      if semafor1d and semafor1u and x3<x2 and y3 < y2 and y1<>0 then
         drawtriangle(x1,y1,x2,y2,x3,y3)coloured("blue")style(line,2)
         drawpoint(x2,y2,2)coloured("black")
         drawpoint(x3,y3,2)coloured("red")
         drawpoint(x1,y1,3)coloured("blue")
         drawsegment(x3,y3,x3+abs(x2-x3)+5,y3)coloured("blue")style(dottedline)
      endif
   next
endif
return