

Trending and Mean Reversal Simulation
This indicator is a new and improved version of my Floating Mean Reversal Equity Indicator that can be found here:
https://www.prorealcode.com/prorealtime-indicators/floating-mean-reversal-equity-indicator/
This new version thanks to the use of loops allows you to select any quantity of trades to be used in the calculation (the original version was fixed at twenty trades).
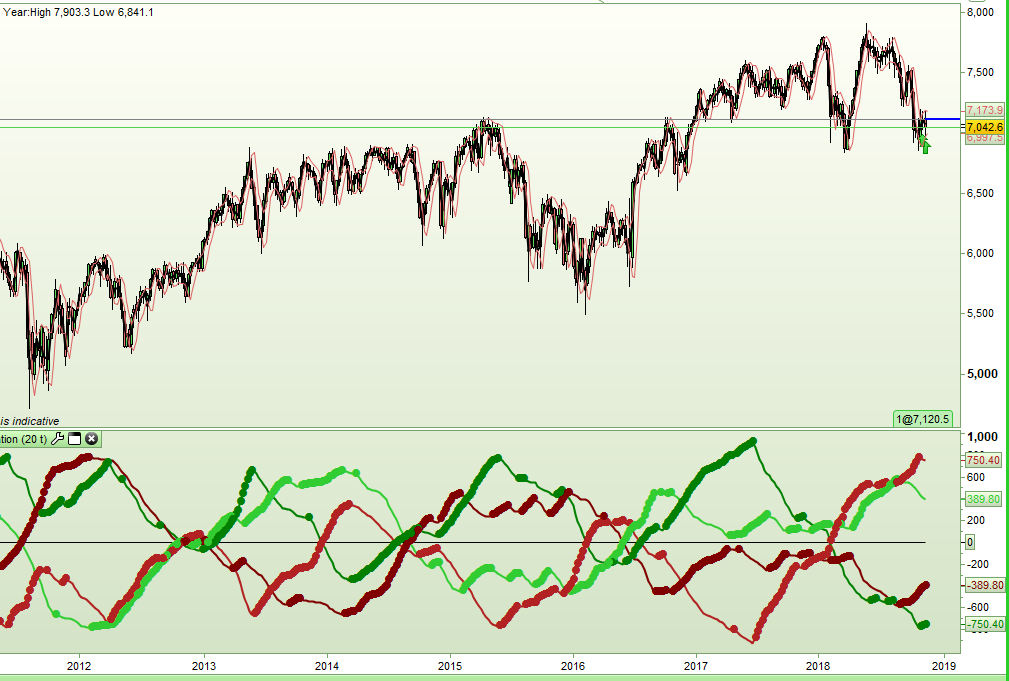
This new version also now plots simulated equity curves for trend trading as well as mean reversal trading.
The indicator plots what the equity curve would have been for the last [qty] trades if you had done any of the following and then closed the trade one bar later:
Mean Reversal Long – Buying on red bar close.
Mean Reversal Short – Selling on green bar close.
Trending Long – Buying on green bar close.
Trending Short – Selling on red bar close.
The darker green and red lines represent long and short mean reversal trades and the lighter green and red represent long and short trending trades.
If a line is rising then that style of trading is becoming more successful in the look back period and if it is declining then that style of trading is becoming less successful. Any line above zero shows that that style of trading would have been profitable in the look back period.
By turning ‘Rising’ on or off you can highlight or not any line that is rising.
The indicator can be slow to plot and was written mainly to be used as a trading filter for weekly and daily charts. I suggest using the CalculateOnLastBars set to a low number if you want to speed up the loading of the indicator.
I have found my original indicator to be a very good filter and hopefully this new version will be even more powerful.
I recommend downloading and importing the ITF file to get full functionality.
//Trending and Mean Reversal Simulation Indicator

//By Vonasi
//18/11/2018

//Simulates equity curve for the last qty trades for a one bar hold for:

//Dark Green Line - Mean Reversal Long - Buying on red bar close.
//Dark Red Line - Mean Reversal Short - Selling on green bar close.
//Light Green Line - Trending Long - Buying on green bar close.
//Light Red Line - Trending Short - Selling on red bar close.


//DEFPARAM CalculateOnLastBars = 500

//Qty = 20
//Rising = 1

mrlongtotal = 0
mrshorttotal = 0
trendinglongtotal = 0
trendingshorttotal = 0

//Trending
count = 0
for i = 1 to barindex
 if close[i] > open[i] then
  trendinglongtotal = trendinglongtotal + (close[i-1] - open[i-1])
  count = count + 1
 endif
 if count = qty then
  break
 endif
next

trendinglongave = weightedaverage[qty](trendinglongtotal)

count = 0
for i = 1 to barindex
 if close[i] < open[i] then
  trendingshorttotal = trendingshorttotal + (open[i-1] - close[i-1])
  count = count + 1
 endif
 if count = qty then
  break
 endif
next

trendingshortave = weightedaverage[qty](trendingshorttotal)

//Mean Reversal
count = 0
for i = 1 to barindex
 if close[i] < open[i] then
  mrlongtotal = mrlongtotal + (close[i-1] - open[i-1])
  count = count + 1
 endif
 if count = qty then
  break
 endif
next

mrlongave = weightedaverage[qty](mrlongtotal)

count = 0
for i = 1 to barindex
 if close[i] > open[i] then
  mrshorttotal = mrshorttotal + (open[i-1] - close[i-1])
  count = count + 1
 endif
 if count = qty then
  break
 endif
next

mrshortave = weightedaverage[qty](mrshorttotal)

if rising then
 if trendinglongave > trendinglongave[1] then
  drawtext("●",barindex,trendinglongave,SansSerif,Standard,10)coloured(50,205,50)
 endif

 if trendingshortave > trendingshortave[1] then
  drawtext("●",barindex,trendingshortave,SansSerif,Standard,10)coloured(178,34,34)
 endif

 if mrlongave > mrlongave[1] then
  drawtext("●",barindex,mrlongave,SansSerif,Standard,10)coloured(0,128,0)
 endif

 if mrshortave > mrshortave[1] then
  drawtext("●",barindex,mrshortave,SansSerif,Standard,10)coloured(128,0,0)
 endif
endif

return 0, trendinglongave coloured(50,205,50) style(line,2) as "Trending Long", trendingshortave coloured(178,34,34) style(line,2) as "Trending Short", mrlongave coloured(0,128,0) style(line,2) as "Mean Reversal Long", mrshortave coloured(128,0,0) style(line,2) as "Mean Reversal Short"