Trend-Reset Cumulative Delta
Introduction
Cumulative volume delta has an anchor problem. Reset it every session and you cannot compare Monday with Thursday. Never reset it and after six months the line tells you about a market that no longer exists. Either way, the number you are looking at is only meaningful against an arbitrary starting point.
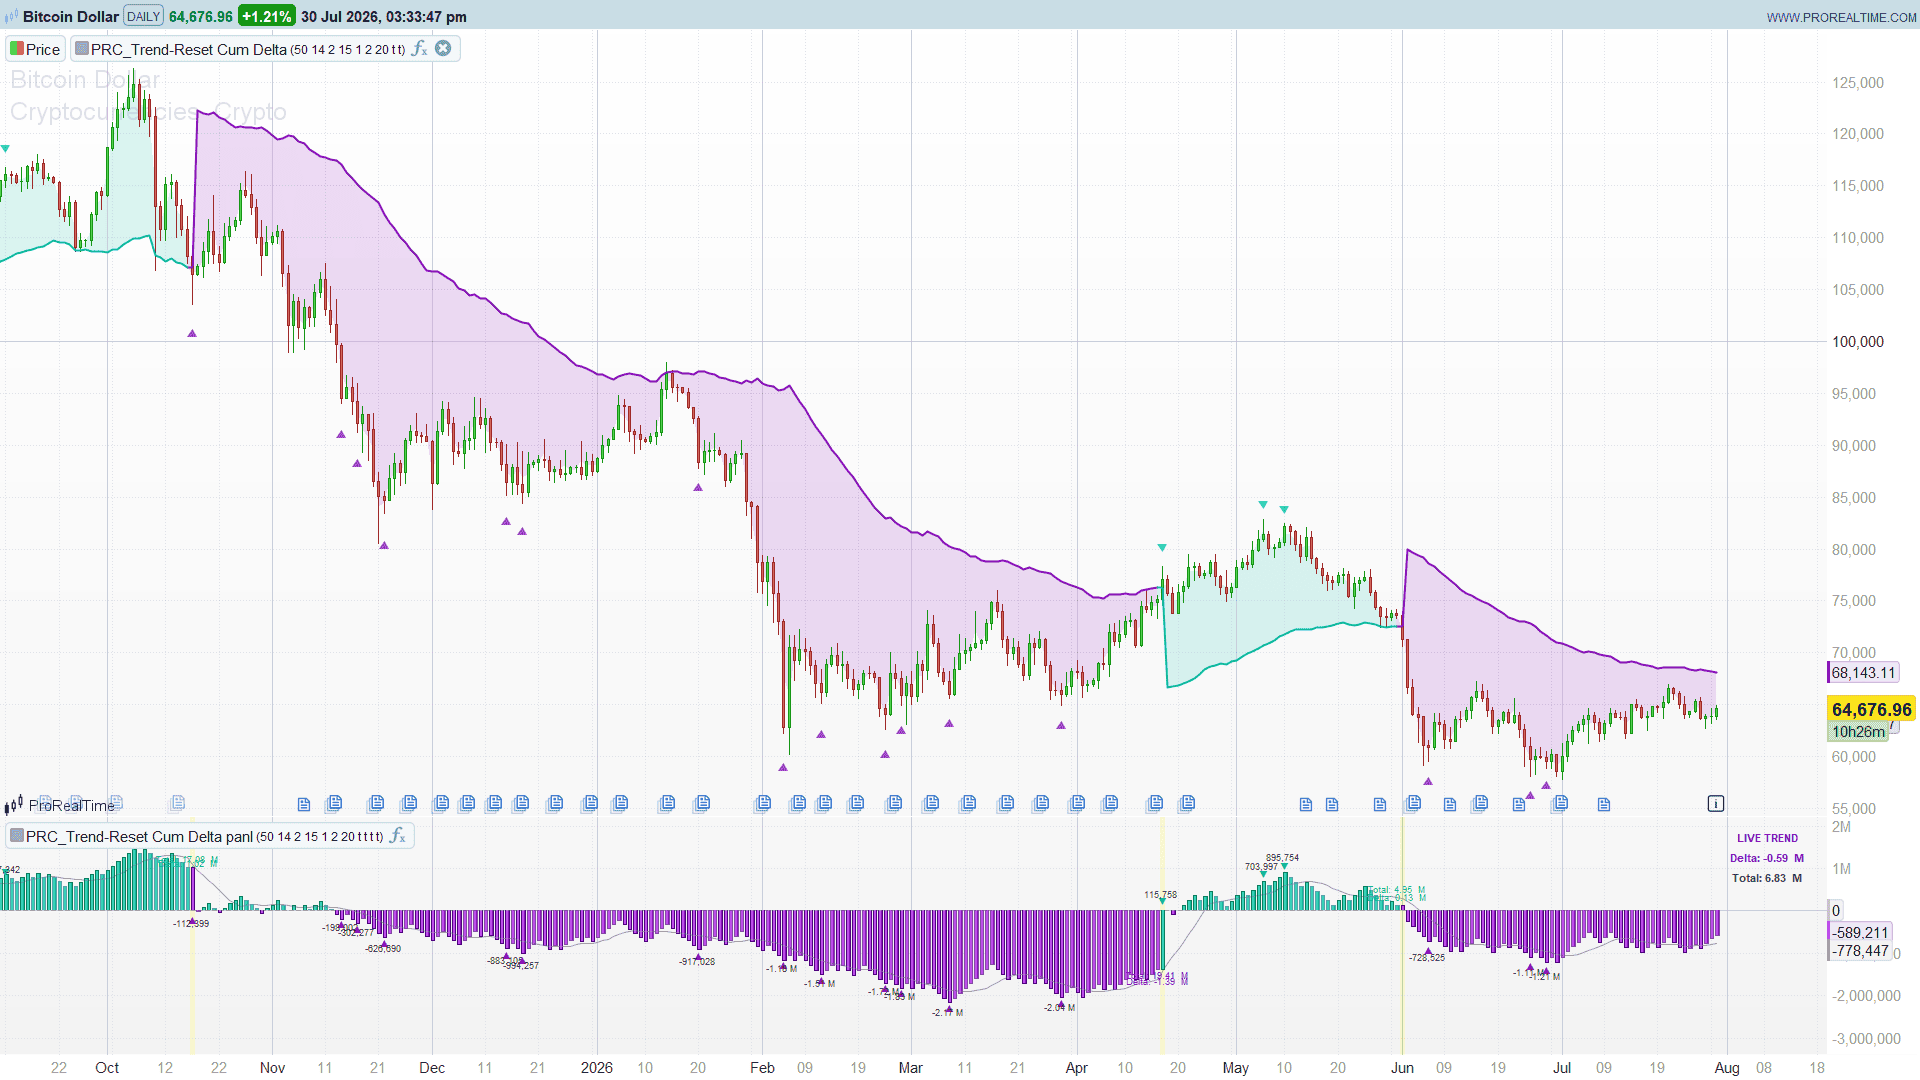
This indicator picks a different anchor: the trend itself. A wide ATR channel around a 50-period EMA defines the regime, and every time price closes outside that channel — flipping the regime — the delta counter goes back to zero and starts accumulating again. What you read on the chart is the buying or selling pressure accumulated inside the current move, and nothing else.
On top of that it marks the statistically unusual extremes of that delta, projects them onto the price chart, and writes a summary of every completed leg: total volume traded, final delta.
The Regime: A Channel With Memory and No Neutral State
upperBand = EMA(close, 50) + ATR(14) * 2.0
lowerBand = EMA(close, 50) - ATR(14) * 2.0
The state machine is deliberately simple, and one detail matters more than the rest:
if close > upperBand   -> state = bullish
if close < lowerBand   -> state = bearish
otherwise              -> state unchanged
There is no way back to neutral. Once price closes above the upper band, the regime is bullish until a close pierces the lower band — which, at two ATRs of width, is a long way down. Inside the channel nothing happens at all.
That is what makes the legs long. Measured on daily SPY from 2019 to mid-2026 — 1,883 bars — the indicator produced 25 resets: an average leg of 75 bars, with the longest running 339. This is not a signal generator that flips every week. It is a regime frame that changes a couple of times a year on a daily chart.
The Delta: Volume Signed by the Candle Body
barDelta = close > open ? +volume : -volume
There is no order-flow data here. This is the classic approximation: an up candle contributes its whole volume as buying pressure, a down candle as selling pressure. Worth knowing, because it sets the limits of what the tool can tell you — it measures where the close finished relative to the open, weighted by volume, not actual aggressive buying versus selling.
One detail that is easy to miss: the comparison is strictly greater than, so a doji with close exactly equal to open counts as negative volume. On a daily chart that is noise. On one-minute bars, or on an illiquid instrument with many flat candles, it is a small systematic bearish bias worth being aware of.
The Reset
if regime changed
    cumDelta = barDelta       // the new leg starts with this bar's own delta
    totalVol = volume
else
    cumDelta = cumDelta + barDelta
The reset bar does not start from zero — it starts from its own delta, so the count is never empty. And the summary label of the leg that just ended uses the previous bar’s values, which is the last state the old leg reached before being wiped.
Reading it is straightforward. A bullish leg that has been running for forty bars with a delta that keeps making new highs is a move being carried by volume. A bullish leg whose delta peaked twenty bars ago and has been sliding since is a move that price is still holding up but volume has stopped supporting. The histogram colours that distinction directly: full opacity when the delta pushes further in its own direction, faded when it retreats.
Pivots Filtered by Z-Score
The extremes of the delta curve are found with an asymmetric pivot — fifteen bars to the left, one to the right — and then filtered:
zScore   = (cumDelta - SMA(cumDelta, 20)) / STDEV(cumDelta, 20)
pivot is kept only if |zScore| >= 2.0 at the pivot bar
The point of the filter is to keep only the peaks that are unusual for this instrument, right now, rather than every local wiggle. On daily SPY, |z| >= 2 occurs on 11.7% of bars and the filter leaves 77 pivots over 1,883 bars — roughly one a month. Note the split: 51 highs against 26 lows, which is not a bug but a consequence of the regime distribution (77% of that history sits in the bullish state).
Because the pivot uses only one bar of right-side confirmation, it confirms fast and repaints while the confirmation bar is still open. That is the original’s design, and it is the usual trade-off: fast confirmation, weaker validation.
One honest caveat about the filter. The Z-Score is computed over a series that gets truncated at every reset, so a 20-bar window that straddles a reset mixes the end of one leg with the beginning of the next. This is measurable: mean |z| is 1.85 in the first three bars of a leg against roughly 1.0 from bar ten onwards, and 27-34% of all the pivots the indicator draws (AAPL / SPY) have a Z-Score window contaminated by a reset. So a pivot appearing right after a reset was filtered by an inflated Z-Score, not by a genuine anomaly in the flow. The pivots to trust are the ones deep inside a leg — the median is 40 bars from the reset.
If you would rather not have the artefact, there are two one-line fixes: shorten zLen to 5-8 bars so the window rarely spans two legs, or require the bar count since the reset to exceed zLen before accepting a pivot.
The Band On the Price Chart Is the Other Side
The price overlay draws the band opposite to the current regime: in a bullish leg it plots the lower band. That is deliberate and it is the most useful part of the display — it is the level whose breach would flip the regime and reset the delta. A visual stop for the leg, with a shaded area between it and the midpoint of each candle.
Two details about that shading, both of which you would notice immediately on a real chart if they were not handled:
- Nothing is drawn before the first regime is established. The state starts as neither bullish nor bearish, and until price closes outside the channel for the first time there is no band to draw and nothing to shade. On a long history that is the difference between a clean left edge and a few hundred bars of meaningless colour.
- The shading stops for one bar at each flip. The band jumps from below price to above it (or the other way round), and the area has to be interrupted rather than stretched across the gap — otherwise the flip paints a vertical stripe from one band to the other, right through the candles. In ProBuilder the way to interrupt it is to collapse both edges of the fill onto the same value for that bar, which gives it zero area. Leaving a hole with
undefineddoes not work:COLORBETWEENbridges the hole and draws exactly the stripe you are trying to avoid.
Two Indicators, Not One
The tool comes as two separate indicators, one for each place it draws. They share their inputs and nothing else:
PRC_Trend-Reset-Cumulative-Delta— the trend band, the fill and the pivot arrows over the candles. Load it with “on price” selected.PRC_Trend-Reset-Cumulative-Delta-Panel— the delta histogram, its average, the zero line, the leg summaries, the pivot labels, the live readout and the reset background. Load it with “new panel” selected.
Each one recomputes the whole engine, so either works on its own.
The ProBuilder Code — Trend Band on the Price Chart
Select “on price” in the editor.
//----------------------------------------------------------------------//
//PRC_Trend-Reset Cumulative Delta [ChartPrime] - banda de tendencia
//version = 0
//30.07.26
//Ivan Gonzalez @ www.prorealcode.com
//Sharing ProRealTime knowledge
//Indicador OVERLAY
//----------------------------------------------------------------------//
//-----Trend Settings---------------------------------------------------//
emaLen     = 50    //Base EMA Length
atrLen     = 14    //ATR Length
atrMult    = 2.0   //ATR Multiplier
//-----Pivot Settings---------------------------------------------------//
pivotLeft  = 15    //barras a la izquierda del pivote (fijo en el original)
pivotRight = 1     //barras de confirmacion a la derecha
zThresh    = 2.0   //Z-Score Threshold
zLen       = 20    //Z-Score Lookback
showPivPx  = 1     //1 = proyectar los pivotes del delta sobre el precio
showFill   = 1     //1 = relleno entre la banda y el punto medio de la vela
//-----Visuals----------------------------------------------------------//
upR  = 18          //Bullish Color (#12bb9f)
upG  = 187
upB  = 159
dnR  = 139         //Bearish Color (#8b12bb)
dnG  = 18
dnB  = 187
//----------------------------------------------------------------------//
srcV     = close   //Source
baseEma  = average[emaLen,1](srcV)
atrV     = averagetruerange[atrLen](close)
upperBnd = baseEma + atrV * atrMult
lowerBnd = baseEma - atrV * atrMult
warmup   = max(emaLen, atrLen) + 2

//-----Volumen defensivo (learning 177)---------------------------------//
IF volume <> undefined THEN
   volB = volume
ELSE
   volB = 0
ENDIF

//-----Estado de tendencia (persistente, solo cambia al cruzar banda)---//
IF barindex <= warmup THEN
   trendSt = 0
ELSE
   trendSt = trendSt[1]
   IF srcV > upperBnd THEN
      trendSt = 1
   ELSIF srcV < lowerBnd THEN
      trendSt = 0 - 1
   ENDIF
ENDIF

trendChg = 0
IF barindex > warmup + 1 AND trendSt <> trendSt[1] THEN
   trendChg = 1
ENDIF

//-----Delta acumulado del tramo (necesario para filtrar los pivotes)---//
IF close > open THEN
   barDelta = volB
ELSE
   barDelta = 0 - volB
ENDIF

IF barindex <= warmup + 1 THEN
   cumDelta = 0
ELSIF trendChg = 1 THEN
   cumDelta = barDelta
ELSE
   cumDelta = cumDelta[1] + barDelta
ENDIF

//-----Z-Score y pivotes sobre el delta---------------------------------//
meanD = average[zLen](cumDelta)
stdD  = std[zLen](cumDelta)
zSc   = (cumDelta - meanD) / max(stdD, 0.000001)

winP  = pivotLeft + pivotRight + 1
warmP = warmup + winP + zLen + 2
phOk  = 0
plOk  = 0
IF barindex > warmP THEN
   candV = cumDelta[pivotRight]
   zAbs  = abs(zSc[pivotRight])
   IF candV = highest[winP](cumDelta) AND zAbs >= zThresh THEN
      phOk = 1
   ENDIF
   IF candV = lowest[winP](cumDelta) AND zAbs >= zThresh THEN
      plOk = 1
   ENDIF
ENDIF

//----------------------------------------------------------------------//
//PROYECCION DE LOS PIVOTES SOBRE EL PRECIO (evento historico, X fija)
//----------------------------------------------------------------------//
IF showPivPx = 1 THEN
   IF phOk = 1 AND cumDelta > 0 THEN
      DRAWTEXT("▼", barindex - pivotRight, high[pivotRight] + 0.7 * atrV, sansserif, standard, 12) COLOURED(upR, upG, upB, 204)
   ENDIF
   IF plOk = 1 AND cumDelta < 0 THEN
      DRAWTEXT("▲", barindex - pivotRight, low[pivotRight] - 0.7 * atrV, sansserif, standard, 12) COLOURED(dnR, dnG, dnB, 204)
   ENDIF
ENDIF

//----------------------------------------------------------------------//
//BANDA DE TENDENCIA
//----------------------------------------------------------------------//
IF trendChg = 1 OR trendSt = 0 THEN
   trendBand = undefined
ELSIF trendSt = 1 THEN
   trendBand = lowerBnd
ELSE
   trendBand = upperBnd
ENDIF

IF trendSt = 1 THEN
   pR = upR
   pG = upG
   pB = upB
ELSE
   pR = dnR
   pG = dnG
   pB = dnB
ENDIF

hl2V = (high + low) / 2
IF trendChg = 1 OR trendSt = 0 THEN
   fillBand = hl2V
ELSE
   fillBand = trendBand
ENDIF
IF showFill = 1 THEN
   fA = 38
ELSE
   fA = 0
ENDIF
COLORBETWEEN(fillBand, hl2V, pR, pG, pB, fA)

RETURN trendBand AS "Trend Boundary" COLOURED(pR, pG, pB, 255) STYLE(line, 2), hl2V AS "Price Ref" COLOURED(0, 0, 0, 0) STYLE(line, 1)
The ProBuilder Code — Cumulative Delta Panel
Select “new panel” in the editor.
//----------------------------------------------------------------------//
//PRC_Trend-Reset Cumulative Delta [ChartPrime] - delta acumulado (panel)
//version = 0
//30.07.26
//Ivan Gonzalez @ www.prorealcode.com
//Sharing ProRealTime knowledge
//Indicador de PANEL: marcar "nuevo panel" en el editor
//----------------------------------------------------------------------//
//-----Trend Settings---------------------------------------------------//
emaLen     = 50    //Base EMA Length
atrLen     = 14    //ATR Length
atrMult    = 2.0   //ATR Multiplier
//-----Pivot Settings---------------------------------------------------//
pivotLeft  = 15    //barras a la izquierda del pivote (fijo en el original)
pivotRight = 1     //barras de confirmacion a la derecha
zThresh    = 2.0   //Z-Score Threshold
zLen       = 20    //Z-Score Lookback
//-----Volume & Labels--------------------------------------------------//
showLabels = 1     //1 = resumen Total/Delta al cerrar cada tramo
showPivots = 1     //1 = etiquetas de pivote filtradas por Z-Score
showLive   = 1     //1 = panel LIVE TREND (esquina superior derecha)
showBg     = 1     //1 = fondo amarillo en la barra de reset
//-----Visuals----------------------------------------------------------//
upR  = 18          //Bullish Color (#12bb9f)
upG  = 187
upB  = 159
dnR  = 139         //Bearish Color (#8b12bb)
dnG  = 18
dnB  = 187
txR  = 60          //color de texto neutro (60 = fondo claro, 220 = fondo negro)
txG  = 60
txB  = 60
//----------------------------------------------------------------------//
srcV     = close   //Source
baseEma  = average[emaLen,1](srcV)
atrV     = averagetruerange[atrLen](close)
upperBnd = baseEma + atrV * atrMult
lowerBnd = baseEma - atrV * atrMult
warmup   = max(emaLen, atrLen) + 2

//-----Volumen defensivo (learning 177)---------------------------------//
//Sin volumen (indices, algunos CFD/forex) volume es undefined y envenena
//toda la recursion del delta: se sustituye por 0 antes de usarlo
IF volume <> undefined THEN
   volB = volume
ELSE
   volB = 0
ENDIF

//-----Estado de tendencia (persistente, solo cambia al cruzar banda)---//
IF barindex <= warmup THEN
   trendSt = 0
ELSE
   trendSt = trendSt[1]
   IF srcV > upperBnd THEN
      trendSt = 1
   ELSIF srcV < lowerBnd THEN
      trendSt = 0 - 1
   ENDIF
ENDIF

trendChg = 0
IF barindex > warmup + 1 AND trendSt <> trendSt[1] THEN
   trendChg = 1
ENDIF

//-----Delta por barra y delta acumulado del tramo----------------------//
//Fiel al original: la comparacion es close > open ESTRICTA, asi que un
//doji (close = open) cuenta como delta NEGATIVO
IF close > open THEN
   barDelta = volB
ELSE
   barDelta = 0 - volB
ENDIF

IF barindex <= warmup + 1 THEN
   cumDelta = 0
   totVol   = 0
ELSIF trendChg = 1 THEN
   cumDelta = barDelta
   totVol   = volB
ELSE
   cumDelta = cumDelta[1] + barDelta
   totVol   = totVol[1] + volB
ENDIF

//-----Z-Score del delta acumulado--------------------------------------//
meanD = average[zLen](cumDelta)
stdD  = std[zLen](cumDelta)
zSc   = (cumDelta - meanD) / max(stdD, 0.000001)

//-----Pivotes sobre el delta, filtrados por Z-Score--------------------//
winP  = pivotLeft + pivotRight + 1
warmP = warmup + winP + zLen + 2
phOk  = 0
plOk  = 0
IF barindex > warmP THEN
   candV = cumDelta[pivotRight]
   zAbs  = abs(zSc[pivotRight])
   IF candV = highest[winP](cumDelta) AND zAbs >= zThresh THEN
      phOk = 1
   ENDIF
   IF candV = lowest[winP](cumDelta) AND zAbs >= zThresh THEN
      plOk = 1
   ENDIF
ENDIF

//-----Unidad de separacion vertical para los textos del panel----------//
rngRef = highest[100](cumDelta) - lowest[100](cumDelta)
IF rngRef > 0 THEN
   yOff = 0.06 * rngRef
ELSE
   yOff = 1
ENDIF

//----------------------------------------------------------------------//
//RESUMEN DEL TRAMO QUE ACABA (evento historico, X fija)
//----------------------------------------------------------------------//
IF showLabels = 1 AND trendChg = 1 AND barindex > warmup + 2 THEN
   cdT = cumDelta[1]
   tvT = totVol[1]
   IF trendSt[1] = 1 THEN
      lR = upR
      lG = upG
      lB = upB
   ELSE
      lR = dnR
      lG = dnG
      lB = dnB
   ENDIF
   IF cdT > 0 THEN
      yT = cdT + 2 * yOff
      yD = cdT + yOff
   ELSE
      yT = cdT - yOff
      yD = cdT - 2 * yOff
   ENDIF
   //escala comun a los dos numeros para que sean comparables (format.volume)
   mxV = max(abs(cdT), abs(tvT))
   IF mxV >= 1000000 THEN
      tS = round(tvT / 10000) / 100
      dS = round(cdT / 10000) / 100
      DRAWTEXT("Total: #tS# M", barindex - 1, yT, sansserif, standard, 9) COLOURED(lR, lG, lB, 255)
      DRAWTEXT("Delta: #dS# M", barindex - 1, yD, sansserif, standard, 9) COLOURED(lR, lG, lB, 255)
   ELSIF mxV >= 1000 THEN
      tS = round(tvT / 10) / 100
      dS = round(cdT / 10) / 100
      DRAWTEXT("Total: #tS# K", barindex - 1, yT, sansserif, standard, 9) COLOURED(lR, lG, lB, 255)
      DRAWTEXT("Delta: #dS# K", barindex - 1, yD, sansserif, standard, 9) COLOURED(lR, lG, lB, 255)
   ELSE
      tS = round(tvT * 100) / 100
      dS = round(cdT * 100) / 100
      DRAWTEXT("Total: #tS#", barindex - 1, yT, sansserif, standard, 9) COLOURED(lR, lG, lB, 255)
      DRAWTEXT("Delta: #dS#", barindex - 1, yD, sansserif, standard, 9) COLOURED(lR, lG, lB, 255)
   ENDIF
ENDIF

//----------------------------------------------------------------------//
//PIVOTES FILTRADOS (simbolo y numero en dos DRAWTEXT, learning 130)
//----------------------------------------------------------------------//
IF showPivots = 1 THEN
   IF phOk = 1 AND cumDelta > 0 THEN
      pvH = cumDelta[pivotRight]
      pvS = round(pvH * 10) / 10
      DRAWTEXT("▼", barindex - pivotRight, pvH + yOff, sansserif, standard, 10) COLOURED(upR, upG, upB, 255)
      DRAWTEXT("#pvS#", barindex - pivotRight, pvH + 2 * yOff, sansserif, standard, 9) COLOURED(txR, txG, txB, 255)
   ENDIF
   IF plOk = 1 AND cumDelta < 0 THEN
      pvL = cumDelta[pivotRight]
      pwS = round(pvL * 10) / 10
      DRAWTEXT("▲", barindex - pivotRight, pvL - yOff, sansserif, standard, 10) COLOURED(dnR, dnG, dnB, 255)
      DRAWTEXT("#pwS#", barindex - pivotRight, pvL - 2 * yOff, sansserif, standard, 9) COLOURED(txR, txG, txB, 255)
   ENDIF
ENDIF

//----------------------------------------------------------------------//
//PANEL LIVE TREND (fijo en la ventana, learning 036)
//----------------------------------------------------------------------//
IF showLive = 1 AND islastbarupdate THEN
   IF trendSt = 1 THEN
      vR = upR
      vG = upG
      vB = upB
   ELSE
      vR = dnR
      vG = dnG
      vB = dnB
   ENDIF
   pX = 0 - 150
   pY = 0 - 20
   DRAWTEXT("LIVE TREND", pX, pY, sansserif, bold, 11) COLOURED(vR, vG, vB, 255) ANCHOR(TOPRIGHT, XSHIFT, YSHIFT)
   mxL = max(abs(cumDelta), abs(totVol))
   IF mxL >= 1000000 THEN
      dL = round(cumDelta / 10000) / 100
      tL = round(totVol / 10000) / 100
      DRAWTEXT("Delta: #dL# M", pX, pY - 20, sansserif, bold, 11) COLOURED(vR, vG, vB, 255) ANCHOR(TOPRIGHT, XSHIFT, YSHIFT)
      DRAWTEXT("Total: #tL# M", pX, pY - 40, sansserif, bold, 11) COLOURED(txR, txG, txB, 255) ANCHOR(TOPRIGHT, XSHIFT, YSHIFT)
   ELSIF mxL >= 1000 THEN
      dL = round(cumDelta / 10) / 100
      tL = round(totVol / 10) / 100
      DRAWTEXT("Delta: #dL# K", pX, pY - 20, sansserif, bold, 11) COLOURED(vR, vG, vB, 255) ANCHOR(TOPRIGHT, XSHIFT, YSHIFT)
      DRAWTEXT("Total: #tL# K", pX, pY - 40, sansserif, bold, 11) COLOURED(txR, txG, txB, 255) ANCHOR(TOPRIGHT, XSHIFT, YSHIFT)
   ELSE
      dL = round(cumDelta * 100) / 100
      tL = round(totVol * 100) / 100
      DRAWTEXT("Delta: #dL#", pX, pY - 20, sansserif, bold, 11) COLOURED(vR, vG, vB, 255) ANCHOR(TOPRIGHT, XSHIFT, YSHIFT)
      DRAWTEXT("Total: #tL#", pX, pY - 40, sansserif, bold, 11) COLOURED(txR, txG, txB, 255) ANCHOR(TOPRIGHT, XSHIFT, YSHIFT)
   ENDIF
ENDIF

//----------------------------------------------------------------------//
//FONDO DE LA BARRA DE RESET (una sola llamada por barra, learning 106)
//----------------------------------------------------------------------//
bgA = 0
IF showBg = 1 AND trendChg = 1 THEN
   bgA = 38
ENDIF
BACKGROUNDCOLOR(255, 255, 0, bgA)

//----------------------------------------------------------------------//
//SERIES: el reset deja hueco en el histograma (plot.style_columns + na)
//----------------------------------------------------------------------//
IF trendChg = 1 THEN
   plotD = undefined
ELSE
   plotD = cumDelta
ENDIF

//color pleno si el delta empuja en su sentido, atenuado si retrocede
IF cumDelta < 0 THEN
   hR = dnR
   hG = dnG
   hB = dnB
   IF cumDelta < cumDelta[1] THEN
      hA = 255
   ELSE
      hA = 178
   ENDIF
ELSE
   hR = upR
   hG = upG
   hB = upB
   IF cumDelta > cumDelta[1] THEN
      hA = 255
   ELSE
      hA = 178
   ENDIF
ENDIF

avgD = average[10](cumDelta)

RETURN plotD AS "Trend Delta" COLOURED(hR, hG, hB, hA) STYLE(histogram, 1), avgD AS "Avg Delta" COLOURED(128, 128, 128, 180) STYLE(line, 1), 0 AS "Zero Line" COLOURED(128, 128, 128, 128) STYLE(dottedline, 1)