

Supply & Demand: Cumulative Volume Delta Flow
1. Introduction
Supply and demand zones are among the most popular tools in price action trading. The idea is simple: identify areas where aggressive buying or selling previously occurred, and watch for price to revisit them. The Supply & Demand CVD Flow indicator automates this detection and adds a layer of volume analysis through the Cumulative Volume Delta (CVD).
Originally developed for TradingView by ChartPrime, this indicator has been adapted to ProBuilder for ProRealTime. It identifies supply and demand zones based on momentum breakouts, tracks them until they are mitigated, and displays the net buying/selling pressure accumulated within each zone since its creation.
2. How It Works
The indicator follows a three-step process: detect, track, and mitigate.
Zone Detection
A new zone is created when a momentum breakout occurs from a base candle:
- Demand zone: A bearish candle (close < open) is followed by a bullish breakout candle whose body is at least ATR × multiplier. The zone is defined by the high and low of the bearish base candle.
- Supply zone: A bullish candle (close > open) is followed by a bearish breakout candle meeting the same body threshold. The zone spans the high and low of the bullish base candle.
The ATR filter ensures that only significant breakouts create zones, filtering out noise and minor fluctuations.
Overlap Prevention
Before creating a new zone, the indicator checks whether it would overlap with any existing zone of the same type. If the new zone’s price range intersects with an active zone, it is discarded. This prevents zone clustering and keeps the chart clean.
Zone Mitigation
Active zones are automatically removed when price closes through them:
- A demand zone is mitigated when the close falls at or below the zone’s bottom boundary.
- A supply zone is mitigated when the close rises at or above the zone’s top boundary.
Mitigation represents the “consumption” of the orders that created the zone — once price has moved through the level, the zone is considered spent.
Cumulative Volume Delta (CVD)
For each active zone, the indicator calculates the CVD from the moment the zone was created to the current bar. The CVD sums up volume on bullish bars (close > open) and subtracts volume on bearish bars (close < open):
- Positive CVD in a demand zone confirms buying pressure — the zone is being “respected” by buyers.
- Negative CVD in a supply zone confirms selling pressure — sellers are defending the level.
- Divergence (negative CVD in a demand zone, or positive CVD in a supply zone) may signal that the zone is losing strength and could be mitigated soon.
3. Reading the Indicator
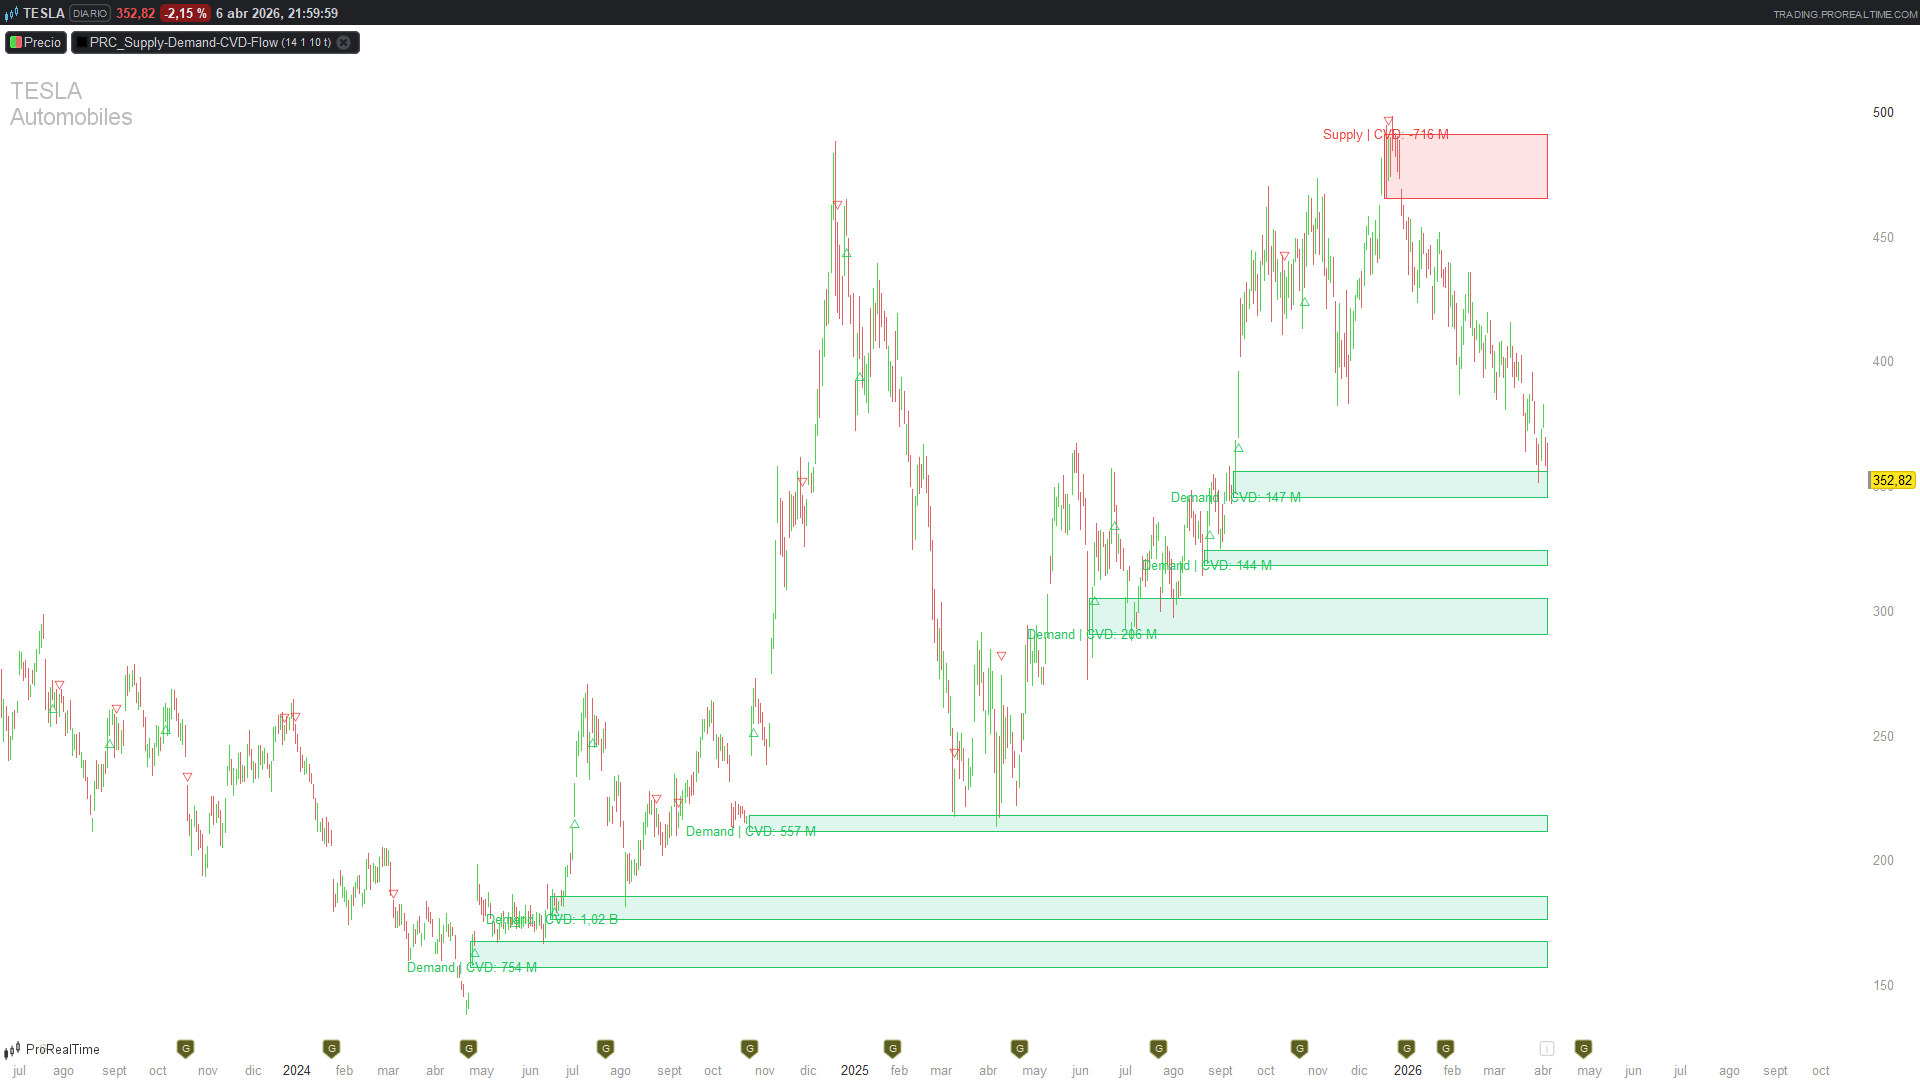
The indicator draws directly on the price chart:
- Green rectangles: Active demand zones. These extend from the zone’s creation bar to the current bar, between the high and low of the base candle.
- Red rectangles: Active supply zones. Same structure as demand zones.
- Text labels: Each zone displays its type and cumulative volume delta value (e.g., “Demand | CVD: 125430”).
- △ triangles (green, below bar): Mark the bar where a new demand zone was detected.
- ▽ triangles (red, above bar): Mark the bar where a new supply zone was detected.
When a zone is mitigated, it disappears from the chart entirely.
4. Practical Applications
- Support/Resistance identification: Active demand zones act as potential support; supply zones as resistance. The longer a zone survives without mitigation, the more significant it may be.
- Volume confirmation: A demand zone with strongly positive CVD suggests genuine institutional buying, not just a temporary bounce. Use CVD to filter which zones deserve attention.
- Breakout anticipation: When CVD diverges from the zone type (e.g., increasingly negative CVD in a demand zone), the zone may be weakening — watch for a potential breakdown.
- Mean reversion entries: Look for price approaching an active demand zone with positive CVD as a pullback buying opportunity in trending markets.
- Risk management: Place stops beyond the far edge of an active zone. If the zone is mitigated, the trade thesis is invalidated.
5. Parameters
- atrLen: 14 – ATR period for breakout threshold calculation.
- momMult: 1.0 – Momentum multiplier. Breakout candle body must be >= ATR × this value. Higher = fewer but stronger zones.
- maxZones: 10 – Maximum active zones per type (demand/supply). When exceeded, the oldest zone is removed.
- showSignals: 1 – Show/hide the △▽ signal markers (1=show, 0=hide).
6. Code
//--------------------------------------------
// PRC_Supply-Demand-CVD-Flow (by ChartPrime)
// version = 0
// 07.04.2026
// Ivan Gonzalez @ www.prorealcode.com
// Sharing ProRealTime knowledge
//--------------------------------------------
defparam drawonlastbaronly = true
//--------------------------------------------
// === PARAMETERS ===
atrLen = 14       // ATR length
momMult = 1.0     // Breakout body >= ATR * mult
maxZones = 10     // Max active zones per type
showSignals = 1   // Signal triangles (1=yes, 0=no)

//--------------------------------------------
// === ATR ===
myATR = averagetruerange[atrLen](close)

//--------------------------------------------
// === ZONE DETECTION ===
// Base candle = bar[2], breakout candle = bar[1]
IF barindex > 2 THEN
   brkBody = abs(close[1] - open[1])
   isDemand = (close[2] < open[2]) AND (close[1] > open[1]) AND brkBody >= momMult * myATR[1]
   isSupply = (close[2] > open[2]) AND (close[1] < open[1]) AND brkBody >= momMult * myATR[1]
ELSE
   isDemand = 0
   isSupply = 0
ENDIF

//--------------------------------------------
// === COUNTERS ===
once dCount = 0
once sCount = 0
once sigCount = 0

//--------------------------------------------
// === CREATE DEMAND ZONE ===
IF isDemand THEN
   zTop = high[2]
   zBot = low[2]
   zLeft = barindex - 2

   overlap = 0
   FOR i = 0 TO dCount - 1 DO
      IF $dValid[i] = 1 THEN
         IF zBot <= $dTop[i] AND zTop >= $dBot[i] THEN
            overlap = 1
            BREAK
         ENDIF
      ENDIF
   NEXT

   IF overlap = 0 THEN
      $dTop[dCount] = zTop
      $dBot[dCount] = zBot
      $dLeft[dCount] = zLeft
      $dValid[dCount] = 1
      dCount = dCount + 1

      // Trim oldest if exceeds max
      activeD = 0
      FOR i = 0 TO dCount - 1 DO
         IF $dValid[i] = 1 THEN
            activeD = activeD + 1
         ENDIF
      NEXT
      IF activeD > maxZones THEN
         FOR i = 0 TO dCount - 1 DO
            IF $dValid[i] = 1 THEN
               $dValid[i] = 0
               BREAK
            ENDIF
         NEXT
      ENDIF

      // Store signal
      IF showSignals = 1 THEN
         $sigBar[sigCount] = barindex
         $sigPrice[sigCount] = low - myATR * 0.3
         $sigType[sigCount] = 1
         sigCount = sigCount + 1
      ENDIF
   ENDIF
ENDIF

//--------------------------------------------
// === CREATE SUPPLY ZONE ===
IF isSupply THEN
   zTop = high[2]
   zBot = low[2]
   zLeft = barindex - 2

   overlap = 0
   FOR i = 0 TO sCount - 1 DO
      IF $sValid[i] = 1 THEN
         IF zBot <= $sTop[i] AND zTop >= $sBot[i] THEN
            overlap = 1
            BREAK
         ENDIF
      ENDIF
   NEXT

   IF overlap = 0 THEN
      $sTop[sCount] = zTop
      $sBot[sCount] = zBot
      $sLeft[sCount] = zLeft
      $sValid[sCount] = 1
      sCount = sCount + 1

      activeS = 0
      FOR i = 0 TO sCount - 1 DO
         IF $sValid[i] = 1 THEN
            activeS = activeS + 1
         ENDIF
      NEXT
      IF activeS > maxZones THEN
         FOR i = 0 TO sCount - 1 DO
            IF $sValid[i] = 1 THEN
               $sValid[i] = 0
               BREAK
            ENDIF
         NEXT
      ENDIF

      IF showSignals = 1 THEN
         $sigBar[sigCount] = barindex
         $sigPrice[sigCount] = high + myATR * 0.3
         $sigType[sigCount] = -1
         sigCount = sigCount + 1
      ENDIF
   ENDIF
ENDIF

//--------------------------------------------
// === MITIGATION ===
FOR i = 0 TO dCount - 1 DO
   IF $dValid[i] = 1 AND close <= $dBot[i] THEN
      $dValid[i] = 0
   ENDIF
NEXT

FOR i = 0 TO sCount - 1 DO
   IF $sValid[i] = 1 AND close >= $sTop[i] THEN
      $sValid[i] = 0
   ENDIF
NEXT

//--------------------------------------------
// === DRAWING ===
IF islastbarupdate THEN
   // Demand zones + CVD
   FOR i = 0 TO dCount - 1 DO
      IF $dValid[i] = 1 THEN
         zLen = barindex - $dLeft[i]
         cumDelta = 0
         FOR k = zLen DOWNTO 0 DO
            IF close[k] > open[k] THEN
               cumDelta = cumDelta + volume[k]
            ELSIF close[k] < open[k] THEN
               cumDelta = cumDelta - volume[k]
            ENDIF
         NEXT
         drawrectangle($dLeft[i], $dBot[i], barindex, $dTop[i]) coloured(34,197,94) fillcolor(34,197,143,38)
         drawtext("Demand | CVD: #cumDelta#", $dLeft[i]+2, $dBot[i]) coloured(34,197,94)
      ENDIF
   NEXT

   // Supply zones + CVD
   FOR i = 0 TO sCount - 1 DO
      IF $sValid[i] = 1 THEN
         zLen = barindex - $sLeft[i]
         cumDelta = 0
         FOR k = zLen DOWNTO 0 DO
            IF close[k] > open[k] THEN
               cumDelta = cumDelta + volume[k]
            ELSIF close[k] < open[k] THEN
               cumDelta = cumDelta - volume[k]
            ENDIF
         NEXT
         drawrectangle($sLeft[i], $sBot[i], barindex, $sTop[i]) coloured(239,68,68) fillcolor(239,68,68,38)
         drawtext("Supply | CVD: #cumDelta#", $sLeft[i]+2, $sTop[i]) coloured(239,68,68)
      ENDIF
   NEXT

   // Signal triangles
   IF showSignals = 1 THEN
      FOR i = 0 TO sigCount - 1 DO
         IF $sigType[i] = 1 THEN
            drawtext("△", $sigBar[i], $sigPrice[i]) coloured(34,197,94)
         ELSIF $sigType[i] = -1 THEN
            drawtext("▽", $sigBar[i], $sigPrice[i]) coloured(239,68,68)
         ENDIF
      NEXT
   ENDIF
ENDIF

RETURN
