

Top Bottom indicator
October 8, 2020, 9:31 AM
Indicators
13 Comments
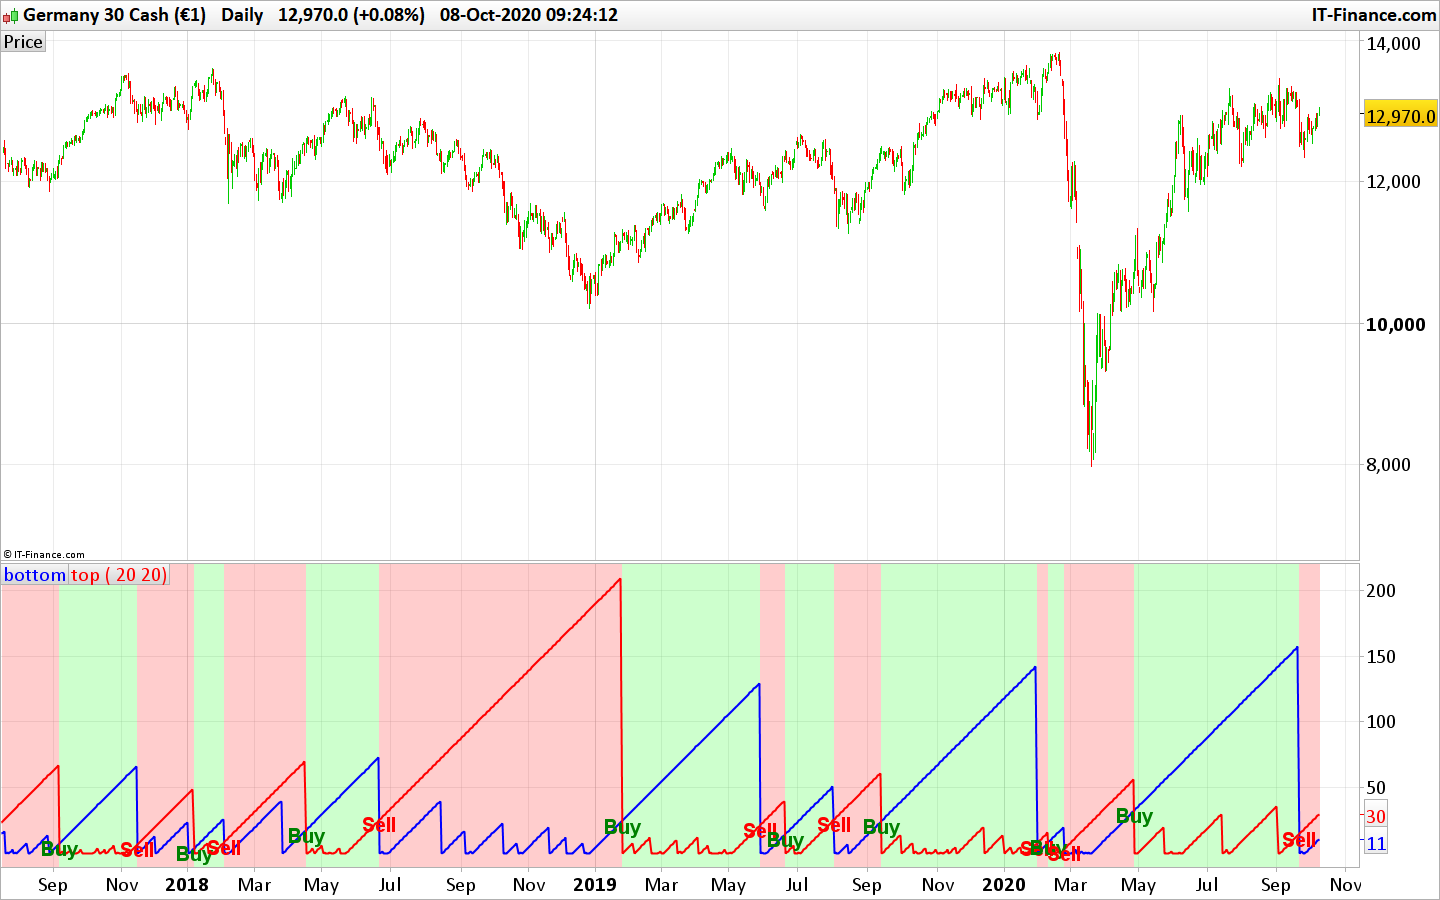
The Top and Bottom indicator is using the breakout of the most recent tops and bottoms of the last x periods to start counting the number of bars elapsed since the events.
- When the bars count of the last bearish breakout is higher than the bars count of the last bullish breakout, a buy signal is generated.
- When the bars count of the last bullish breakout is higher than the bars count of the last bearish breakout, a sell signal is generated.
Code converted from another trading platform programming language, as per a request in the indicators forum.
//PRC_Top Bottom | indicator
//08.10.2020
//Nicolas @ www.prorealcode.com
//Sharing ProRealTime knowledge

// --- settings
per = 14 //Bottom Period
per2 = 14 //Top Period
// --- end of settings

loc = low < lowest[per](low[1]) and low <= lowest[per](low[per])
if loc then
 locstart=barindex
endif
bottom = barindex-locstart

loc2 = high > highest[per2](high[1]) and high >= highest[per2](high[per2])
if loc2 then
 loc2start=barindex
endif
top = barindex-loc2start

iBuy = bottom crosses over top
iSell = bottom crosses under top

if iBuy then
 drawtext("Buy",barindex,bottom-4,dialog,bold,20) coloured(0,128,0)
endif
if iSell then
 drawtext("Sell",barindex,top-4, dialog,bold,20) coloured(255,0,0)
endif

if top<bottom then
 backgroundcolor(0,255,0,50)
else
 backgroundcolor(255,0,0,50)
endif

return bottom coloured(0,0,255) style(line,2) as "bottom", top coloured(255,0,0) style(line,2) as "top"
Download
Filename:
PRC_Top-Bottom-Indicator.itf
Downloads:
853
Master
I created ProRealCode because I believe in the power of shared knowledge. I spend my time coding new tools and helping members solve complex problems.
If you are stuck on a code or need a fresh perspective on a strategy, I am always willing to help. Welcome to the community!
Author’s Profile
Loading...