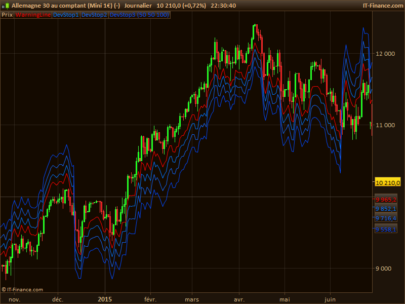
Range Expansion Index
The DeMark Range Expansion Index is a market-timing oscillator described in DeMark on Day Trading Options, by T.R. DeMark and T.R. Demark, Jr., McGraw Hill, 1999. The oscillator is arithmetically calculated and is designed to overcome problems with exponentially calculated oscillators, like MACD. The TD REI oscillator typically produces values of -100 to +100 with 45 or higher indicating overbought conditions and -45 or lower indicating oversold. Here is how Tom DeMark describes the calculation of Range Expansion Index:
“The first step of the calculating the REI is to add the respective differences between the current day’s high and the high two days earlier and the current day’s low and the low two days earlier. These values will be positive or negative depending on whether the current day’s high and low are greater or less than the high and low two days earlier. To prevent buying or selling prematurely into a steep price decline or advance, two additional conditions should be met to qualify a positive or negative value on a particular day: 1) either the high two days earlier must be greater than or equal to the close seven or eight days ago, or the current day’s high must be greater than or equal to the low five or six days ago; 2) either the low two days earlier must be less than or equal to the close seven or eight days ago, or the current day’s low must be less than or equal to the high five or six days ago. If either of these conditions are not satisfied, a zero value is assigned to that day. If they both are, the daily values (the differences between the highs and lows) are summed , and the specific value for that next day is determined. Next, all the positives and negative values are added together over a five-day period. This value is then divided by the absolute value price movement of each day over the five-day period. The numerator of the calculation can be either positive, negative or zero, because each day’s value is summed for five days, but the denominator is always positive because it is only concerned with the differential price movement itself. This value is then multiplied by 100. Consequently, the REI can fluctuate between +100 and -100.”
Parameters
HighMom (HighMom = 0)
LowMom (LowMom = 0)
Cond1 (Cond1 = 0)
Cond2 (Cond2 = 0)
Cond3 (Cond3 = 0)
Cond4 (Cond4 = 0)
Cond (Cond = 0)
Num (Num = 0)
Den (Den = 0)
TDREI (TDREI = 0)
|
1 2 3 4 5 6 7 8 9 10 11 12 13 14 15 16 17 18 |
HighMom = DHigh(0) - DHigh(2) LowMom = DLow(0) - DLow(2 ) Cond1 = (DHigh(0) >= Dlow(5) OR DHigh(0) >= DLow(6) ) Cond2 = ( DHigh(2) >= DClose(7) OR DHigh(2) >= DClose (8) ) Cond3 = ( DLow(0) <= DHigh (5) OR DLow(0) <= DHigh(6) ) Cond4 = (DLow(2) <= DClose(7) OR DLow(2) <= DClose(8) ) Cond = ( Cond1 OR Cond2 ) AND ( Cond3 OR Cond4 ) IF Cond then Num = HighMom + LowMom Else Num = 0 ENDIF Den = ABS( HighMom ) + ABS( LowMom ) TDREI = 100 * Summation [5](Num) / Summation [5] (Den) return TDREI |
Share this
No information on this site is investment advice or a solicitation to buy or sell any financial instrument. Past performance is not indicative of future results. Trading may expose you to risk of loss greater than your deposits and is only suitable for experienced investors who have sufficient financial means to bear such risk.
ProRealTime ITF files and other attachments :PRC is also on YouTube, subscribe to our channel for exclusive content and tutorials


