

Market Structure Algo
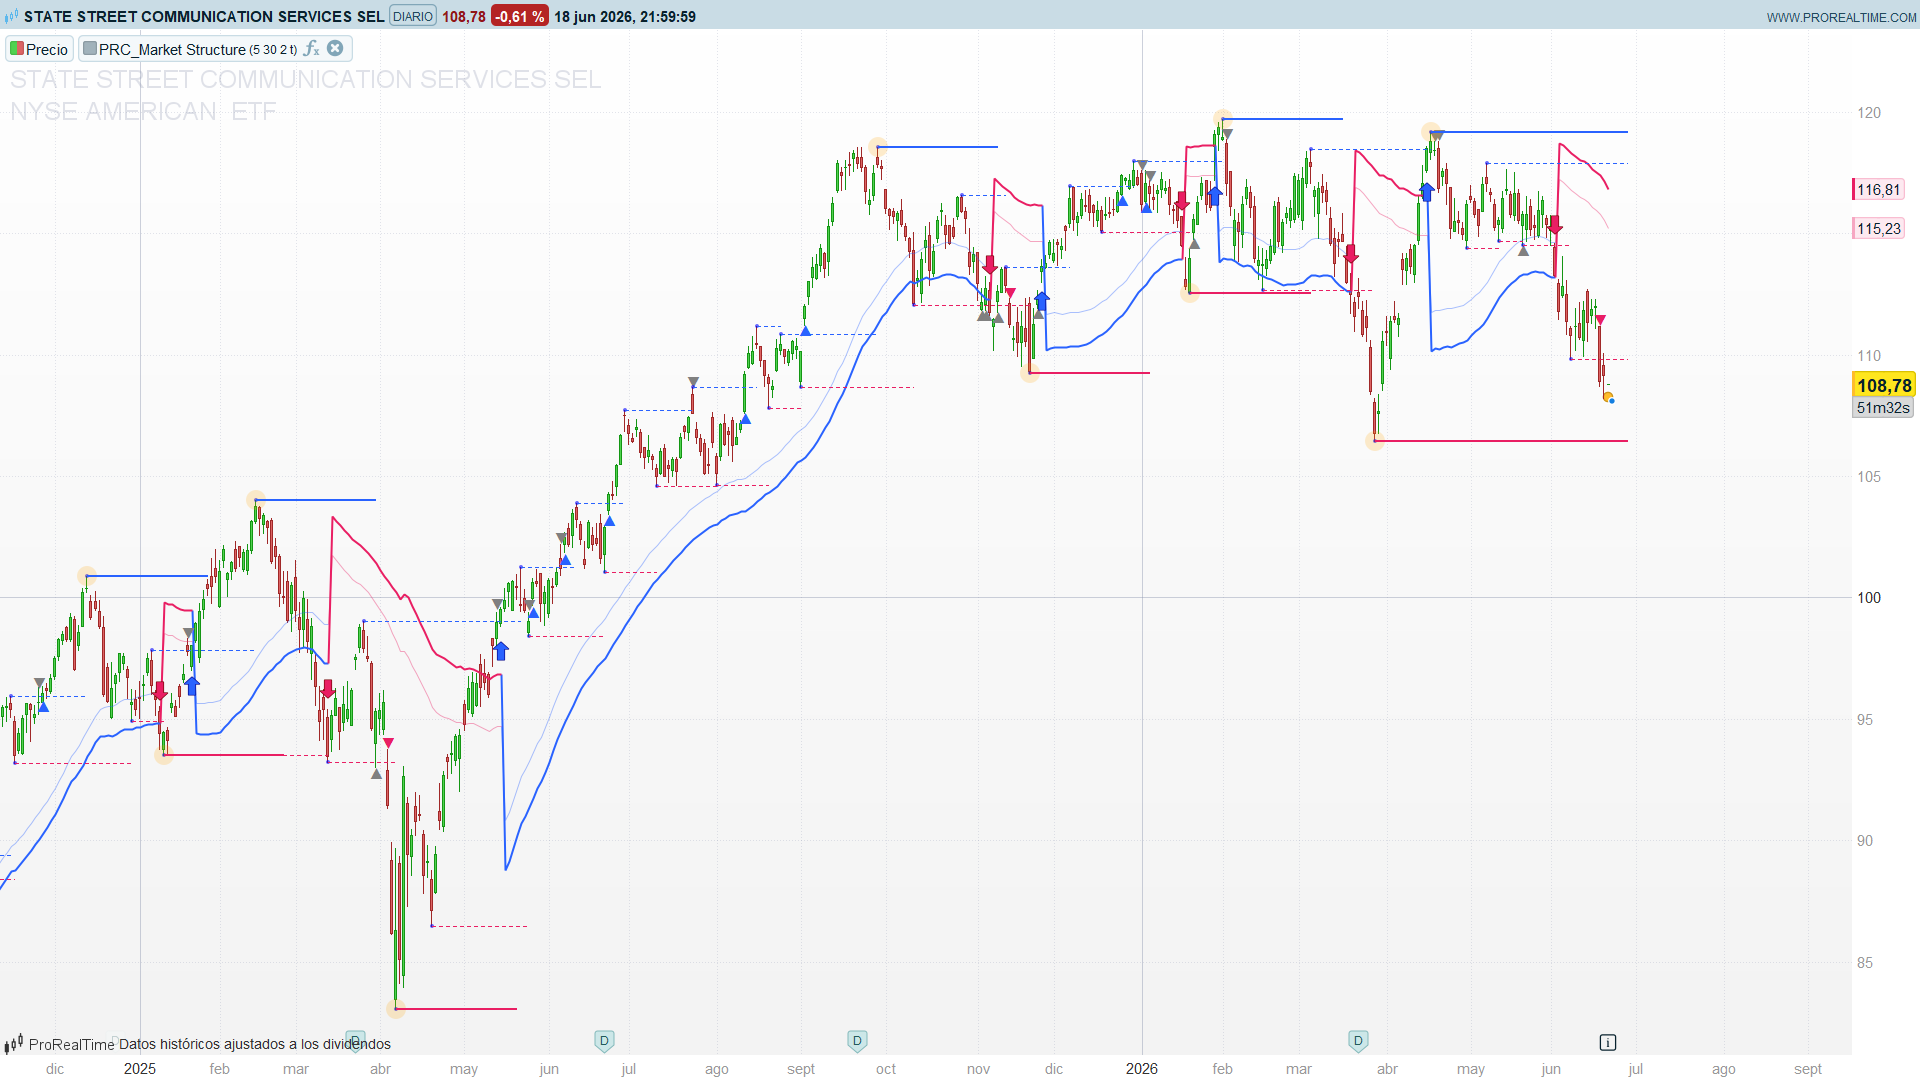
Smart-money charts live and die by one question: is the market making higher highs and higher lows, or the opposite — and has that just changed? Market Structure Algo, by OmegaTools, answers it on two scales at once. It tracks swing pivots with a fast, reactive period and with a slow, structural period, paints the levels that matter, and then labels every break for what it really is: a Change of Character (a genuine reversal of structure) or a Break of Structure (a continuation of the trend already in force). On top of that it draws an ATR-based value zone that only appears while structure is cleanly trending, giving you a dynamic area of support in an uptrend and resistance in a downtrend.
The appeal is that it does the bookkeeping a discretionary SMC trader does by hand — marking swing highs and lows, watching which one price takes out, and asking whether that break confirms or contradicts the prevailing structure — and it does it consistently, bar after bar, on whatever instrument and timeframe you drop it on.
Theory Behind the Indicator
1. Two scales of pivots
Everything is built on swing pivots detected with the classic symmetric-window test. A bar prd candles ago is a pivot high when its high is the highest of the 2*prd+1-bar window centred on it, and a pivot low when its low is the lowest of that window:
pivot high : high[prd] = highest(2*prd+1) of high
pivot low  : low[prd]  = lowest(2*prd+1)  of low
The indicator runs this twice:
- Internal structure (
prdleftInt = 5) — a fast read of the short-term swings. These pivots feed the trend state and the entry signals. - External structure (
prdleftExt = 30) — the major swings. These are drawn as solid horizontal levels extended to the right, the big lines price has to respect.
Like any centred-window pivot, each one is confirmed prd bars after the fact — the price of certainty.
2. Last pivot levels and the swing chain
Every time a new internal pivot prints, the indicator stores the most recent valid high (ph) and low (pl) — these are the levels a break is measured against. It also keeps a running pair of the current and previous pivot of each type (currenth/lasth, currentl/lastl), updated only on a fresh pivot, and joins consecutive same-side pivots with dotted segments. That current vs last pair is exactly what lets the indicator ask “is this a higher high than the one before it?” without re-scanning history.
3. The market-structure state ms
The heart of the tool is a four-level state variable:
| `ms` | Meaning | Condition |
|---|---|---|
| `+2` | Bullish Strong | higher high **and** higher low **and** `close > ph` |
| `+1` | Bullish | `close > ph` |
| `-2` | Bearish Strong | lower high **and** lower low **and** `close < pl` |
| `-1` | Bearish | `close < pl` |
The sign is the direction; the magnitude is the conviction. A plain ±1 is a close beyond the last pivot; a ±2 is that same break backed by a full higher-high/higher-low (or lower-high/lower-low) swing sequence. Crucially, the state is sticky: when no condition fires on a given bar, ms simply keeps its previous value. That persistence is what makes the previous-bar reading ms[1] meaningful.
4. CHoCH vs BOS — reading the break
This is where the indicator earns its keep. A break of the last pivot level is classified by comparing it against the previous structure state:
- CHoCH — Change of Character. A close above
phwhile structure was bearish (ms[1] < 0), or a close belowplwhile it was bullish (ms[1] > 0). The market just broke against the trend that was in force — the first evidence of a reversal. Drawn as an arrow. - BOS — Break of Structure. A close above
phwhile already bullish (ms[1] > 0), or belowplwhile already bearish (ms[1] < 0). The market broke in the direction of the existing trend — a continuation. Drawn as a triangle, and only on the first bar of the event so it does not repeat.
That single distinction — break against structure versus break with it — is the whole grammar of smart-money structure reading, and here it falls straight out of the sign of ms[1].
5. Failed breaks — the exit markers
Not every poke through a level sticks. The indicator flags the ones that fail:
- Long exit:
high > ph AND close < ph— price traded above the pivot high but closed back below it. A rejection at resistance, often a liquidity grab above the swing. - Short exit:
low < pl AND close > pl— price traded below the pivot low but closed back above. A rejection at support.
These print as grey triangles and serve as a warning that a breakout attempt was rejected — useful both as an exit cue for an open trade and as a heads-up that the opposite side may be in control.
6. The ATR value zone
When structure is cleanly trending — the current and previous state share the same sign (ms > 0 AND ms[1] > 0, or both negative) — the indicator draws a band anchored to the external-period moving average and scaled by ATR:
uptrend   : zone from (ma - atr*dist) up by one atr        (below price → support)
downtrend : zone from (ma + atr*dist) down by one atr      (above price → resistance)
In an uptrend the band sits below price as a dynamic value/support area you would expect pullbacks to find; in a downtrend it sits above as resistance. The multiplier dist (default 2.0) sets how far from the average the band is placed. When structure is mixed or flat, the zone simply disappears — it only shows up when there is a trend worth framing.
How to Read the Indicator
- Solid lines are the battleground. The external pivot levels are the major highs and lows; a decisive close beyond one is the event everything else keys off.
- Arrow = reversal, triangle = continuation. An arrow (CHoCH) is your first warning that the trend may be turning. A triangle (BOS) confirms the trend you are already in is pushing further. Treat them differently: a CHoCH is an early, riskier signal; a BOS is confirmation.
- Grey triangles are rejections. A failed break at a level — price tried, got rejected, closed back. Tighten or exit; do not chase the break that just failed.
- The zone is your pullback map. While it is drawn, expect retracements toward the band — support below in an uptrend, resistance above in a downtrend. When the zone vanishes, structure is no longer cleanly trending and trend-following entries are lower quality.
msis the regime. Positive means up-structure, negative means down-structure, and±2is the high-conviction version with full HH/HL or LH/LL backing.
Practical Applications
- Directional bias filter. Use the sign of
msas a gate: longs only whilems > 0, shorts only whilems < 0. Because the state is sticky and pivot-based, it is far steadier than a moving-average slope. - Two-speed entries. Take the aggressive entry on the CHoCH arrow (catching the turn early) or the confirmed entry on the BOS triangle (waiting for the trend to prove itself). The same chart gives you both styles.
- Structural stops. The last pivot level —
phfor shorts,plfor longs — is the natural invalidation point; a close back through it is exactly what the exit markers flag. - Pullback timing. In a trend, use the ATR value zone as the area to look for re-entries: buy pullbacks into the support band in an uptrend, sell rallies into the resistance band in a downtrend.
- Liquidity-grab fade. The failed-break (exit) markers isolate stop runs above/below a swing that close back inside — a classic SMC fade setup.
Indicator Configuration
prdleftInt(default 5): the internal pivot half-window. Lower values react faster but produce more swings; raise it for cleaner short-term structure.prdleftExt(default 30): the external pivot half-window. This sets how “major” the drawn levels are. Raise it on higher timeframes for fewer, more significant lines.dist(default 2.0): ATR multiplier for the value zone’s distance from the moving average. Larger values push the zone further from price.showZone(default 1): set to 0 to hide the ATR zone and keep only the structure levels and signals.
The colours are defined as plain RGB constants at the top of the code (upcolor* for bullish, downcolor* for bearish, graycolor* for the rejection markers). Edit those to recolour the indicator to taste.
Code
//---------------------------------------------
// PRC_Market Structure Algo by OmegaTools
//version = 0
//17.10.2025
//Iván González @ www.prorealcode.com
//Sharing ProRealTime knowledge
//---------------------------------------------
// --- User Inputs ---
//---------------------------------------------
// Internal Market Structure period
prdleftInt = 5
// External Market Structure period
prdleftExt = 30
// Zone Distance multiplier for ATR
dist = 2.0
// Show volatility zones (1 = yes, 0 = no)
showZone = 1
// --- Appearance ---
// Positive color (R, G, B)
upcolorR = 41
upcolorG = 98
upcolorB = 255
// Negative color (R, G, B)
downcolorR = 233
downcolorG = 30
downcolorB = 99
// Exit signal color (Gray)
graycolorR = 128
graycolorG = 128
graycolorB = 128
alpha = 50
//---------------------------------------------
// --- Internal Market Structure Calculation
//---------------------------------------------
pvh = 0
pvl = 0
// Pivot High Detection: checks if the high 'left' bars ago is the highest in a window of 'left*2+1' bars
IF high[prdleftInt] = highest[prdleftInt*2+1](high) THEN
   pvh = high[prdleftInt]
   pvhx = barindex[prdleftInt]
   drawpoint(pvhx,pvh,1)coloured("blue",150)
ENDIF
// Pivot Low Detection: checks if the low 'left' bars ago is the lowest in a window of 'left*2+1' bars
IF low[prdleftInt] = lowest[prdleftInt*2+1](low) THEN
   pvl = low[prdleftInt]
   pvlx = barindex[prdleftInt]
   drawpoint(pvlx,pvl,1)coloured("blue",150)
ENDIF
// Store the last valid pivot levels
IF pvh > 0 THEN
   ph = pvh
ENDIF
IF pvl > 0 THEN
   pl = pvl
ENDIF
// Store current and last pivot high/low values (valuewhen logic)
IF pvh <> 0 THEN
   lasth = currenth
   lasthx = currenthx
   currenth = high[prdleftInt]
   currenthx = barindex[prdleftInt]
   drawsegment(lasthx,lasth,currenthx,lasth)COLOURED(upcolorR, upcolorG, upcolorB)style(dottedline)
ENDIF

IF pvl <> 0 THEN
   lastl = currentl
   lastlx = currentlx
   currentl = low[prdleftInt]
   currentlx = barindex[prdleftInt]
   drawsegment(lastlx,lastl,currentlx,lastl)COLOURED(downcolorR, downcolorG, downcolorB)style(dottedline)
ENDIF
//---------------------------------------------
// Determine Market Structure (ms) state
//---------------------------------------------
IF currenth > lasth AND currentl > lastl AND close > ph THEN
   ms = 2 // Bullish Strong
ELSIF close > ph THEN
   ms = 1 // Bullish
ELSIF currenth < lasth AND currentl < lastl AND close < pl THEN
   ms = -2 // Bearish Strong
ELSIF close < pl THEN
   ms = -1 // Bearish
ENDIF
//---------------------------------------------
// --- Signal Conditions ---
//---------------------------------------------
// Long CHoCH Signal (Change of Character)
longsig = close > ph AND ms[1] < 0
// Short CHoCH Signal
shortsig = close < pl AND ms[1] > 0
// Long BOS Signal (Break of Structure)
longsig1 = close > ph AND ms[1] > 0
shortsig1 = close < pl AND ms[1] < 0
longsig2 = longsig1 AND NOT longsig1[1] AND NOT longsig[1]
shortsig2 = shortsig1 AND NOT shortsig1[1] AND NOT shortsig[1]
// Exit Signals
longexit = high > ph AND close < ph
shortexit = low < pl AND close > pl
//---------------------------------------------
// --- External Market Structure Calculation
//---------------------------------------------
once pvhExt = high
once pvlExt = low
IF high[prdleftExt] = highest[prdleftExt*2+1](high) THEN
   pvhExt = high[prdleftExt]
   pvhxExt = barindex[prdleftExt]
   drawpoint(pvhxExt,pvhExt,5)coloured("orange",50)
   drawsegment(pvhxExt,pvhExt,barindex,pvhExt)COLOURED(upcolorR, upcolorG, upcolorB)style(line,2)
ENDIF
IF low[prdleftExt] = lowest[prdleftExt*2+1](low) THEN
   pvlExt = low[prdleftExt]
   pvlxExt = barindex[prdleftExt]
   drawpoint(pvlxExt,pvlExt,5)coloured("orange",50)
   drawsegment(pvlxExt,pvlExt,barindex,pvlExt)COLOURED(downcolorR, downcolorG, downcolorB)style(line,2)
ENDIF

IF pvhExt > 0 THEN
   phExt = pvhExt
ENDIF
IF pvlExt > 0 THEN
   plExt = pvlExt
ENDIF
//---------------------------------------------
// --- Zone Calculation ---
//---------------------------------------------
ma = average[prdleftExt](close)
atr = averagetruerange[prdleftExt]

ma2 = undefined
ma3 = undefined

IF ms > 0 AND ms[1] > 0 THEN
   ma2 = ma - atr * dist
   ma3 = ma2 + atr
   r=upcolorR
   g=upcolorG
   b=upcolorB
elsif ms < 0 AND ms[1] < 0 THEN
   ma2 = ma + atr * dist
   ma3 = ma2 - atr
   r=downcolorR
   g=downcolorG
   b=downcolorB
else
   ma2 = undefined
   ma3 = undefined
ENDIF
//---------------------------------------------
// --- Visual Outputs ---
//---------------------------------------------
// 1. Plot Signals on Price Chart
atrOffset = atr * 0.5
IF longsig THEN
   DRAWARROWUP(barindex, low - atrOffset) COLOURED(upcolorR, upcolorG, upcolorB)
ENDIF
IF longsig2 THEN
   drawtext("▲",barindex, low-0.15*atr)COLOURED(upcolorR, upcolorG, upcolorB)
ENDIF
IF shortsig THEN
   DRAWARROWDOWN(barindex, high + atrOffset) COLOURED(downcolorR, downcolorG, downcolorB)
ENDIF
IF shortsig2 THEN
   drawtext("▼",barindex, high+0.15*atr) COLOURED(downcolorR, downcolorG, downcolorB)
ENDIF
IF longexit THEN
   drawtext("▼",barindex, high+0.15*atr)COLOURED(graycolorR, graycolorG, graycolorB)
ENDIF
IF shortexit THEN
   drawtext("▲",barindex, low-0.15*atr)COLOURED(graycolorR, graycolorG, graycolorB)
ENDIF
// 2. Conditional Zone Plots
zoneMa2 = undefined
zoneMa3 = undefined
IF showZone = 1 THEN
   zoneMa2 = ma2
   zoneMa3 = ma3
ENDIF

if islastbarupdate then
   drawsegment(currentlx,currentl,barindex+5,currentl)COLOURED(downcolorR, downcolorG, downcolorB)style(dottedline)
   drawsegment(currenthx,currenth,barindex+5,currenth)COLOURED(upcolorR, upcolorG, upcolorB)style(dottedline)
   drawsegment(pvlxExt,pvlExt,barindex+5,pvlExt)COLOURED(downcolorR, downcolorG, downcolorB)style(line,2)
   drawsegment(pvhxExt,pvhExt,barindex+5,pvhExt)COLOURED(upcolorR, upcolorG, upcolorB)style(line,2)
endif
//---------------------------------------------
RETURN zoneMa2 AS "External Zone"coloured(r,g,b)style(line,2), zoneMa3 AS "Internal Zone"coloured(r,g,b,100)style(line,1)
