





Three & Four Bar Reversal Pattern with Projected Breakout Levels
Introduction
Short pullbacks inside a move often end with the same footprint: two candles against the move, then one strong candle that wipes them out. The Three & Four Bar Reversal Pattern indicator by suryaparamartha spots that footprint on the price chart, in a three-candle and an optional four-candle version, and marks the level that was broken.
That level is then projected forward as a reference line. It stays on the chart until price comes back to it, which makes it a natural place for a limit order on a retest.
Theory Behind the Indicator
3-bar reversal. Two consecutive candles of the same colour followed by a candle of the opposite colour that closes beyond the first one:
- Bullish: two bearish candles, then a bullish candle that closes above the high of the first bearish candle.
- Bearish: two bullish candles, then a bearish candle that closes below the low of the first bullish candle.
4-bar reversal (optional). A slower version of the same idea, where the turn takes two candles:
- Two small candles of the same colour.
- A transition candle of the opposite colour that has not yet broken the first candle on its own (if it had, it would already be a 3-bar reversal).
- A breakout candle of the same colour as the transition candle, with a body larger than the bodies of the three previous candles together, closing beyond the high (bullish) or the low (bearish) of the first candle.
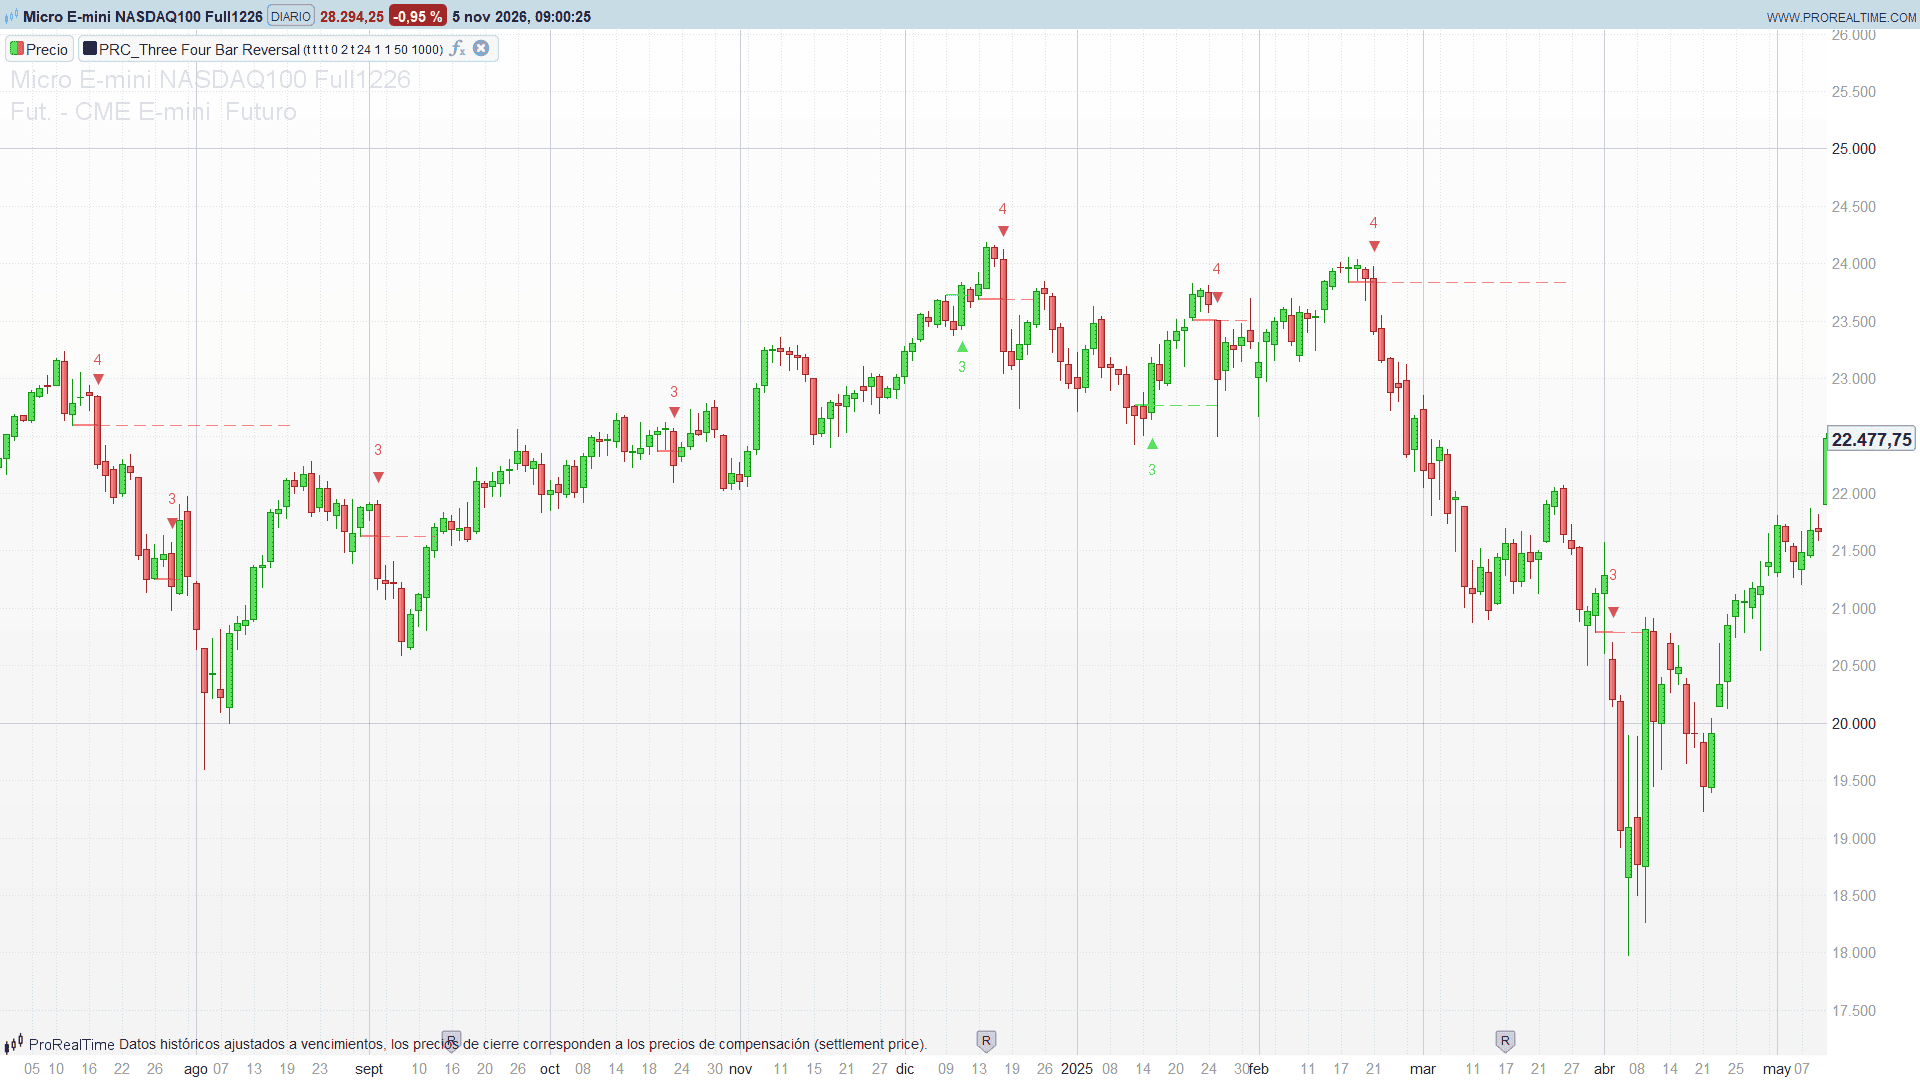
In both cases, the high (bullish) or low (bearish) of the first candle is the breakout level. A solid segment joins that candle to the signal candle, and a dashed projection extends the level to the right. The projection stops on the first later bar that trades through the level again, or after 24 bars.
Key Features at a Glance
- 3-bar reversal detection, bullish and bearish.
- Optional 4-bar reversal detection with a strong-body filter.
- Triangle markers labelled “3” or “4”, below the bar for bullish signals and above it for bearish ones.
- Breakout segment at the broken level, with its own style and width.
- Forward projection of the level that stops at the first retest or after a maximum length.
- Bullish and bearish signals can be shown or hidden separately.
How to Read the Indicator
- Green triangle below a bar: bullish reversal on that candle. The number tells which pattern fired.
- Red triangle above a bar: bearish reversal.
- Solid segment: the level the signal candle closed through.
- Dashed projection: the same level, still untested. When it stops before its maximum length, price has come back to it.
Practical Applications
- Pullback entries in a trend: in an uptrend, a bullish 3-bar reversal after a dip signals that the pullback is likely over.
- Retest orders: the projection marks where a limit order can wait for price to come back to the breakout level.
- Stops: the extreme of the pattern candles gives a natural place for a protective stop.
- Filter with context: the pattern is frequent on its own; combining it with trend direction, support and resistance or volume improves its quality.
Indicator Configuration
- showBullish (default 1): show bullish reversals.
- showBearish (default 1): show bearish reversals.
- show4Bar (default 0): also detect the 4-bar pattern.
- showRefLine (default 1): show the breakout segment.
- bStyle (default 0): breakout segment style. 0 = solid, 1 = dashed, 2 = dotted.
- bWidth (default 2): breakout segment width, 1 to 5.
- extendRefLine (default 1): project the breakout level forward.
- extendLength (default 24): maximum length of the projection, in bars.
- eStyle (default 1): projection style. 0 = solid, 1 = dashed, 2 = dotted.
- eWidth (default 1): projection width, 1 to 5.
- maxLines (default 50): number of most recent reference lines kept on the chart (each signal uses two: segment and projection).
- maxSignals (default 1000): number of most recent signals labelled on the chart.
- Bullish and bearish colours (buR/buG/buB, beR/beG/beB) at the top of the code.
The Code
//---------------------------------------------------------------
// PRC_Three Four Bar Reversal
// version = 0
// 05.11.2026
// Iván González @ www.prorealcode.com
// Author: suryaparamartha
// Sharing ProRealTime knowledge
//--------------------------------------------------------------------//
// 3-bar reversal: two candles of the same colour followed by a candle of the
// opposite colour that closes beyond the high (bullish) or the low (bearish)
// of the first one.
// 4-bar reversal (optional): two small candles of the same colour, a
// transition candle of the opposite colour that has NOT broken the first
// candle yet, and a breakout candle of the same colour as the transition one,
// with a body larger than the three previous bodies together, that closes
// beyond the high/low of the first candle.
// Each signal draws a reference line at the breakout level and projects it
// forward until price touches the level again or Extend Length is reached.
//--------------------------------------------------------------------//
defparam drawonlastbaronly = true

// ===================== INPUTS =====================
// --- General ---
showBullish = 1       // 1 = show bullish reversals
showBearish = 1       // 1 = show bearish reversals
// --- 4-bar pattern ---
show4Bar = 0          // 1 = also detect the 4-candle reversal pattern
// --- Reference line ---
showRefLine = 1       // 1 = show the breakout segment
bStyle = 0            // breakout line style: 0 = solid, 1 = dashed, 2 = dotted
bWidth = 2            // breakout line width (1 to 5)
extendRefLine = 1     // 1 = project the breakout level forward
extendLength = 24     // maximum length of the projection, in bars
eStyle = 1            // extended line style: 0 = solid, 1 = dashed, 2 = dotted
eWidth = 1            // extended line width (1 to 5)
maxLines = 50         // most recent reference lines kept on the chart
maxSignals = 1000     // most recent signals labelled on the chart

// Colours
buR = 0
buG = 230
buB = 118
beR = 242
beG = 54
beB = 69

// ===================== DETECTION =====================
bull3 = 0
bear3 = 0
bull4 = 0
bear4 = 0
IF barindex >= 2 THEN
   IF showBullish = 1 AND close[2] < open[2] AND close[1] < open[1] AND close > open AND close > high[2] THEN
      bull3 = 1
   ENDIF
   IF showBearish = 1 AND close[2] > open[2] AND close[1] > open[1] AND close < open AND close < low[2] THEN
      bear3 = 1
   ENDIF
ENDIF
IF barindex >= 3 AND show4Bar = 1 THEN
   body0 = abs(close - open)
   bodies = abs(close[3] - open[3]) + abs(close[2] - open[2]) + abs(close[1] - open[1])
   // the transition candle must not have broken the first candle on its own
   // (that would already be a separate 3-bar signal)
   IF showBullish = 1 AND close[3] < open[3] AND close[2] < open[2] AND close[1] > open[1] AND close > open THEN
      IF close[1] <= high[3] AND body0 > bodies AND close > high[3] THEN
         bull4 = 1
      ENDIF
   ENDIF
   IF showBearish = 1 AND close[3] > open[3] AND close[2] > open[2] AND close[1] < open[1] AND close < open THEN
      IF close[1] >= low[3] AND body0 > bodies AND close < low[3] THEN
         bear4 = 1
      ENDIF
   ENDIF
ENDIF

IF barindex >= 13 THEN
   offV = averagetruerange[14](close)
ELSE
   offV = high - low
ENDIF

// ===================== SIGNAL STORE =====================
// One signal per bar at most (a bullish and a bearish pattern cannot share a candle, nor a
// 3-bar and a 4-bar one of the same side). Pure assignment on the slot nSig: if a signal
// shows up on one tick and vanishes on the next, nSig rewinds and the slot is reused.
ONCE nSig = 0
newSig = 0
IF bull3 = 1 THEN
   newSig = 1
   sgDir = 1
   sgTyp = 3
   sgLvl = high[2]
   sgStart = barindex - 2
ELSIF bear3 = 1 THEN
   newSig = 1
   sgDir = 0 - 1
   sgTyp = 3
   sgLvl = low[2]
   sgStart = barindex - 2
ELSIF bull4 = 1 THEN
   newSig = 1
   sgDir = 1
   sgTyp = 4
   sgLvl = high[3]
   sgStart = barindex - 3
ELSIF bear4 = 1 THEN
   newSig = 1
   sgDir = 0 - 1
   sgTyp = 4
   sgLvl = low[3]
   sgStart = barindex - 3
ENDIF
IF newSig = 1 THEN
   $sBar[nSig] = barindex
   $sDir[nSig] = sgDir
   $sTyp[nSig] = sgTyp
   $sLvl[nSig] = sgLvl
   $sStart[nSig] = sgStart
   $sHigh[nSig] = high
   $sLow[nSig] = low
   $sOff[nSig] = offV
   $eEnd[nSig] = 0 - 1
   nSig = nSig + 1
ENDIF

// ===================== EXTENDED LINES =====================
// A projection stops on the first later bar that touches its level, or when it is
// extendLength bars long. A touch can only appear during a bar (the high only rises and
// the low only falls), so the end bar is re-evaluated while it is open (-1) or set on
// this very bar: the last tick leaves what the close of the bar would leave.
IF extendRefLine = 1 AND nSig > 0 THEN
   kLo = max(0, nSig - extendLength - 2)
   FOR k = nSig - 1 DOWNTO kLo DO
      IF $sBar[k] >= barindex - extendLength THEN
         IF $eEnd[k] = 0 - 1 OR $eEnd[k] >= barindex THEN
            lvK = $sLvl[k]
            gone = 0
            IF barindex > $sBar[k] THEN
               IF low <= lvK AND high >= lvK THEN
                  gone = 1
               ENDIF
               IF barindex - $sBar[k] >= extendLength THEN
                  gone = 1
               ENDIF
            ENDIF
            IF gone = 1 THEN
               $eEnd[k] = barindex
            ELSE
               $eEnd[k] = 0 - 1
            ENDIF
         ENDIF
      ENDIF
   NEXT
ENDIF

// ===================== DRAWING =====================
IF islastbarupdate AND nSig > 0 THEN
   // Signal markers: triangle below the bar (bullish) or above it (bearish) and the pattern size
   kLo = max(0, nSig - maxSignals)
   FOR k = nSig - 1 DOWNTO kLo DO
      xS = $sBar[k]
      ofK = $sOff[k]
      IF $sDir[k] = 1 THEN
         yT = $sLow[k] - 0.5 * ofK
         yN = $sLow[k] - 1.1 * ofK
         DRAWTEXT("▲", xS, yT) COLOURED(buR, buG, buB, 255)
         IF $sTyp[k] = 3 THEN
            DRAWTEXT("3", xS, yN) COLOURED(buR, buG, buB, 255)
         ELSE
            DRAWTEXT("4", xS, yN) COLOURED(buR, buG, buB, 255)
         ENDIF
      ELSE
         yT = $sHigh[k] + 0.5 * ofK
         yN = $sHigh[k] + 1.1 * ofK
         DRAWTEXT("▼", xS, yT) COLOURED(beR, beG, beB, 255)
         IF $sTyp[k] = 3 THEN
            DRAWTEXT("3", xS, yN) COLOURED(beR, beG, beB, 255)
         ELSE
            DRAWTEXT("4", xS, yN) COLOURED(beR, beG, beB, 255)
         ENDIF
      ENDIF
   NEXT

   // Reference lines: the maxLines most recent ones. Each signal creates its breakout segment
   // first and then its projection, so walking back from the newest signal the projection
   // comes before the breakout segment.
   budget = maxLines
   k = nSig - 1
   WHILE budget > 0 AND k >= 0 DO
      IF $sDir[k] = 1 THEN
         lnR = buR
         lnG = buG
         lnB = buB
      ELSE
         lnR = beR
         lnG = beG
         lnB = beB
      ENDIF
      yL = $sLvl[k]
      IF extendRefLine = 1 AND budget > 0 THEN
         xA = $sBar[k]
         IF $eEnd[k] = 0 - 1 THEN
            xB = barindex
         ELSE
            xB = $eEnd[k]
         ENDIF
         IF xB > xA THEN
            IF eStyle = 0 THEN
               IF eWidth <= 1 THEN
                  DRAWSEGMENT(xA, yL, xB, yL) COLOURED(lnR, lnG, lnB, 153) STYLE(line, 1)
               ELSIF eWidth <= 2 THEN
                  DRAWSEGMENT(xA, yL, xB, yL) COLOURED(lnR, lnG, lnB, 153) STYLE(line, 2)
               ELSIF eWidth <= 3 THEN
                  DRAWSEGMENT(xA, yL, xB, yL) COLOURED(lnR, lnG, lnB, 153) STYLE(line, 3)
               ELSIF eWidth <= 4 THEN
                  DRAWSEGMENT(xA, yL, xB, yL) COLOURED(lnR, lnG, lnB, 153) STYLE(line, 4)
               ELSE
                  DRAWSEGMENT(xA, yL, xB, yL) COLOURED(lnR, lnG, lnB, 153) STYLE(line, 5)
               ENDIF
            ELSIF eStyle = 1 THEN
               IF eWidth <= 1 THEN
                  DRAWSEGMENT(xA, yL, xB, yL) COLOURED(lnR, lnG, lnB, 153) STYLE(dottedline2, 1)
               ELSIF eWidth <= 2 THEN
                  DRAWSEGMENT(xA, yL, xB, yL) COLOURED(lnR, lnG, lnB, 153) STYLE(dottedline2, 2)
               ELSIF eWidth <= 3 THEN
                  DRAWSEGMENT(xA, yL, xB, yL) COLOURED(lnR, lnG, lnB, 153) STYLE(dottedline2, 3)
               ELSIF eWidth <= 4 THEN
                  DRAWSEGMENT(xA, yL, xB, yL) COLOURED(lnR, lnG, lnB, 153) STYLE(dottedline2, 4)
               ELSE
                  DRAWSEGMENT(xA, yL, xB, yL) COLOURED(lnR, lnG, lnB, 153) STYLE(dottedline2, 5)
               ENDIF
            ELSE
               IF eWidth <= 1 THEN
                  DRAWSEGMENT(xA, yL, xB, yL) COLOURED(lnR, lnG, lnB, 153) STYLE(dottedline, 1)
               ELSIF eWidth <= 2 THEN
                  DRAWSEGMENT(xA, yL, xB, yL) COLOURED(lnR, lnG, lnB, 153) STYLE(dottedline, 2)
               ELSIF eWidth <= 3 THEN
                  DRAWSEGMENT(xA, yL, xB, yL) COLOURED(lnR, lnG, lnB, 153) STYLE(dottedline, 3)
               ELSIF eWidth <= 4 THEN
                  DRAWSEGMENT(xA, yL, xB, yL) COLOURED(lnR, lnG, lnB, 153) STYLE(dottedline, 4)
               ELSE
                  DRAWSEGMENT(xA, yL, xB, yL) COLOURED(lnR, lnG, lnB, 153) STYLE(dottedline, 5)
               ENDIF
            ENDIF
         ENDIF
         budget = budget - 1
      ENDIF
      IF showRefLine = 1 AND budget > 0 THEN
         xC = $sStart[k]
         xD = $sBar[k]
         IF xD > xC THEN
            IF bStyle = 0 THEN
               IF bWidth <= 1 THEN
                  DRAWSEGMENT(xC, yL, xD, yL) COLOURED(lnR, lnG, lnB, 153) STYLE(line, 1)
               ELSIF bWidth <= 2 THEN
                  DRAWSEGMENT(xC, yL, xD, yL) COLOURED(lnR, lnG, lnB, 153) STYLE(line, 2)
               ELSIF bWidth <= 3 THEN
                  DRAWSEGMENT(xC, yL, xD, yL) COLOURED(lnR, lnG, lnB, 153) STYLE(line, 3)
               ELSIF bWidth <= 4 THEN
                  DRAWSEGMENT(xC, yL, xD, yL) COLOURED(lnR, lnG, lnB, 153) STYLE(line, 4)
               ELSE
                  DRAWSEGMENT(xC, yL, xD, yL) COLOURED(lnR, lnG, lnB, 153) STYLE(line, 5)
               ENDIF
            ELSIF bStyle = 1 THEN
               IF bWidth <= 1 THEN
                  DRAWSEGMENT(xC, yL, xD, yL) COLOURED(lnR, lnG, lnB, 153) STYLE(dottedline2, 1)
               ELSIF bWidth <= 2 THEN
                  DRAWSEGMENT(xC, yL, xD, yL) COLOURED(lnR, lnG, lnB, 153) STYLE(dottedline2, 2)
               ELSIF bWidth <= 3 THEN
                  DRAWSEGMENT(xC, yL, xD, yL) COLOURED(lnR, lnG, lnB, 153) STYLE(dottedline2, 3)
               ELSIF bWidth <= 4 THEN
                  DRAWSEGMENT(xC, yL, xD, yL) COLOURED(lnR, lnG, lnB, 153) STYLE(dottedline2, 4)
               ELSE
                  DRAWSEGMENT(xC, yL, xD, yL) COLOURED(lnR, lnG, lnB, 153) STYLE(dottedline2, 5)
               ENDIF
            ELSE
               IF bWidth <= 1 THEN
                  DRAWSEGMENT(xC, yL, xD, yL) COLOURED(lnR, lnG, lnB, 153) STYLE(dottedline, 1)
               ELSIF bWidth <= 2 THEN
                  DRAWSEGMENT(xC, yL, xD, yL) COLOURED(lnR, lnG, lnB, 153) STYLE(dottedline, 2)
               ELSIF bWidth <= 3 THEN
                  DRAWSEGMENT(xC, yL, xD, yL) COLOURED(lnR, lnG, lnB, 153) STYLE(dottedline, 3)
               ELSIF bWidth <= 4 THEN
                  DRAWSEGMENT(xC, yL, xD, yL) COLOURED(lnR, lnG, lnB, 153) STYLE(dottedline, 4)
               ELSE
                  DRAWSEGMENT(xC, yL, xD, yL) COLOURED(lnR, lnG, lnB, 153) STYLE(dottedline, 5)
               ENDIF
            ENDIF
         ENDIF
         budget = budget - 1
      ENDIF
      k = k - 1
   WEND
ENDIF

RETURN