
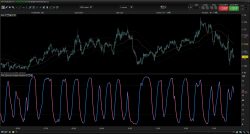
Here is another derivated indicator of the stair step moving average exploration. This time the stairstep MA (the main trend) represent the center of the oscillator. The signal line (white line on screenshot attached) is the difference between this center and a simple moving average of 7 periods by default.
Trade signals seems pretty effective on tick charts representation (DAX/GER30 100 or 20 ticks for example). Take long when signal line cross above zero and short below it. Of course, as always objectives and stoploss protection are your responsabilities 🙂
You can play with different parameters to sweet any other instruments.
|
1 2 3 4 5 6 7 8 9 10 11 12 13 14 15 16 17 18 19 20 21 22 |
//parameters : //percent = 1 //mainperiod = 100 //signalperiod = 7 once ssMA = close MA = TriangularAverage[mainperiod](close) if(MA > ssMA + (MA/100)*percent) THEN ssMA = MA ELSIF (MA < ssMA - (MA/100)*percent) THEN ssMA = MA ELSE ssMA = ssMA ENDIF signalLine = average[signalperiod](close) linedraw = signalLine - ssMA RETURN linedraw as "scalp line", 0 as "center line" |
Share this
No information on this site is investment advice or a solicitation to buy or sell any financial instrument. Past performance is not indicative of future results. Trading may expose you to risk of loss greater than your deposits and is only suitable for experienced investors who have sufficient financial means to bear such risk.
ProRealTime ITF files and other attachments :
Find other exclusive trading pro-tools on ![]()
PRC is also on YouTube, subscribe to our channel for exclusive content and tutorials


Bonjour,
Je trouve votre indicateur très intéressant. J’ai essayé de créer un autre indicateur qui appelle celui-ci pour lisser la courbe “scalping line” mais il ne se passe rien. Y a t’il un moyen de faire un fichier log ou de créer un message pour visualiser les variables ? Je vous poste mon code si vous avez un moment. Je vous en remercie par avance.
// Scalping Line Lissée
// Utilise Scalping Line et en fait la moyenne mobile
//parameters of Scalping Line Indicator
//percent = 1
//mainperiod = 100
//signalperiod = 7
//MMPeriod = 2
numerateur = 0
For i = MMPeriod to 0
linedraw, ignored = CALL \"Scalping line\"[percent, mainperiod, signalperiod]
numerateur = numerateur + linedraw
NEXT
moyenne = numerateur / (MMPeriod + 1)
RETURN moyenne as \"scalp line lisse\", 0 as \"center line\"
Pour visualiser une variable, il suffit de l’ajouter dans la fonction RETURN et la plateforme l’affichera tout simplement 🙂
Pour lisser une information issue d’une variable, tu peux utiliser un indicateur de moyenne mobile existant dans la plateforme comme ceci :
lissage = average[20](linedraw)
Où 20 est la période de lissage.
Hello Nicolas, Is this script Ninjatrader Compatible ?