

Ross Hook Pattern Indicator
Introduction
If you are a price action trader, you have likely heard of Joe Ross and his famous trading concepts. One of his most powerful contributions to technical analysis is the Ross Hook Pattern.
The Ross Hook is essentially a trend continuation pattern that occurs right after a 1-2-3 reversal setup. It is designed to catch the explosive momentum that often follows a successful market structure shift. Because spotting these setups manually requires a highly trained eye, we are sharing a complete custom indicator designed by Zeiirman that automatically detects and plots the Ross Hook pattern on your charts.
How the Indicator Works
To understand the indicator, you first need to understand the structure it looks for. The ProBuilder code scans the market for pivot highs and pivot lows to identify a specific sequence:
- The 1-2-3 Reversal: The code first looks for a market structure shift. For a bullish setup, it detects a Higher High (HH) followed by a Higher Low (HL). For a bearish setup, it looks for a Lower Low (LL) followed by a Lower High (LH).
- The First Hook: This is the correction phase after the new extreme is made.
- The Ross Hook Breakout: Once the 1-2-3 pattern is validated, the indicator waits for the price to break the extreme of the “Hook” (the previous pivot high in a bullish scenario, or the previous pivot low in a bearish scenario).
When this breakout occurs, the indicator triggers a signal, confirming the trend continuation.
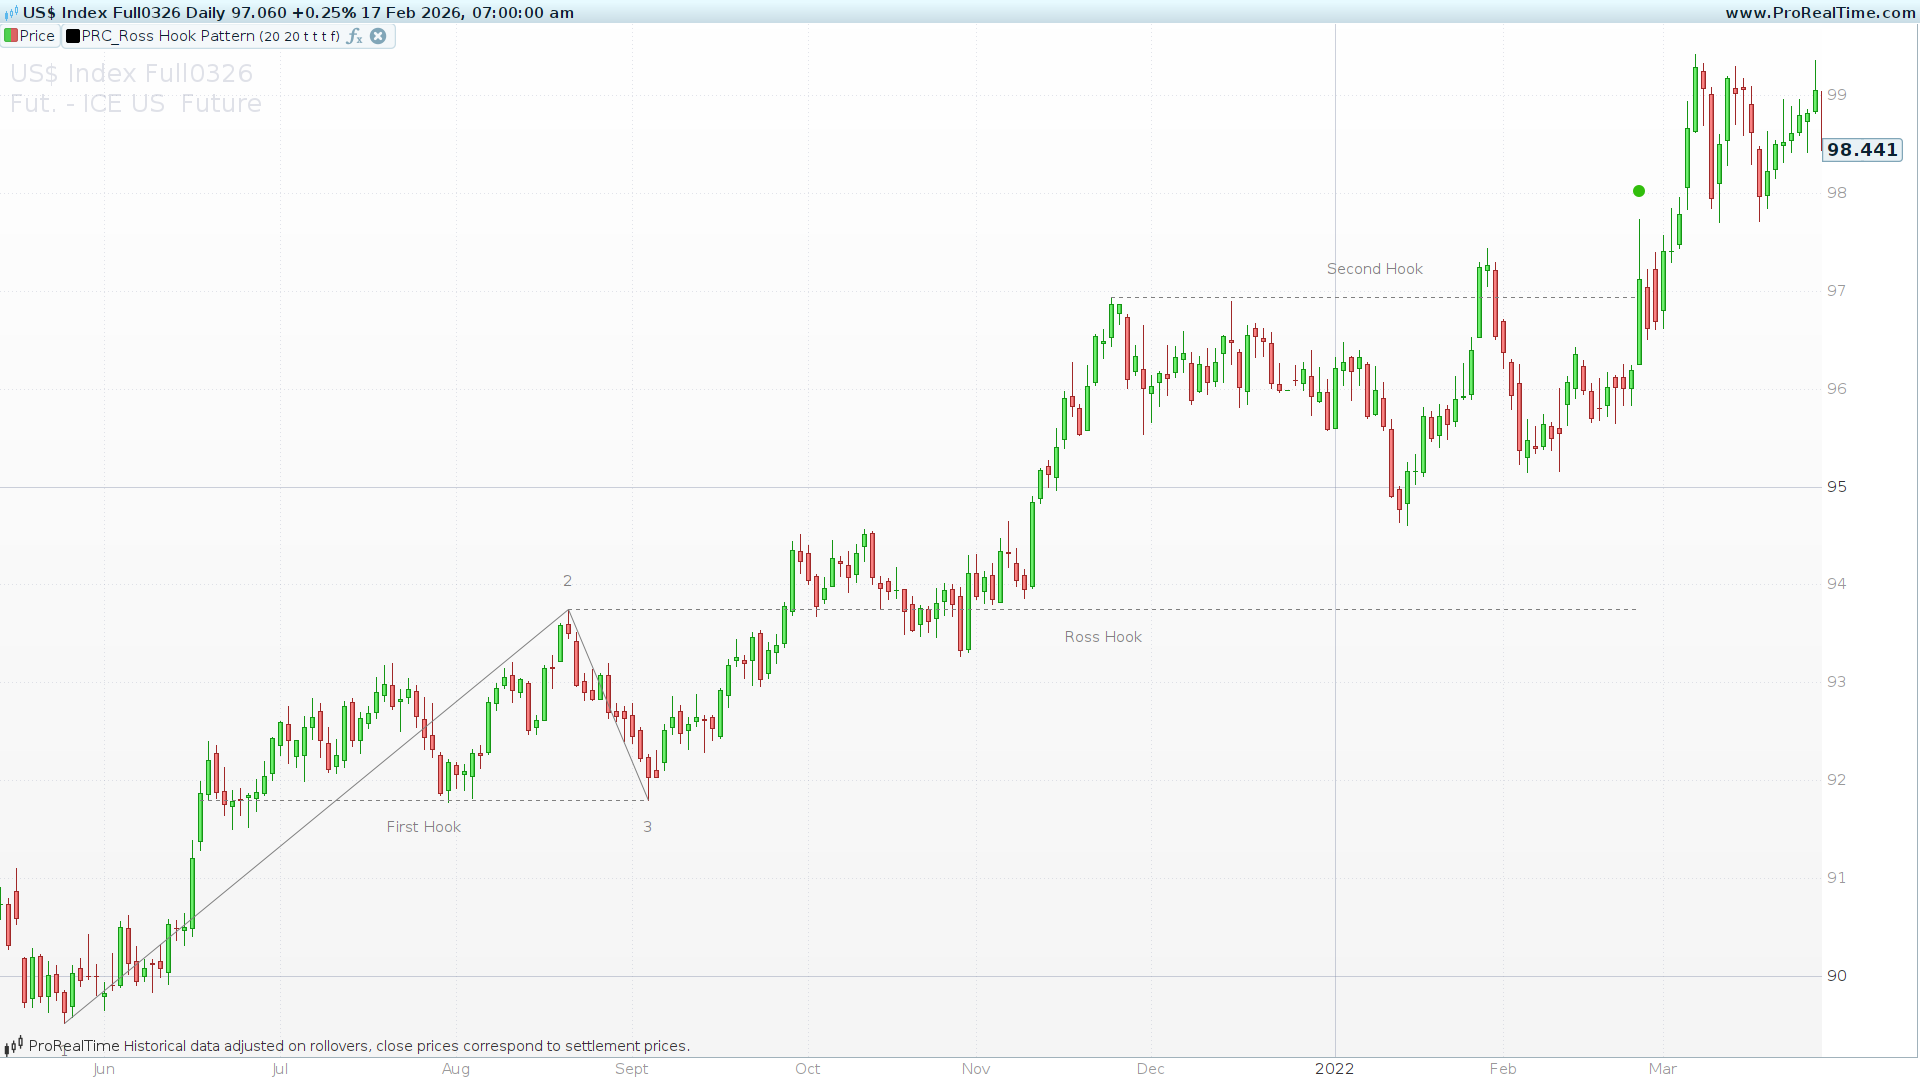
Visual Features on Your Chart
This indicator is highly visual and takes full advantage of ProRealTime’s graphical capabilities. Depending on your settings, it can plot:
- HH/HL/LH/LL Labels: To help you read the market structure dynamically.
- Pattern Numbering (1-2-3): Clearly marks the anchor points of the reversal.
- Hook Lines: Dotted lines projecting the resistance/support levels of the hooks.
- Breakout Signals: Colored dots plotted precisely on the candle that breaks the Ross Hook, giving you a clear entry signal.
Configuration and Parameters
One of the best things about this code is its flexibility. You can tweak the variables to suit your timeframe and trading style:
prd(Pivot Period – Default: 20): This is the core engine of the indicator. It defines the lookback period to calculate pivot highs and lows. A smaller number (e.g., 5 or 10) will detect micro-trends and generate more signals. A higher number (e.g., 20 or 50) will filter out the noise and only highlight major macro-structural shifts.dst(Minimum Distance – Default: 20): This parameter defines the minimum distance between point 2 and point 3 of the pattern, ensuring the indicator only picks up well-proportioned setups.showBreak(Default: 1): Set to1to display the breakout point signal, or0to hide it.showHook(Default: 1): Toggles the horizontal dotted line of the Ross Hook level.showPattern(Default: 0): Set to1if you want the indicator to draw the full 1-2-3 zigzag lines and hook labels on your chart. Great for studying past setups!showPvts(Default: 0): Set to1to display the Higher High / Lower Low market structure text labels.
Practical Application
The Ross Hook is traditionally traded with pending stop orders placed just above (or below) the Hook level. The breakout signal provided by this indicator aligns perfectly with this methodology. It works exceptionally well in trending markets, whether you are scalping on a 5-minute chart or swing trading on a Daily timeframe.
ProBuilder Code
// -----------------------------------------------------
// PRC_Ross Hook Pattern (Expo) by Zeiierman
// version = 0
// 18.02.2026
// Iván González @ www.prorealcode.com
// Sharing ProRealTime knowledge
// -----------------------------------------------------
// === PARAMETERS ===
// -----------------------------------------------------
prd = 20 // Pivot period (high=long-term, low=short-term)
dst = 20 // Min distance between point 2 and point 3

showBreak = 1   // 1=Show break signal, 0=Hide
showHook = 1    // 1=Show Ross Hook line, 0=Hide
showPattern = 0 // 1=Show full pattern (1-2-3 + hooks), 0=Hide
showPvts = 0    // 1=Show HH/HL/LH/LL labels, 0=Hide

// Break signal colors (RGB)
rBull = 49
gBull = 190
bBull = 12
rBear = 223
gBear = 61
bBear = 61
// -----------------------------------------------------
// === INITIALIZATION ===
// -----------------------------------------------------
once pvt0 = undefined
once pvt1 = undefined
once pvt2 = undefined
once pvt3 = undefined
once pvt4 = undefined
once idx0 = 0
once idx1 = 0
once idx2 = 0
once idx3 = 0
once idx4 = 0
once pos = 0
once hook = 1

// Label offset for positioning above/below price
atrVal = averagetruerange[14]
offset = atrVal * 0.5
// -----------------------------------------------------
// === PIVOT DETECTION ===
// -----------------------------------------------------
if barindex >= 2 * prd + 1 then
   isPvtHi = (high[prd] = highest[2 * prd + 1](high))
   isPvtLo = (low[prd] = lowest[2 * prd + 1](low))

   // --- Pivot High detected ---
   if isPvtHi and pos <= 0 then
      // HH/LH label
      if showPvts and pvt1 <> undefined then
         if high[prd] > pvt1 then
            drawtext("HH", barindex - prd, high[prd] + offset) coloured(128, 128, 128)
         else
            drawtext("LH", barindex - prd, high[prd] + offset) coloured(128, 128, 128)
         endif
      endif
      // Shift arrays
      pvt4 = pvt3
      idx4 = idx3
      pvt3 = pvt2
      idx3 = idx2
      pvt2 = pvt1
      idx2 = idx1
      pvt1 = pvt0
      idx1 = idx0
      pvt0 = high[prd]
      idx0 = barindex - prd
      pos = 1
   endif

   // --- Pivot Low detected ---
   if isPvtLo and pos >= 0 then
      // HL/LL label
      if showPvts and pvt1 <> undefined then
         if low[prd] > pvt1 then
            drawtext("HL", barindex - prd, low[prd] - offset) coloured(128, 128, 128)
         else
            drawtext("LL", barindex - prd, low[prd] - offset) coloured(128, 128, 128)
         endif
      endif
      // Shift arrays
      pvt4 = pvt3
      idx4 = idx3
      pvt3 = pvt2
      idx3 = idx2
      pvt2 = pvt1
      idx2 = idx1
      pvt1 = pvt0
      idx1 = idx0
      pvt0 = low[prd]
      idx0 = barindex - prd
      pos = -1
   endif
endif
// -----------------------------------------------------
// === BULLISH ROSS HOOK DETECTION ===
// -----------------------------------------------------
if pvt1 <> undefined and pvt4 <> undefined then
   // Crossover: high crosses above pvt1
   bullCross = (high > pvt1 and high[1] <= pvt1[1])
   if bullCross and hook = 1 then
      // pvt0 < pvt1 = correction after high (pullback)
      if pvt0 < pvt1 then
         // Validate structure: HH-HL sequence
         // pvt1>pvt3 (higher high), pvt0>pvt2 (higher low)
         // pvt2>pvt4 (higher low), pvt3>pvt2 (high above low)
         if pvt1 > pvt3 and pvt0 > pvt2 and pvt2 > pvt4 and pvt3 > pvt2 then
            if barindex - idx1 >= prd then
               // Search for First Hook between point 4 and point 3
               first = barindex - idx4
               sec = barindex - idx3
               foundHook = 0
               hookBar = 0
               for i = first downto sec do
                  if close[i] > pvt2 and (idx2 - barindex + i) >= dst then
                     foundHook = 1
                     hookBar = i
                     break
                  endif
               next
               if foundHook = 1 then
                  // --- Draw First Hook line ---
                  if showPattern then
                     drawsegment(barindex - hookBar, pvt2, idx2, pvt2) coloured(128, 128, 128) style(dottedline)
                     midFH = round((barindex - hookBar + idx2) / 2)
                     drawtext("First Hook", midFH, pvt2 - offset) coloured(128, 128, 128)
                  endif
                  // --- Draw Break signal ---
                  if showBreak then
                     drawpoint(barindex, high + offset, 3) coloured(rBull, gBull, bBull)
                  endif
                  // --- Draw Ross Hook line ---
                  if showHook then
                     drawsegment(idx3, pvt3, barindex, pvt3) coloured(128, 128, 128) style(dottedline)
                     midRH = round((barindex + idx3) / 2)
                     drawtext("Ross Hook", midRH, pvt3 - offset) coloured(128, 128, 128)
                  endif
                  // --- Draw full pattern ---
                  if showPattern then
                     // Second Hook line
                     drawsegment(idx1, pvt1, barindex, pvt1) coloured(128, 128, 128) style(dottedline)
                     midSH = round((barindex + idx1) / 2)
                     drawtext("Second Hook", midSH, pvt1 + offset) coloured(128, 128, 128)
                     // Pattern points 1-2-3
                     drawtext("1", idx4, pvt4 - offset) coloured(128, 128, 128)
                     drawtext("2", idx3, pvt3 + offset) coloured(128, 128, 128)
                     drawtext("3", idx2, pvt2 - offset) coloured(128, 128, 128)
                     // Zigzag connecting lines
                     drawsegment(idx2, pvt2, idx3, pvt3) coloured(128, 128, 128)
                     drawsegment(idx3, pvt3, idx4, pvt4) coloured(128, 128, 128)
                  endif
               endif
               hook = 0
            endif
         endif
      endif
   endif
endif
// -----------------------------------------------------
// === BEARISH ROSS HOOK DETECTION ===
// -----------------------------------------------------
if pvt1 <> undefined and pvt4 <> undefined then
   // Crossunder: low crosses below pvt1
   bearCross = (low < pvt1 and low[1] >= pvt1[1])
   if bearCross and hook = 1 then
      // pvt0 > pvt1 = correction after low (pullback up)
      if pvt0 > pvt1 then
         // Validate structure: LL-LH sequence
         if pvt1 < pvt3 and pvt0 < pvt2 and pvt2 < pvt4 and pvt3 < pvt2 then
            if barindex - idx1 >= prd then
               // Search for First Hook between point 4 and point 3
               first = barindex - idx4
               sec = barindex - idx3
               foundHook = 0
               hookBar = 0
               for i = first downto sec do
                  if close[i] < pvt2 and (idx2 - barindex + i) >= dst then
                     foundHook = 1
                     hookBar = i
                     break
                  endif
               next
               if foundHook = 1 then
                  // --- Draw First Hook line ---
                  if showPattern then
                     drawsegment(barindex - hookBar, pvt2, idx2, pvt2) coloured(128, 128, 128) style(dottedline)
                     midFH = round((barindex - hookBar + idx2) / 2)
                     drawtext("First Hook", midFH, pvt2 + offset) coloured(128, 128, 128)
                  endif
                  // --- Draw Break signal ---
                  if showBreak then
                     drawpoint(barindex, low - offset, 3) coloured(rBear, gBear, bBear)
                  endif
                  // --- Draw Ross Hook line ---
                  if showHook then
                     drawsegment(idx3, pvt3, barindex, pvt3) coloured(128, 128, 128) style(dottedline)
                     midRH = round((barindex + idx3) / 2)
                     drawtext("Ross Hook", midRH, pvt3 + offset) coloured(128, 128, 128)
                  endif
                  // --- Draw full pattern ---
                  if showPattern then
                     // Second Hook line
                     drawsegment(idx1, pvt1, barindex, pvt1) coloured(128, 128, 128) style(dottedline)
                     midSH = round((barindex + idx1) / 2)
                     drawtext("Second Hook", midSH, pvt1 - offset) coloured(128, 128, 128)
                     // Pattern points 1-2-3
                     drawtext("1", idx4, pvt4 + offset) coloured(128, 128, 128)
                     drawtext("2", idx3, pvt3 - offset) coloured(128, 128, 128)
                     drawtext("3", idx2, pvt2 + offset) coloured(128, 128, 128)
                     // Zigzag connecting lines
                     drawsegment(idx2, pvt2, idx3, pvt3) coloured(128, 128, 128)
                     drawsegment(idx3, pvt3, idx4, pvt4) coloured(128, 128, 128)
                  endif
               endif
               hook = 0
            endif
         endif
      endif
   endif
endif
// -----------------------------------------------------
// === HOOK RESET ===
// -----------------------------------------------------
// allow new detection when pivot structure changes
if pvt1 <> pvt1[1] then
   hook = 1
endif

// -----------------------------------------------------
return
