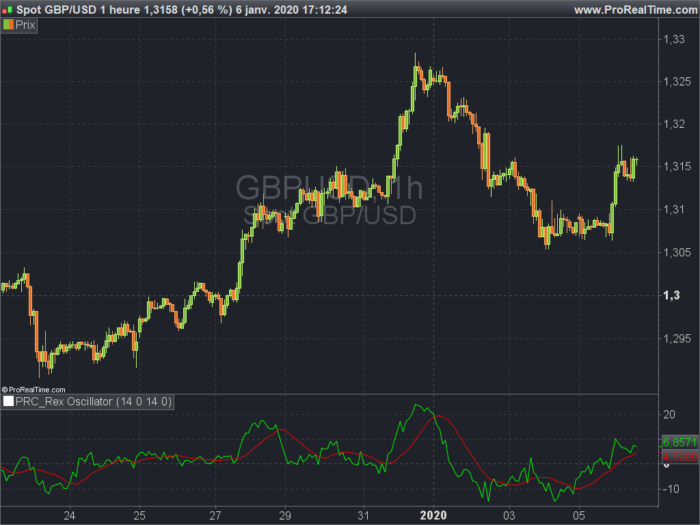
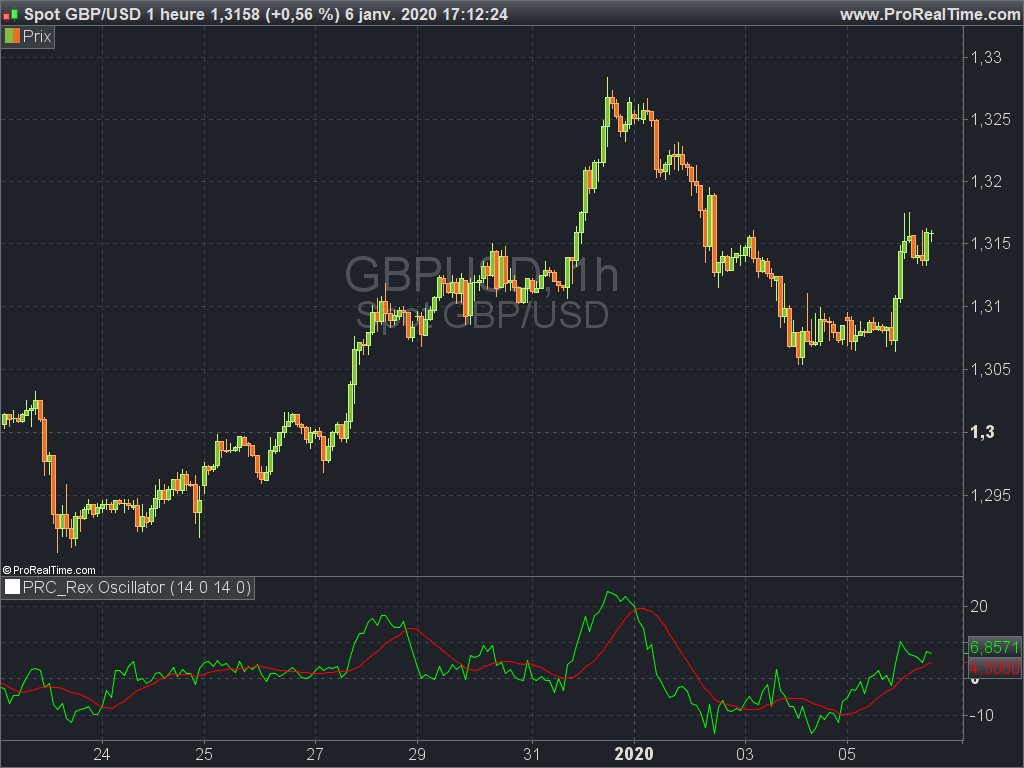
The Rex oscillator measures market behavior based on the relationship of the close to the open, high and low values of the same bar. A big difference between the high and close on a bar indicates weakness, and wide disparity between the low and close indicates strength. The difference between open and close also indicates market performance.
The True Value of a Bar (TVB) gives an indication of how healthy the market is. A negative close and a positive TVB (or vice versa) is an indication of the market building strength on the opposing side of the trend. The Rex oscillator is a moving average (SMA, EMA, WMA or SMMA) of the TVB value with the specified period.
Interpretation
When the Rex Oscillator turns positive in a bearish trend, a reversal is indicated. Likewise, Rex turning negative in a bull market indicates a reversal to the downside.
|
1 2 3 4 5 6 7 8 9 10 11 12 13 14 15 16 17 18 19 |
//PRC_Rex Oscillator | indicator //06.01.2020 //Nicolas @ www.prorealcode.com //Sharing ProRealTime knowledge //converted from MT4 code // --- settings smoothlength=14 smoothmethod=0 signallength=14 signalmethod=0 // --- end of settings TVB=3*Close-(Low+Open+High) rex=average[smoothlength,smoothmethod](tvb)/pointsize signal=average[signallength,signalmethod](rex) return rex coloured(0,255,0),signal coloured(255,0,0) |
Share this
No information on this site is investment advice or a solicitation to buy or sell any financial instrument. Past performance is not indicative of future results. Trading may expose you to risk of loss greater than your deposits and is only suitable for experienced investors who have sufficient financial means to bear such risk.
ProRealTime ITF files and other attachments :
Find other exclusive trading pro-tools on ![]()
PRC is also on YouTube, subscribe to our channel for exclusive content and tutorials


thank you Nicolas !
Thanks ! Would it be possible to translate it into a screener ?