Reversal Trap Probability Bands
Introduction
Most reversal indicators tell you when a setup appears. Very few tell you how often that particular setup has worked on the instrument you are looking at.
This indicator, originally published on pinescript by BigBeluga, does both. It draws a wide volatility envelope around price, detects traps — bars that pierce a band but close back inside it — and then keeps a running record of every signal it has ever produced, bucketed by the RSI reading at the moment of the signal. When a new trap appears, the label shows the historical hit rate of the bucket that signal belongs to.
The result is not a theoretical probability. It is the observed frequency on that symbol, that timeframe and that loaded history.
Theory Behind the Indicator
The envelope
The baseline is a 55-period EMA. The bands sit at ±4·ATR(55):
basis      = EMA(close, 55)
upper_band = basis + 4 * ATR(55)
lower_band = basis - 4 * ATR(55)
Four ATRs is deliberately wide. This is not a Bollinger-style channel that price visits several times a week; it is an outer boundary that price only reaches during a genuine stretch.
What counts as a “trap”
A bearish trap fires when price fails at the upper band. There are two ways that can happen:
- The current bar’s high breaks above the band but the close comes back inside, and the previous bar also closed inside. A single-bar rejection wick.
- The previous bar closed above the band and the current bar closes back inside. A failed breakout resolved over two bars.
Both are subject to one extra filter: price must not have spent more than trapWindow bars outside the band. This is the key idea, and it is what the name refers to. A rejection after one or two bars outside is a trap — liquidity taken, move rejected. A rejection after thirty bars riding the band is not a trap, it is a trend finally exhausting, and the statistics of the two are not comparable.
Bullish traps are the mirror image at the lower band.
A cooldown of signalGap bars between signals keeps the chart readable.
The probability engine
This is the part that makes the indicator worth translating. Every trap opens a virtual trade:
- Target: the baseline (the EMA), frozen at signal time.
- Stop: the lowest low of the last 2 bars minus 0.5·ATR(100) for longs, mirrored for shorts.
The trade stays open until price touches one of the two levels. When it resolves, the outcome is filed into the RSI bucket the signal was born in — round(RSI/10), clamped to 0..10, so eleven buckets. The next signal that lands in the same bucket displays the accumulated hit rate of that bucket.
In other words, the indicator asks: when RSI was around 30 and price got trapped at the lower band, how often did it make it back to the mean before hitting the stop?
How to Read It on the Chart
Apply the indicator on the price chart (overlay). You will see:
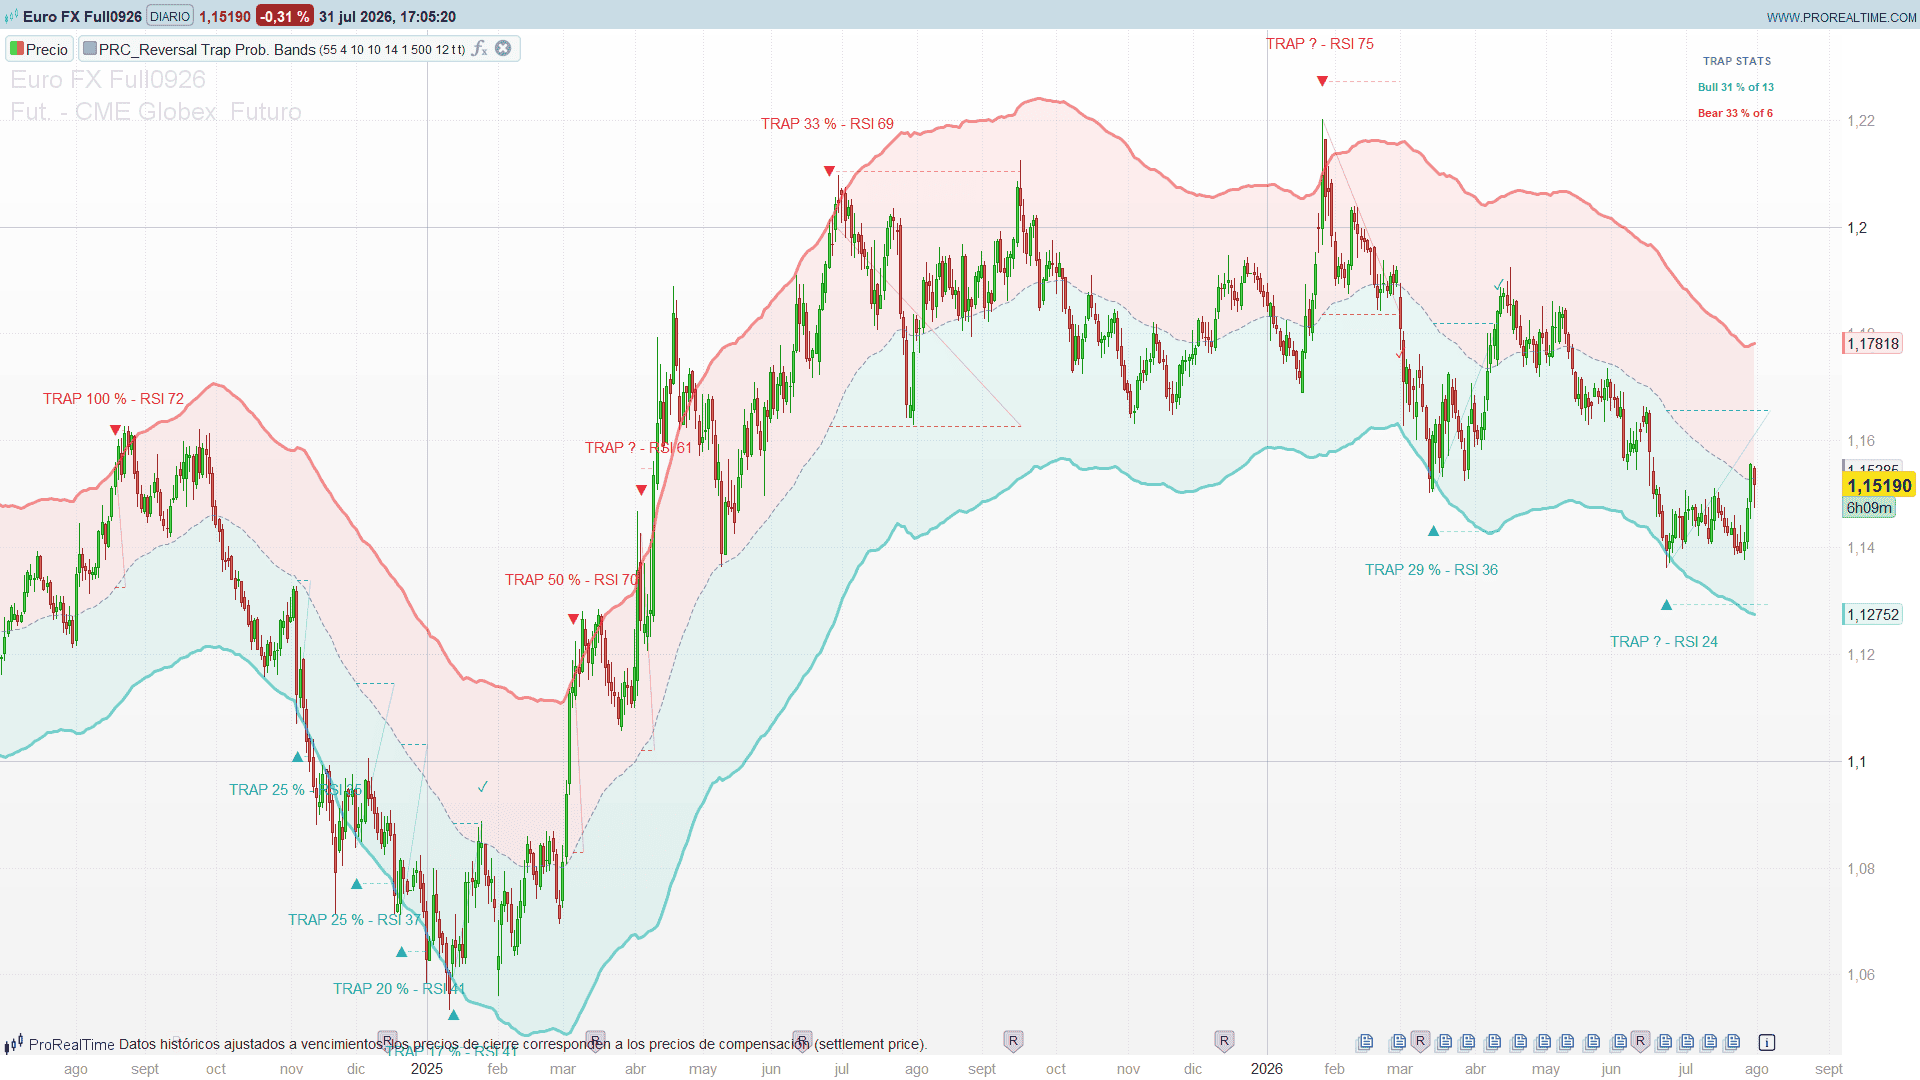
- Three lines: the two bands (red ceiling, teal floor) and the dotted baseline, each with a faint fill towards the centre.
- A ▲ or ▼ at every trap, with a second line of text below giving the historical hit rate of that RSI bucket and the RSI value itself. Signals with no history yet show
TRAP ?. - Two dotted horizontal lines per signal — target (brighter) and stop (dimmer) — plus a thin diagonal from the entry extreme to the target. They stop at the bar where the trade resolved; the open one projects five bars forward.
- A ✓ at the target of every winning trade.
- A panel in the top-right corner with the overall long and short hit rates and the sample size.
Read the sample size before the percentage. Early in the history the buckets hold one or two trades, and a “100%” built on n = 1 is noise.
The Code
//----------------------------------------------
//PRC_Reversal Trap Probability Bands
//version = 0
//31.07.26
//Ivan Gonzalez @ www.prorealcode.com
//Translated from "Reversal Trap Probability Bands [BigBeluga]" (PineScript v6)
//Original author: BigBeluga
//Sharing ProRealTime knowledge
//----------------------------------------------
// --- Parameters (declare as Variables in the editor) ---
envLen = 55          // Envelope Smoothness (baseline EMA and envelope ATR)
envMult = 4.0        // Envelope Width (ATR multiplier)
trapWindow = 10      // Trap Window: max bars outside the band for a valid trap
signalGap = 10       // minimum bars between signals (cooldown)
rsiLen = 20          // RSI length that defines the probability bucket
stopMult = 0.5       // ATR Stop Multiplier
maxTrades = 500      // cap on trades recorded in the historical database
maxDraw = 12         // historical signals drawn (ring buffer)
showLevels = 1       // 1 = draw target/stop of each signal
showPanel = 1        // 1 = statistics panel
//----------------------------------------------
// --- Colours (bull = teal, bear = red) ---
//----------------------------------------------
upR = 18
upG = 175
upB = 159
dnR = 236
dnG = 51
dnB = 51
midR = 120
midG = 123
midB = 134
//----------------------------------------------
//=== PERSISTENT STATE ===
// Cumulative counters and the ring buffer live in $ arrays:
// $gGuard[0] = last processed bar  |  $gGuard[1] = number of stored signals
//----------------------------------------------
once activeBull = 0
once activeBear = 0
once nTrades = 0
once lastSigBar = 0 - 1000
once bullTgt = 0
once bullStp = 0
once bullBkt = 0
once bullRate = 0
once bullY = 0
once bearTgt = 0
once bearStp = 0
once bearBkt = 0
once bearRate = 0
once bearY = 0


if barindex = 0 then
    $gGuard[0] = 0 - 1
    $gGuard[1] = 0
    for k = 0 to 10 do
        $bullTot[k] = 0
        $bullWin[k] = 0
        $bearTot[k] = 0
        $bearWin[k] = 0
    next
endif
//----------------------------------------------
//=== VOLATILITY ENVELOPE ===
//----------------------------------------------
basis = average[envLen,1](close)
vola = averagetruerange[envLen](close)
upperBand = basis + envMult * vola
lowerBand = basis - envMult * vola
myrsi = rsi[rsiLen](close)
atrStop = averagetruerange[100](close) * stopMult


startBar = max(envLen, 100) + 2
warmOK = 0
if barindex > startBar then
    warmOK = 1
endif
//----------------------------------------------
//=== RSI BUCKET (0..10) ===
// Database index: each RSI decile keeps its own win rate
//----------------------------------------------
if warmOK then
    rsiBk = round(myrsi / 10)
    if rsiBk < 0 then
        rsiBk = 0
    endif
    if rsiBk > 10 then
        rsiBk = 10
    endif
else
    rsiBk = 0
endif
//----------------------------------------------
//=== RAW TRAPS ===
// The out-of-band counter is READ with its previous-bar value and updated
// afterwards (same order as the original)
//----------------------------------------------
rawBear = 0
rawBull = 0
if warmOK then
    if close < upperBand then
        if high > upperBand and close[1] < upperBand and cntAbove[1] <= trapWindow then
            rawBear = 1
        elsif close[1] > upperBand and cntAbove[1] <= trapWindow then
            rawBear = 1
        endif
    endif
    if close > lowerBand then
        if low < lowerBand and close[1] > lowerBand and cntBelow[1] <= trapWindow then
            rawBull = 1
        elsif close[1] < lowerBand and cntBelow[1] <= trapWindow then
            rawBull = 1
        endif
    endif
endif


if warmOK = 0 then
    cntAbove = 0
elsif high > upperBand then
    cntAbove = cntAbove[1] + 1
else
    cntAbove = 0
endif


if warmOK = 0 then
    cntBelow = 0
elsif low < lowerBand then
    cntBelow = cntBelow[1] + 1
else
    cntBelow = 0
endif
//----------------------------------------------
//=== SIGNAL COOLDOWN ===
//----------------------------------------------
canFire = 0
if barindex - lastSigBar >= signalGap then
    canFire = 1
endif
bullTrap = rawBull and canFire
bearTrap = rawBear and canFire
if bullTrap or bearTrap then
    lastSigBar = barindex
endif
//----------------------------------------------
//=== BULLISH ENGINE (state machine in scalars: they rewind per tick) ===
//----------------------------------------------
allowed = 0
if nTrades < maxTrades then
    allowed = 1
endif


bullOpen = 0
if bullTrap and (activeBull = 0) and allowed then
    activeBull = 1
    bullOpen = 1
    bullBkt = rsiBk
    bullTgt = basis
    bullStp = lowest[2](low) - atrStop
    bullY = low - atrStop
    nTrades = nTrades + 1
    if $bullTot[rsiBk] > 0 then
        bullRate = round($bullWin[rsiBk] * 100 / $bullTot[rsiBk])
    else
        bullRate = 0 - 1
    endif
endif


bullWinNow = 0
bullLossNow = 0
if activeBull and (barindex - lastSigBar > 1) then
    if high >= bullTgt then
        bullWinNow = 1
        activeBull = 0
    elsif low < bullStp then
        bullLossNow = 1
        activeBull = 0
    endif
endif
//----------------------------------------------
//=== BEARISH ENGINE ===
//----------------------------------------------
bearOpen = 0
if bearTrap and (activeBear = 0) and allowed then
    activeBear = 1
    bearOpen = 1
    bearBkt = rsiBk
    bearTgt = basis
    bearStp = highest[2](high) + atrStop
    bearY = high + atrStop
    nTrades = nTrades + 1
    if $bearTot[rsiBk] > 0 then
        bearRate = round($bearWin[rsiBk] * 100 / $bearTot[rsiBk])
    else
        bearRate = 0 - 1
    endif
endif


bearWinNow = 0
bearLossNow = 0
if activeBear and (barindex - lastSigBar > 1) then
    if low <= bearTgt then
        bearWinNow = 1
        activeBear = 0
    elsif high > bearStp then
        bearLossNow = 1
        activeBear = 0
    endif
endif
//----------------------------------------------
//=== ARRAY WRITES: ONE SINGLE PASS PER BAR ===
// $ arrays do NOT rewind between ticks. Everything that accumulates (+1) or
// shifts (FIFO) runs once per bar on the already CLOSED bar, reading the
// scalar flags with [1]. Cost: drawings run one bar behind.
//----------------------------------------------
if warmOK and barindex > $gGuard[0] then
    $gGuard[0] = barindex
    nS = $gGuard[1]


    // --- close the bullish trade from the previous bar ---
    if bullWinNow[1] or bullLossNow[1] then
        bk = bullBkt[1]
        $bullTot[bk] = $bullTot[bk] + 1
        if bullWinNow[1] then
            $bullWin[bk] = $bullWin[bk] + 1
        endif
        if nS > 0 then
            for i = nS downto 1 do
                if $sgDir[i] = 1 and $sgRes[i] = 0 then
                    $sgEnd[i] = barindex - 1
                    if bullWinNow[1] then
                        $sgRes[i] = 1
                    else
                        $sgRes[i] = 0 - 1
                    endif
                endif
            next
        endif
    endif


    // --- close the bearish trade from the previous bar ---
    if bearWinNow[1] or bearLossNow[1] then
        bk = bearBkt[1]
        $bearTot[bk] = $bearTot[bk] + 1
        if bearWinNow[1] then
            $bearWin[bk] = $bearWin[bk] + 1
        endif
        if nS > 0 then
            for i = nS downto 1 do
                if $sgDir[i] = 0 - 1 and $sgRes[i] = 0 then
                    $sgEnd[i] = barindex - 1
                    if bearWinNow[1] then
                        $sgRes[i] = 1
                    else
                        $sgRes[i] = 0 - 1
                    endif
                endif
            next
        endif
    endif


    // --- register the previous bar's signal (push with FIFO cap) ---
    if bullOpen[1] or bearOpen[1] then
        while nS >= maxDraw do
            for i = 1 to nS - 1 do
                $sgX[i] = $sgX[i+1]
                $sgY[i] = $sgY[i+1]
                $sgEy[i] = $sgEy[i+1]
                $sgDir[i] = $sgDir[i+1]
                $sgRate[i] = $sgRate[i+1]
                $sgRsi[i] = $sgRsi[i+1]
                $sgTgt[i] = $sgTgt[i+1]
                $sgStp[i] = $sgStp[i+1]
                $sgEnd[i] = $sgEnd[i+1]
                $sgRes[i] = $sgRes[i+1]
            next
            nS = nS - 1
        wend
        nS = nS + 1
        $sgX[nS] = barindex - 1
        $sgEnd[nS] = 0
        $sgRes[nS] = 0
        $sgRsi[nS] = round(myrsi[1])
        if bullOpen[1] then
            $sgDir[nS] = 1
            $sgY[nS] = bullY[1]
            $sgEy[nS] = low[1]
            $sgRate[nS] = bullRate[1]
            $sgTgt[nS] = bullTgt[1]
            $sgStp[nS] = bullStp[1]
        else
            $sgDir[nS] = 0 - 1
            $sgY[nS] = bearY[1]
            $sgEy[nS] = high[1]
            $sgRate[nS] = bearRate[1]
            $sgTgt[nS] = bearTgt[1]
            $sgStp[nS] = bearStp[1]
        endif
    endif


    $gGuard[1] = nS
endif
//----------------------------------------------
//=== REPAINT OF THE LAST SIGNALS (ring buffer) ===
//----------------------------------------------
if islastbarupdate then
    nDraw = $gGuard[1]
    if nDraw > 0 then
        for i = 1 to nDraw do
            xEnd = $sgEnd[i]
            if xEnd = 0 then
                xEnd = barindex + 5
            endif
            if $sgDir[i] = 1 then
                sgR = upR
                sgG = upG
                sgB = upB
            else
                sgR = dnR
                sgG = dnG
                sgB = dnB
            endif
            offY = abs($sgY[i] - $sgEy[i])
            yTxt = 2 * $sgY[i] - $sgEy[i]


            if showLevels then
                drawsegment($sgX[i], $sgTgt[i], xEnd, $sgTgt[i]) coloured(sgR, sgG, sgB, 210) style(dottedline, 1)
                drawsegment($sgX[i], $sgStp[i], xEnd, $sgStp[i]) coloured(sgR, sgG, sgB, 110) style(dottedline, 1)
                drawsegment($sgX[i], $sgEy[i], xEnd, $sgTgt[i]) coloured(sgR, sgG, sgB, 70) style(line, 1)
            endif


            if $sgDir[i] = 1 then
                drawtext("▲", $sgX[i], $sgY[i]) coloured(sgR, sgG, sgB, 255)
            else
                drawtext("▼", $sgX[i], $sgY[i]) coloured(sgR, sgG, sgB, 255)
            endif


            pr = $sgRate[i]
            rs = $sgRsi[i]
            if pr >= 0 then
                drawtext("TRAP #pr#% - RSI #rs#", $sgX[i], yTxt) coloured(sgR, sgG, sgB, 255)
            else
                drawtext("TRAP ? - RSI #rs#", $sgX[i], yTxt) coloured(sgR, sgG, sgB, 255)
            endif


            if $sgRes[i] = 1 then
                if $sgDir[i] = 1 then
                    drawtext("✓", xEnd, $sgTgt[i] + offY) coloured(sgR, sgG, sgB, 255)
                else
                    drawtext("✓", xEnd, $sgTgt[i] - offY) coloured(sgR, sgG, sgB, 255)
                endif
            endif
        next
    endif
    // signal opened on the live bar: not in the buffer yet (it enters when the
    // bar closes). Drawn separately so it is not missed in real time.
    if bullOpen then
        liveRsi = round(myrsi)
        drawtext("▲", barindex, bullY) coloured(upR, upG, upB, 255)
        drawtext("TRAP - RSI #liveRsi#", barindex, 2 * bullY - low) coloured(upR, upG, upB, 255)
    endif
    if bearOpen then
        liveRsi = round(myrsi)
        drawtext("▼", barindex, bearY) coloured(dnR, dnG, dnB, 255)
        drawtext("TRAP - RSI #liveRsi#", barindex, 2 * bearY - high) coloured(dnR, dnG, dnB, 255)
    endif
endif
//----------------------------------------------
//=== STATISTICS PANEL (top right corner) ===
//----------------------------------------------
if showPanel and islastbarupdate then
    totB = 0
    winB = 0
    totS = 0
    winS = 0
    for k = 0 to 10 do
        totB = totB + $bullTot[k]
        winB = winB + $bullWin[k]
        totS = totS + $bearTot[k]
        winS = winS + $bearWin[k]
    next
    if totB > 0 then
        prBull = round(winB * 100 / totB)
    else
        prBull = 0
    endif
    if totS > 0 then
        prBear = round(winS * 100 / totS)
    else
        prBear = 0
    endif
    drawtext("TRAP STATS", -180, -30, sansserif, bold, 11) coloured(midR, midG, midB, 255) anchor(topright, xshift, yshift)
    drawtext("Bull #prBull#% of #totB#", -180, -56, sansserif, bold, 11) coloured(upR, upG, upB, 255) anchor(topright, xshift, yshift)
    drawtext("Bear #prBear#% of #totS#", -180, -82, sansserif, bold, 11) coloured(dnR, dnG, dnB, 255) anchor(topright, xshift, yshift)
endif
//----------------------------------------------
//=== FILLS AND PLOT ===
//----------------------------------------------
colorbetween(upperBand, basis, dnR, dnG, dnB, 20)
colorbetween(basis, lowerBand, upR, upG, upB, 20)


return upperBand coloured(dnR, dnG, dnB, 140) style(line, 3) as "Envelope ceiling", lowerBand coloured(upR, upG, upB, 140) style(line, 3) as "Envelope floor", basis coloured(midR, midG, midB, 205) style(dottedline, 1) as "Baseline"