1. Introduction
Supply and Demand (SND) zone analysis is a technique widely used in institutional trading and by price action traders. These zones represent levels where strong buying or selling activity has created imbalances that could be respected again in the future. Correctly identifying them can offer high-probability trading opportunities.
The “Rally Base Drop SND” indicator was developed (LuxAlgo) to automate the detection of one of the classic SND patterns: the “Rally – Base – Drop” and its inverse “Drop – Base – Rally”. This script makes it easier to visually identify these key zones directly on the chart.
2. Indicator Foundation
The “Rally – Base – Drop” pattern consists of three phases:
-
Rally: A strong upward move composed of at least two consecutive bullish candles.
-
Base: A zone of consolidation or pause, usually with small-bodied candles or indecisive movement.
-
Drop: A strong downward move, also made of at least two consecutive bearish candles.
Conversely, the “Drop – Base – Rally” pattern signals a potential bullish reversal.
In the code, these phases are defined as:
-
A bullish candle is when the close is higher than the open.
-
A sequence of two bullish candles defines a Rally.
-
A sequence of two bearish candles defines a Drop.
-
When neither Rally nor Drop is detected, it’s considered a Base.
3. How the Code Works
The core of the indicator is the detection of pivot zones that match the SND structure.
a. SND Zone Detection
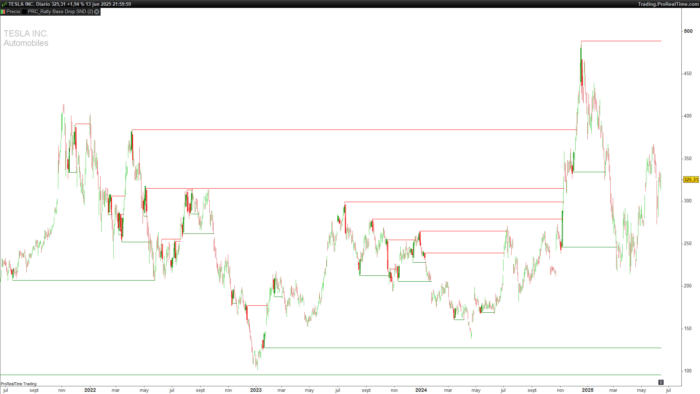
The script continuously scans the chart for sequences that match either Rally → Base → Drop or Drop → Base → Rally. When a valid pattern is found, the price range (highest high and lowest low) within the base is calculated and a rectangle is drawn to visually highlight it.
b. Visualization
-
Supply zones (Rally-Base-Drop) are shown with semi-transparent red rectangles.
-
Demand zones (Drop-Base-Rally) are shown with semi-transparent green rectangles.
Additionally, the script draws a horizontal line from the key pivot level until the zone is invalidated by a price breakout. Once broken, the line is truncated to show that the zone is no longer valid.
4. Indicator Settings
The indicator includes a single customizable parameter:
-
len (default = 2): number of bars considered for identifying pivot highs/lows. Increasing this value reduces the indicator’s sensitivity, focusing on more significant moves.
This setting can be adjusted depending on the timeframe and the volatility of the asset being analyzed.
5. Practical Applications
This indicator is especially useful for:
-
Marking potential reversal zones: where price could react if it returns.
-
Identifying key entry/exit levels: by validating or breaking through zones.
-
Confirming market structure: by highlighting areas that align with dynamic support/resistance.
It can be used on all assets and timeframes, though higher timeframes like H1, H4, or Daily are recommended for stronger zones.
6. Source Code
Below is the full ProBuilder code, ready to be used in your ProRealTime platform:
|
1 2 3 4 5 6 7 8 9 10 11 12 13 14 15 16 17 18 19 20 21 22 23 24 25 26 27 28 29 30 31 32 33 34 35 36 37 38 39 40 41 42 43 44 45 46 47 48 49 50 51 52 53 54 55 56 57 58 59 60 61 62 63 64 65 66 67 68 69 70 71 72 73 74 75 76 77 78 79 80 81 82 83 84 85 86 87 88 |
//----------------------------------------// //PRC_Rally Base Drop SND //version = 0 //22.05.25 //Iván González @ www.prorealcode.com //Sharing ProRealTime knowledge //----------------------------------------// // Inputs //----------------------------------------// len=2 //----------------------------------------// // Basic Variables //----------------------------------------// gc=close>open rc=close<open rally=gc and gc[1] drop=rc and rc[1] base=rally=0 and drop=0 atr=averagetruerange[14](close) //----------------------------------------// // Pivots High and Low //----------------------------------------// hst=highest[len](max(close,open)) lst=lowest[len](min(close,open)) for i=0 to len-1 do if gc[i]=0 or rc[len+i]=0 then break endif if i=len-1 and close>open[len+i] and close[len]<close[len+i] then $pivlow[n+1]=low[i] $pivlowIdx[n+1]=barindex[i] $pivlowBroken[n+1]=0 $pivlowBrokenidx[n+1]=barindex n=n+1 drawrectangle(barindex[len+i],hst[len],barindex[len],lst[len])coloured("red")fillcolor("red",30) drawrectangle(barindex[i],hst,barindex,lst)coloured("green")fillcolor("green",30) endif next for i=0 to len-1 do if rc[i]=0 or gc[len+i]=0 then break endif if i=len-1 and close<open[len+i] and close[len]>close[len+i] then $pivhigh[t+1]=high[i] $pivhighIdx[t+1]=barindex[i] $pivhighBroken[t+1]=0 $pivhighBrokenidx[t+1]=barindex t=t+1 drawrectangle(barindex[len+i],hst[len],barindex[len],lst[len])coloured("green")fillcolor("green",30) drawrectangle(barindex[i],hst,barindex,lst)coloured("red")fillcolor("red",30) endif next if islastbarupdate then for i=n downto 1 do for k=barindex-($pivlowIdx[i]+1) downto 0 do if low[k]<$pivlow[i] and $pivlowBroken[i]=0 then $pivlowBroken[i]=1 $pivlowBrokenidx[i]=barindex[k] break endif next if $pivlowBroken[i]=1 then drawsegment($pivlowIdx[i],$pivlow[i],$pivlowBrokenidx[i],$pivlow[i])coloured("green") else drawsegment($pivlowIdx[i],$pivlow[i],barindex,$pivlow[i])coloured("green") endif next for i=t downto 1 do for k=barindex-($pivhighIdx[i]+1) downto 0 do if high[k]>$pivhigh[i] and $pivhighBroken[i]=0 then $pivhighBroken[i]=1 $pivhighBrokenidx[i]=barindex[k] break endif next if $pivhighBroken[i]=1 then drawsegment($pivhighIdx[i],$pivhigh[i],$pivhighBrokenidx[i],$pivhigh[i])coloured("red") else drawsegment($pivhighIdx[i],$pivhigh[i],barindex,$pivhigh[i])coloured("red") endif next endif //----------------------------------------// return |
Share this
No information on this site is investment advice or a solicitation to buy or sell any financial instrument. Past performance is not indicative of future results. Trading may expose you to risk of loss greater than your deposits and is only suitable for experienced investors who have sufficient financial means to bear such risk.
ProRealTime ITF files and other attachments :
Find other exclusive trading pro-tools on ![]()
PRC is also on YouTube, subscribe to our channel for exclusive content and tutorials
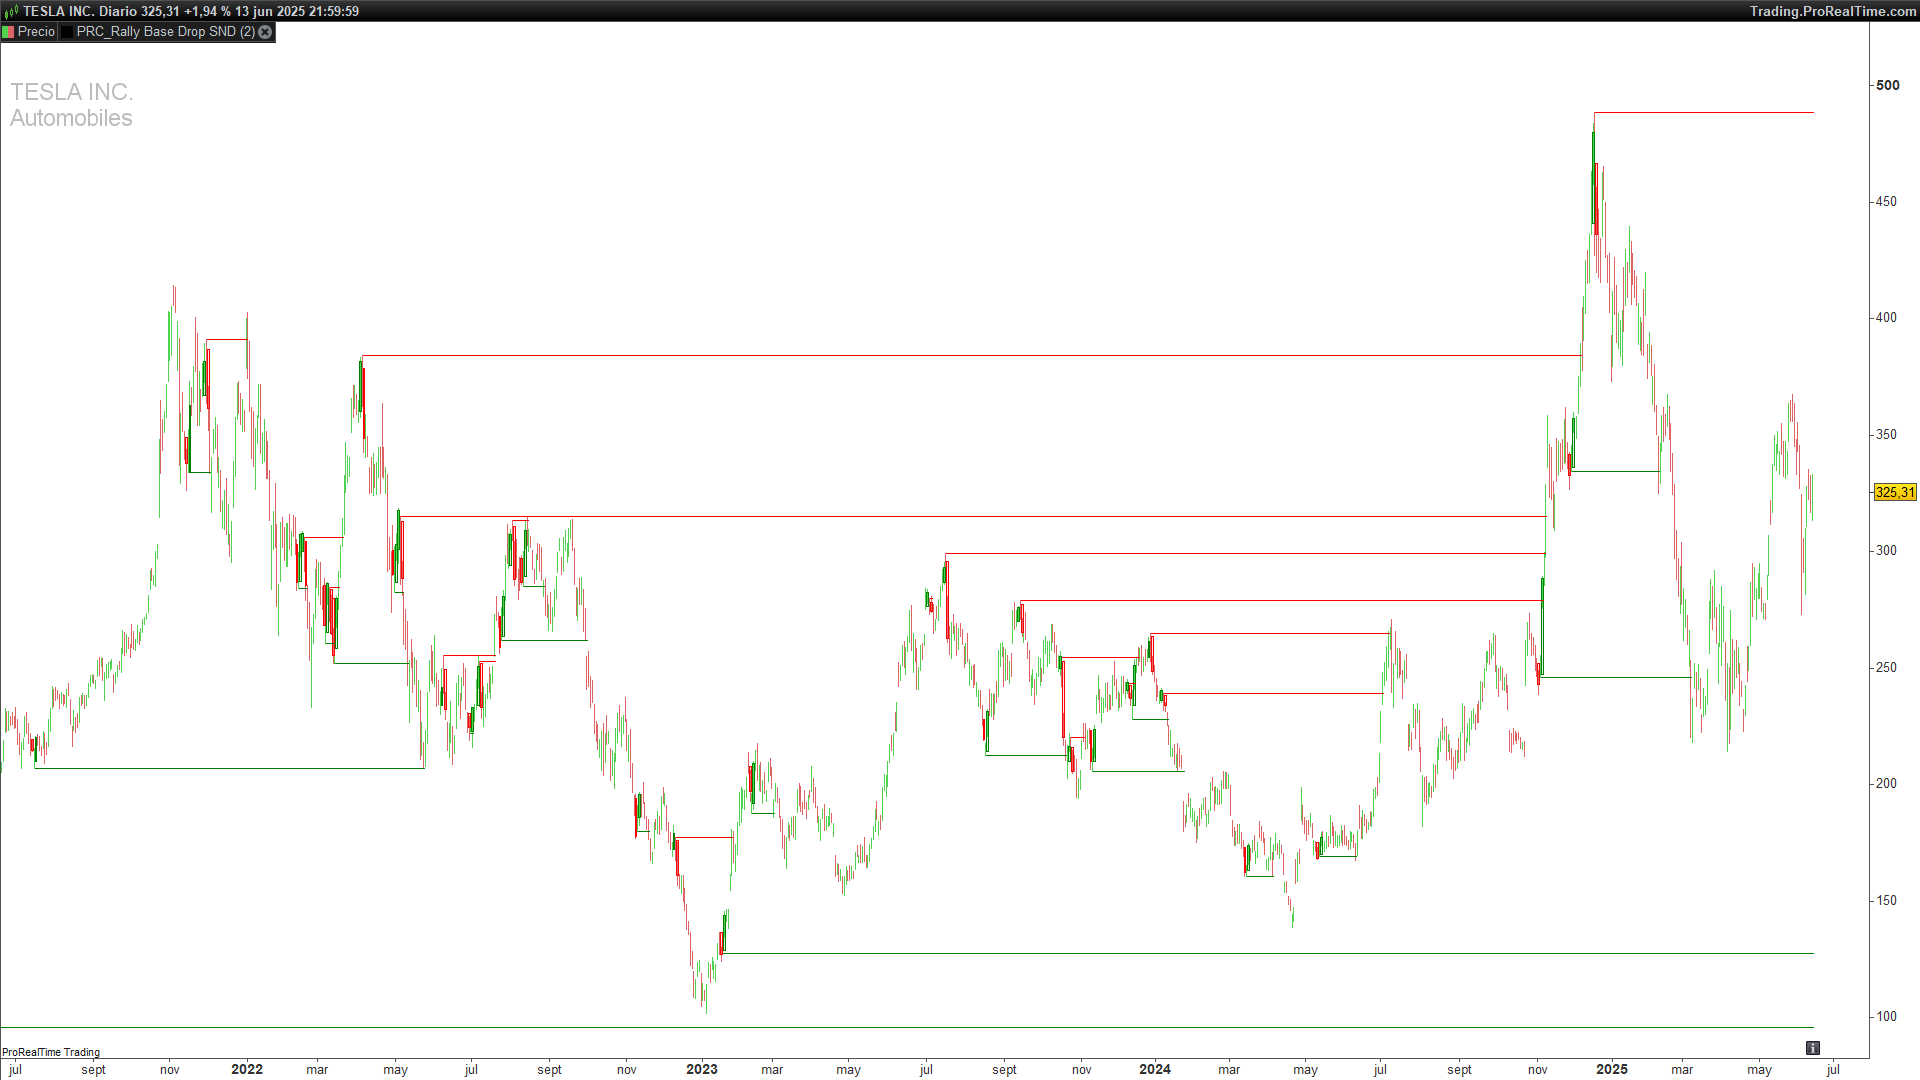
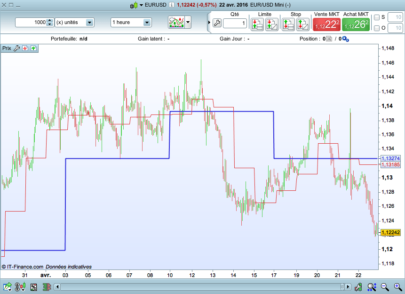
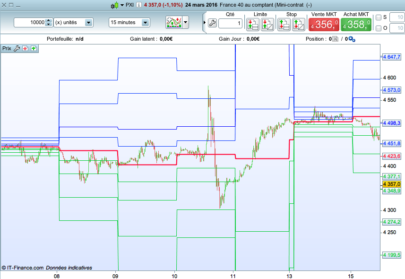


Two things stand out to me: I see a lot of horizontal blocks in the chart instead of vertical ones, and I’m wondering why the ATR is calculated if it isn’t used in the formula.