

Price Action Forecast (PAF) Indicator
Introduction
The “Price Action Forecast” (PAF) indicator, created by Zeiierman, is designed to predict future market movements based on historical candlestick patterns. It uses a series of candles to identify similar events in the past and projects these patterns into the future, providing a visual and quantitative tool to anticipate potential trends and price changes.
This indicator is particularly useful for traders who use technical analysis and seek to leverage repetitive patterns in historical price data.
Code Description
Let’s explain the different parts of the “Price Action Forecast” (PAF) indicator code:
Input Variables
- Series: Defines the number of candles used to identify the pattern (default is 7).
- Forecast: Specifies the number of future candles that will be predicted (default is 100).
- Display: Controls whether the detected events should be displayed on the chart (default is 1).
Main Calculation
The indicator starts by defining and calculating the necessary variables:
- dataSize: Used to store the size of the processed data.
- $dataD[]: An array that stores the type of candle (1 for bullish candles, -1 for bearish candles).
The main code executes on the last tick of the bar (islastbarupdate):
- Storing Candle Data:
- It checks if the candle’s close is higher than the open to determine if it is bullish or bearish.
- This information is stored in the $dataD[] array.
- Pattern Search:
- If the data size (dataSize) is greater than or equal to the number of candles in Series, it searches for a similar pattern in the historical data.
- It uses two nested FOR loops to compare the current series of candles with historical series.
- If a similar pattern is found, it calculates the percentage difference between the current close prices and those of the found pattern (Diff).
- Creating Prediction Candles:
- Based on the calculated difference (Diff), it generates and draws prediction candles on the chart using drawsegment and DRAWRECTANGLE.
Event Visualization
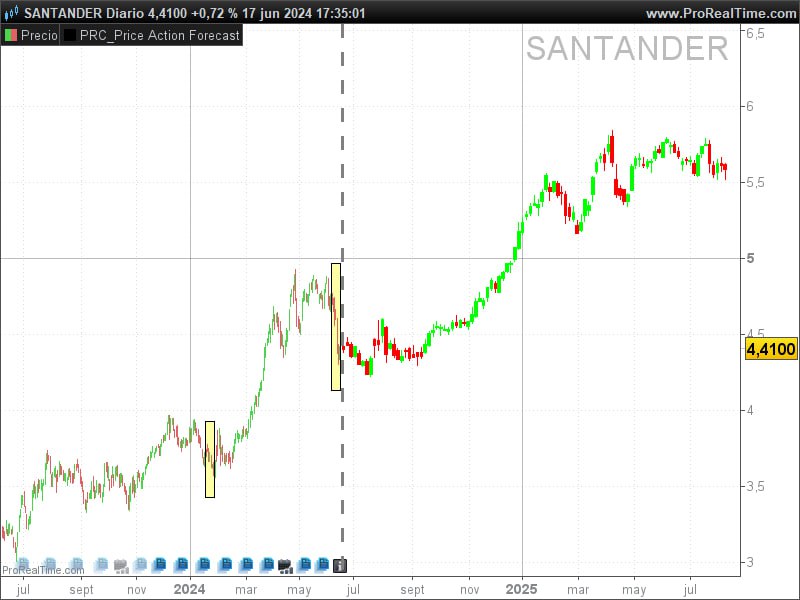
If Display is enabled, rectangles are drawn around the areas of interest on the chart, helping to better visualize the detected patterns.
Configuration and Customization
The “Price Action Forecast” (PAF) indicator allows users to adjust various parameters to suit their specific trading needs. Below are the main configurable parameters and how they can be modified:
Configurable Parameters
- Series
- Description: Defines the number of candles used to identify historical patterns.
- Default Value: 7
- Modification: Can be adjusted to increase or decrease the pattern sensitivity. A higher value can capture longer patterns, while a lower value will detect shorter patterns.
- Example: Series = 10
- Forecast
- Description: Specifies the number of future candles that will be predicted.
- Default Value: 100
- Modification: Can be changed to forecast a larger or smaller number of future candles. A larger number extends the forecast time.
- Example: Forecast = 50
- Display
- Description: Controls whether the detected events should be displayed on the chart.
- Default Value: 1 (display events)
- Modification: Set to 0 to hide events, or to 1 to show them.
- Example: Display = 0
How to Modify Default Values
To customize the indicator, users can adjust the values of the input variables directly at the beginning of the code. Here is an example of how to do it:
// Input variables
Series = 10 // Increased the number of series candles
Forecast = 50 // Reduced the number of forecast candles
Display = 0 // Do not display events on the chart
These adjustments allow traders to tailor the indicator to different market conditions and specific trading strategies.
Practical Examples
To illustrate the use of the “Price Action Forecast” (PAF) indicator, here are some practical examples of how it can be applied to real charts.
Example 1: Detecting Repetitive Patterns
Suppose we configure the indicator with Series = 7 and Forecast = 100. The indicator will search for sequences of candles (bullish and bearish) that match the last 7 candles on the current chart.
Interpretation:
- The indicator will compare the current sequence of 7 candles with similar sequences in the price history.
- If it finds a match, it will draw prediction candles based on the behavior following the historical sequence found.
- This allows the trader to see if the historically identified pattern resulted in a bullish or bearish trend and use this information to make trading decisions.
Example 2: Identifying Patterns at Support Levels
By configuring the indicator with Series = 10 and Forecast = 50, we can focus on detecting patterns that occurred at support levels. Suppose the current price is at a previously identified support zone.
Interpretation:
- The indicator will detect if the current 10-candle sequence matches any historical sequence that occurred at support levels.
- If a match is found, the prediction candles will show how the price behaved historically after that pattern at support.
- This may indicate a possible bullish reversal if similar patterns in the past resulted in price increases at support levels.
Example 3: Application in Different Timeframes
The PAF indicator can be applied in different timeframes to suit various trading strategies. For example, on an hourly chart, we can configure Series = 5 and Forecast = 30 for short-term predictions.
Interpretation:
- On an hourly chart, the indicator will search for 5-candle patterns and project 30 candles into the future.
- This allows intraday traders to identify short-term repetitive patterns and plan their trades based on high-frequency predictions.
Conclusion
The “Price Action Forecast” (PAF) indicator created by Zeiierman is a powerful tool for predicting future market movements based on historical candlestick patterns. By identifying similar events in the past and projecting them into the future, this indicator provides a quantitative and visual insight that can significantly enhance trading strategies.
Advantages of the PAF Indicator:
- Predictions based on historical patterns: Leverages repetitive patterns to anticipate market movements.
- Customization: Configurable parameters allow it to be adapted to different market conditions and trading strategies.
- Clear visualization: Draws prediction candles on the chart, making it easier to identify potential trends and changes.
We recommend traders to experiment with the indicator’s parameters to find the configuration that best suits their trading style and use this tool as a complement to their technical analysis.
//--------------------------------------------------------------//
//PRC_Price Action Forecast
//version = 0
//18.06.24
//Iván González @ www.prorealcode.com
//Sharing ProRealTime knowledge
//--------------------------------------------------------------//
// Variables de entrada
Series = 7 // Candle Series
Forecast = 30 // Forecast Candles
Display = 1 // Display Event
atr=averagetruerange[14](close)
// Variables y Arrays
Once dataSize = 0
datasize=barindex
if (Close > Open) then
$dataD[dataSize] = 1
else
$dataD[dataSize] = -1
endif
dataSize = dataSize + 1

if islastbarupdate then
// Crear velas de predicción
IF dataSize >= Series THEN
Found = 0
Events = 0
// Buscar eventos similares en el pasado
FOR i = Series TO dataSize - Series DO
Equal = 1
FOR j = 0 TO Series - 1 DO
IF $dataD[dataSize - j - 1] <> $dataD[dataSize - i - j - 1] THEN
Equal = 0
BREAK
ENDIF
NEXT
// Si se encuentra un evento similar
IF Equal = 1 THEN
Found = 1
Dist = 1
x=barindex[i]
y1=low[i]
y2=high[i]
Prev = close[i]
Diff = ((Close - Prev) / Prev) + 1
// Crear velas de predicción
FOR j = 1 TO min(i,Forecast - 1) DO
IF dataSize - i - j > 0 THEN
Pos = $dataD[i - j]
IF close[i-j]>open[i - j] THEN
myTop = close[i-j] * Diff
myBot = open[i - j] * Diff
r=0
g=255
ELSE
myTop = open[i - j] * Diff
myBot = close[i-j] * Diff
r=255
g=0
ENDIF
Hi = High[i - j] * Diff
Lo = Low[i- j] * Diff
drawsegment(barindex+Dist+1,myTop,barindex+Dist+1,hi)coloured(r,g,0)
drawsegment(barindex+Dist+1,myBot,barindex+Dist+1,lo)coloured(r,g,0)
DRAWRECTANGLE(barindex+Dist, myTop,barindex+ Dist + 2, myBot)coloured(r,g,0)fillcolor(r,g,0)
ENDIF
Dist = Dist + 3
NEXT
BREAK
ENDIF
NEXT
IF Display THEN
drawrectangle(x,y1-2*atr,x+series,y2+2*atr)fillcolor("yellow",90)
drawrectangle(barindex[series],min(low,low[series])-2*atr,barindex,max(high,high[series])+2*atr)fillcolor("yellow",90)
drawline(barindex+1,high,barindex+1,low)style(dottedline2,3)coloured("grey")
ENDIF
ENDIF
endif
return