







Multiframe RSI of RSI
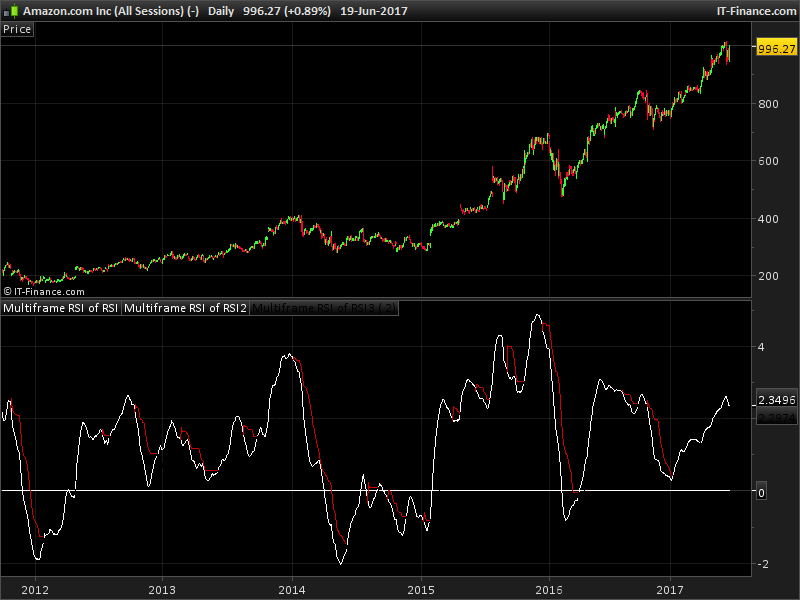
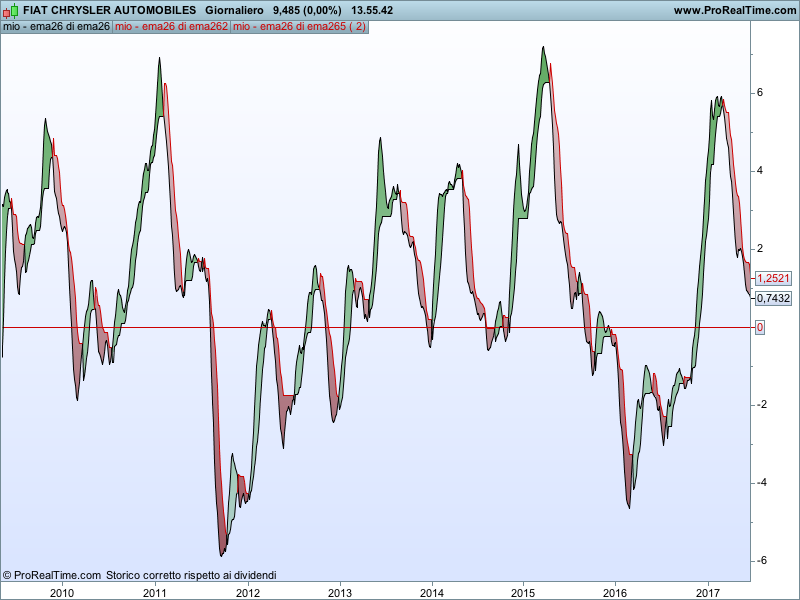
Since on a daily chart EMA26 approximate in an excellent way the 50-line of the RSI (when close crosses under EMA26 the RSI crosses under 50) and EMA130 approximate in the same way the 50-line of the weekly data on the daily chart, I created this indicator that so far gave me really good profits per trade.
It’s sort of a daily RSI of a weekly RSI and uses a cut-off line based on standard deviations to stop the position. I traded with it only long and only on stock market.
I enter long when the indicator crosses into the positive area (I normally use a number between 0.3 and 0.9) and I sell when the indicator crosses under the cut line (I use normally 1.5 to 1.9 of correction for the standard deviation)
Blue skies
//computation of moving averages and standard deviation
//corr=2
a=exponentialaverage[130](close)
b=exponentialaverage[26](a)
diff=100*(a-b)/b
st=std[22](diff)
//computation of reference line (cut)
if barindex>26 then
 basso=diff-corr*st
 alto=diff+corr*st
 once cut=basso
 if diff crosses under cut then
  cut=alto
 endif
 if diff crosses over cut then
  cut=basso
 endif
 if diff>cut then
  if basso>cut then
   cut=basso
  endif
 endif
 if diff<cut then
  if alto<cut then
   cut=alto
  endif
 endif
 if diff>cut then
  r=0
 else
  r=205
 endif
endif
//return of data
return diff,0, cut coloured (r,0,0)
Comments
You must be logged in to post a comment.

Yes sorry, I set up a link to a screen shot on my google drive and then I got locked into that weird thing where I kept getting shot down to the 'bottom of the page' and couldn't get back to my post. I kept hitting return, space bar and all sorts in the end in frustration! I don't want to bother Nicolas with it as he is so busy and he knows about this issue anyway ... but he will read this sometime! ;)
Anyway ....... here is an 'embedded screen shot' instead of a link ... mmm can't even do that now, this is so frustrating! Only way seems to be if you raise a Forum Thread??
Bonjour Nicolas, Pourriez-vous m'indiquer si cet indicateur fonctionne avec la V11 ? Le diff s'affiche seul dans un graph séparé avec ses deux lignes d'écart-type et c'est tout. L'indicateur change d'ailleurs de nom au téléchargement : "mio - ema26 di ema26" et l'illustration en exemple est impossible à réaliser. Je vous en remercie d'avance.