

Multi Fractals ZigZag High/Low
August 3, 2016, 8:41 PM
Indicators
97 Comments
Second version of this indicator, first one can be found here: http://www.prorealcode.com/prorealtime-indicators/fractals-zigzag/
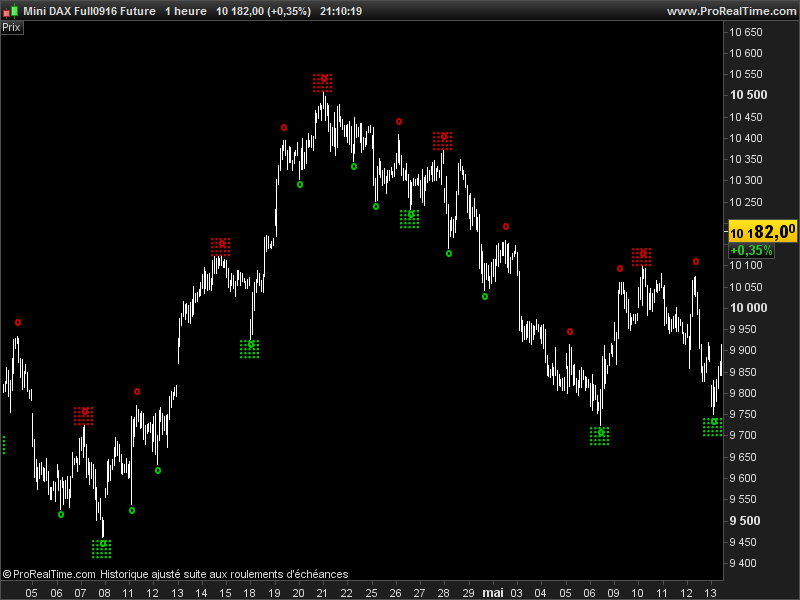
This new version draw only High/Low points of the fractals zigzag on chart. It draws major points (green and red squares) which are calculated with a lookback of 20 periods by default (“cp” parameter can be changed at will).
The minor points (green and red dots) are calculated the same way but with the default period divided by 2 (so 20/2=10 periods by default).
This indicator can be used to trade 123 pattern of any other kind of breakout strategies.
//---external parameters
//cp = 20

once lastpoint = 0
ATR = averagetruerange[cp]

//---major zigzag points
if high[cp] >= highest[2*cp+1](high) then
LH = 1
else
LH = 0
endif

if low[cp] <= lowest[2*cp+1](low)  then
LL = -1
else
LL = 0
endif

if LH = 1 then
TOPy = high[cp]
TOPx = barindex[cp]
endif

if LL = -1 then
BOTy = low[cp]
BOTx = barindex[cp]
endif

if LH>0 and (lastpoint=-1 or lastpoint=0) then
DRAWTEXT("░",TOPx,TOPy+ATR/2,Dialog,Bold,20) coloured(200,0,0,255)
lastpoint = 1
endif
if LL<0 and (lastpoint=1 or lastpoint=0) then
DRAWTEXT("░",BOTx,BOTy-ATR/2,Dialog,Bold,20) coloured(0,200,0,255)
lastpoint = -1
endif

//---mino zigzag points
if high[round(cp/2)] >= highest[cp+1](high) then
LLH = 1
else
LLH = 0
endif

if low[round(cp/2)] <= lowest[cp+1](low)  then
LLL = -1
else
LLL = 0
endif

if LLH = 1 then
LTOPy = high[round(cp/2)]
LTOPx = barindex[round(cp/2)]
endif

if LLL = -1 then
LBOTy = low[round(cp/2)]
LBOTx = barindex[round(cp/2)]
endif

if LLH>0 then
DRAWTEXT("º",LTOPx,LTOPy+ATR/2,Dialog,Bold,20) coloured(200,0,0,255)
endif
if LLL<0 then
DRAWTEXT("º",LBOTx,LBOTy-ATR/2,Dialog,Bold,20) coloured(0,200,0,255)
endif

RETURN
Download
Filename:
PRC_MultiFractalsZigZag.itf
Downloads:
1848
Legend
I created ProRealCode because I believe in the power of shared knowledge. I spend my time coding new tools and helping members solve complex problems.
If you are stuck on a code or need a fresh perspective on a strategy, I am always willing to help. Welcome to the community!
Author’s Profile
Loading...