







Multi Fractals ZigZag High/Low
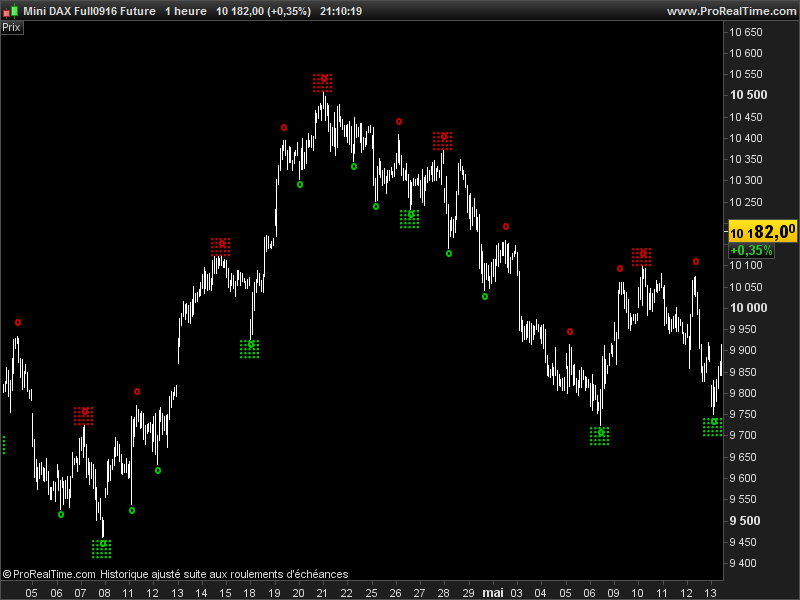
Second version of this indicator, first one can be found here: http://www.prorealcode.com/prorealtime-indicators/fractals-zigzag/
This new version draw only High/Low points of the fractals zigzag on chart. It draws major points (green and red squares) which are calculated with a lookback of 20 periods by default (“cp” parameter can be changed at will).
The minor points (green and red dots) are calculated the same way but with the default period divided by 2 (so 20/2=10 periods by default).
This indicator can be used to trade 123 pattern of any other kind of breakout strategies.
//---external parameters
//cp = 20

once lastpoint = 0
ATR = averagetruerange[cp]

//---major zigzag points
if high[cp] >= highest[2*cp+1](high) then
LH = 1
else
LH = 0
endif

if low[cp] <= lowest[2*cp+1](low)  then
LL = -1
else
LL = 0
endif

if LH = 1 then
TOPy = high[cp]
TOPx = barindex[cp]
endif

if LL = -1 then
BOTy = low[cp]
BOTx = barindex[cp]
endif

if LH>0 and (lastpoint=-1 or lastpoint=0) then
DRAWTEXT("░",TOPx,TOPy+ATR/2,Dialog,Bold,20) coloured(200,0,0,255)
lastpoint = 1
endif
if LL<0 and (lastpoint=1 or lastpoint=0) then
DRAWTEXT("░",BOTx,BOTy-ATR/2,Dialog,Bold,20) coloured(0,200,0,255)
lastpoint = -1
endif

//---mino zigzag points
if high[round(cp/2)] >= highest[cp+1](high) then
LLH = 1
else
LLH = 0
endif

if low[round(cp/2)] <= lowest[cp+1](low)  then
LLL = -1
else
LLL = 0
endif

if LLH = 1 then
LTOPy = high[round(cp/2)]
LTOPx = barindex[round(cp/2)]
endif

if LLL = -1 then
LBOTy = low[round(cp/2)]
LBOTx = barindex[round(cp/2)]
endif

if LLH>0 then
DRAWTEXT("º",LTOPx,LTOPy+ATR/2,Dialog,Bold,20) coloured(200,0,0,255)
endif
if LLL<0 then
DRAWTEXT("º",LBOTx,LBOTy-ATR/2,Dialog,Bold,20) coloured(0,200,0,255)
endif

RETURN
Comments
You must be logged in to post a comment.

Dear Nicolas - your Multi Fractals ZigZag High/Low gives me quite good results - thanks for this! I would like to screen the markets with this Indicator but can not find it under "Screeners". As I'm quite new here, would like to ask you if you can help. Thanks.

In fact, it seems this code is not quite optimal. @Nicolas, is there a way to incorporate your Multi Fractals ZigZag High/Low code above with the Perfect Trend Line screener (https://www.prorealcode.com/topic/ayuda-screener-indicador-perfect-trend-line/#post-51291) so that when the trendline is broken to the upside for example, it auto draws the Fibonacci extensions on the CD leg (if you think of a typical ABCD pattern)? This would be a similar approach to the Ross Hook, except would flag an entry closer to the BC retracement level than Ross Hook (which triggers an entry when price moves through the B point). Thank you in advance.

Here is this indicator with Fibo retracement //---external parameters //cp = 20 r=255 g=0 b=0 once lastpoint = 0 ATR = averagetruerange[cp] //---major zigzag points if high[cp] >= highest[2*cp+1](high) then LH = 1 else LH = 0 endif if low[cp] 0 and (lastpoint=-1 or lastpoint=0) then DRAWTEXT("▼",TOPx,TOPy+ATR/2,Dialog,Bold,20) coloured(200,0,0,255) lastpoint = 1 NewPeak = 1 LastHigherBarindex = TOPx LastHigher = TOPy startbartop = LastHigherBarindex else NewPeak = 0 endif if LL= highest[cp+1](high) then LLH = 1 else LLH = 0 endif if low[round(cp/2)] 0 then DRAWTEXT("º",LTOPx,LTOPy+ATR/2,Dialog,Bold,20) coloured(200,0,0) endif if LLL<0 then DRAWTEXT("º",LBOTx,LBOTy-ATR/2,Dialog,Bold,20) coloured(0,200,0) endif if NewPeak then fullrange = abs(lasthigher-lastlower) fibo236 = lastlower+(fullrange*0.236) fibo382 = lastlower+(fullrange*0.382) fibo50 = lastlower+fullrange/2 fibo618 = lastlower+(fullrange*0.618) fibo764 = lastlower+(fullrange*0.764) startbar = startbarbot endbar = startbartop //plot fibonacci levels if startbarlastplot then drawsegment(startbar,lasthigher,endbar,lasthigher) coloured(r,g,b) drawtext("100%",endbar,lasthigher,Dialog,Standard,10) coloured(r,g,b) drawsegment(startbar,lastlower,endbar,lastlower) coloured(r,g,b) drawtext("0%",endbar,lastlower,Dialog,Standard,10) coloured(r,g,b) drawsegment(startbar,fibo236,endbar,fibo236) coloured(r,g,b) drawtext("23.6%",endbar,fibo236,Dialog,Standard,10) coloured(r,g,b) drawsegment(startbar,fibo382,endbar,fibo382) coloured(r,g,b) drawtext("38.2%",endbar,fibo382,Dialog,Standard,10) coloured(r,g,b) drawsegment(startbar,fibo50,endbar,fibo50) coloured(r,g,b) drawtext("50%",endbar,fibo50,Dialog,Standard,10) coloured(r,g,b) drawsegment(startbar,fibo618,endbar,fibo618) coloured(r,g,b) drawtext("61.8%",endbar,fibo618,Dialog,Standard,10) coloured(r,g,b) drawsegment(startbar,fibo764,endbar,fibo764) coloured(r,g,b) drawtext("76.4%",endbar,fibo764,Dialog,Standard,10) coloured(r,g,b) lastplot = startbar endif endif if NewDown then fullrange = abs(lasthigher-lastlower) fibo236 = lasthigher-(fullrange*0.236) fibo382 = lasthigher-(fullrange*0.382) fibo50 = lasthigher-fullrange/2 fibo618 = lasthigher-(fullrange*0.618) fibo764 = lasthigher-(fullrange*0.764) startbar = startbartop endbar = startbarbot //plot fibonacci levels if startbarlastplot then drawsegment(startbar,lasthigher,endbar,lasthigher) coloured(r,g,b) drawtext("0%",endbar,lasthigher,Dialog,Standard,10) coloured(r,g,b) drawsegment(startbar,lastlower,endbar,lastlower) coloured(r,g,b) drawtext("100%",endbar,lastlower,Dialog,Standard,10) coloured(r,g,b) drawsegment(startbar,fibo236,endbar,fibo236) coloured(r,g,b) drawtext("23.6%",endbar,fibo236,Dialog,Standard,10) coloured(r,g,b) drawsegment(startbar,fibo382,endbar,fibo382) coloured(r,g,b) drawtext("38.2%",endbar,fibo382,Dialog,Standard,10) coloured(r,g,b) drawsegment(startbar,fibo50,endbar,fibo50) coloured(r,g,b) drawtext("50%",endbar,fibo50,Dialog,Standard,10) coloured(r,g,b) drawsegment(startbar,fibo618,endbar,fibo618) coloured(r,g,b) drawtext("61.8%",endbar,fibo618,Dialog,Standard,10) coloured(r,g,b) drawsegment(startbar,fibo764,endbar,fibo764) coloured(r,g,b) drawtext("76.4%",endbar,fibo764,Dialog,Standard,10) coloured(r,g,b) lastplot = startbar endif endif RETURN




HI Nicolas, Thank you for the indicator. However, I am having a tough time loading the indicator onto metatrader 4, as I am not familiar with the the platform on the youtube video made. Please help






Hi Nicolas,
i wanna use this indicator in an automatica trading strategy. but it seems that is not possibile. I've changed the code so the function will return the last value obtained but it seems that it's not in sync with the draw. It a my error or is not possible to return the value for this indicator?
//---external parameters
//cp = 20

once lastpoint = 0
ATR = averagetruerange[cp]

//---major zigzag points
if high[cp] >= highest[2*cp+1](high) then
LH = 1
else
LH = 0
endif

if low[cp] <= lowest[2*cp+1](low)  then
LL = -1
else
LL = 0
endif

if LH = 1 then
TOPy = high[cp]
TOPx = barindex[cp]
endif

if LL = -1 then
BOTy = low[cp]
BOTx = barindex[cp]
endif

if LH>0 and (lastpoint=-1 or lastpoint=0) then
DRAWTEXT("░",TOPx,TOPy+ATR/2,Dialog,Bold,20) coloured(200,0,0,255)
lastpoint = 1
last = 2
endif
if LL<0 and (lastpoint=1 or lastpoint=0) then
DRAWTEXT("░",BOTx,BOTy-ATR/2,Dialog,Bold,20) coloured(0,200,0,255)
lastpoint = -1
last = -2
endif

//---mino zigzag points
if high[round(cp/2)] >= highest[cp+1](high) then
LLH = 1
else
LLH = 0
endif

if low[round(cp/2)] <= lowest[cp+1](low)  then
LLL = -1
else
LLL = 0
endif

if LLH = 1 then
LTOPy = high[round(cp/2)]
LTOPx = barindex[round(cp/2)]
endif

if LLL = -1 then
LBOTy = low[round(cp/2)]
LBOTx = barindex[round(cp/2)]
endif

if LLH>0 then
DRAWTEXT("º",LTOPx,LTOPy+ATR/2,Dialog,Bold,20) coloured(200,0,0,255)
last = 1
endif
if LLL<0 then
DRAWTEXT("º",LBOTx,LBOTy-ATR/2,Dialog,Bold,20) coloured(0,200,0,255)
last = -1
endif

RETURN last as "last"
Thanks a lot Nicolas!