

Monte Carlo simulation indicator
1) What this simulator does (and when to use it)
This indicator projects multiple possible future price paths from the latest bar, using the asset’s historical return statistics. It’s designed to answer: “Where could price plausibly go over the next N candles, given recent volatility and drift?”
It’s not a full trade backtester. Instead, it’s a path simulator: it draws NbSimu independent scenarios forward by CandleForward candles and returns the running maximum and minimum reached across all simulated paths.
2) How the engine works (high level)
-
At each bar, the script computes log-like simple returns over
NbCandlebars:v = Close / Close[NbCandle] − 1. -
Over a lookback of length
p, it estimates:-
Mean = Average[p](v)(drift) -
StandardDev = STD[p](v)(volatility)
-
-
On the last bar only (
IsLastBarUpdate), it generatesNbSimuscenarios. Each scenario evolves in steps ofNbCandlebars:-
Draw a uniform random
x ∈ (0,1)with high Precision. -
Transform
xinto a normally distributed shock (NDRV) via a rational transform (a fast inverse-CDF approximation). -
Scale and shift:
NDRV = Mean + NDRV * StandardDev. -
Update price multiplicatively:
DestPrice = OriginPrice * (1 + NDRV). -
Draw a colored segment from the previous point to the new point.
-
-
While simulating, the script tracks the highest (
mx) and lowest (mini) prices touched across all paths and returns them so you can plot bands if desired.
3) Parameters you can tune
Set these as indicator variables (they appear in the indicator’s settings):
-
NbSimu(integer): number of simulated paths to draw. More paths = smoother distribution insight, heavier workload. -
CandleForward(integer): horizon length (in candles) for each scenario. -
per(integer): lookback size used for drift/vol estimates.-
If
per = 0orper > BarIndex, the script automatically uses all available history up to the last bar.
-
-
NbCandle(integer): step size for return sampling.-
1means simulate each candle;5means jump in 5-bar blocks (useful to smooth noise).
-
Advanced internal:
-
Precisioncontrols the granularity of the uniform RNG → smoother normal transform. The default100000is already fine.
4) How to set it up in ProRealTime (step-by-step)
-
Create a new indicator in ProBuilder and paste the full code.
-
Keep the code as-is; parameters are meant to be changed via the indicator settings.
-
Apply the indicator to your chart.
-
Adjust:
-
Start with
NbSimu = 25–50,CandleForward = 50,per = 0(full history),NbCandle = 1. -
If it feels noisy, try
NbCandle = 3–5. -
For regime sensitivity (e.g., recent volatility only), set
perto a fixed window like250.
-
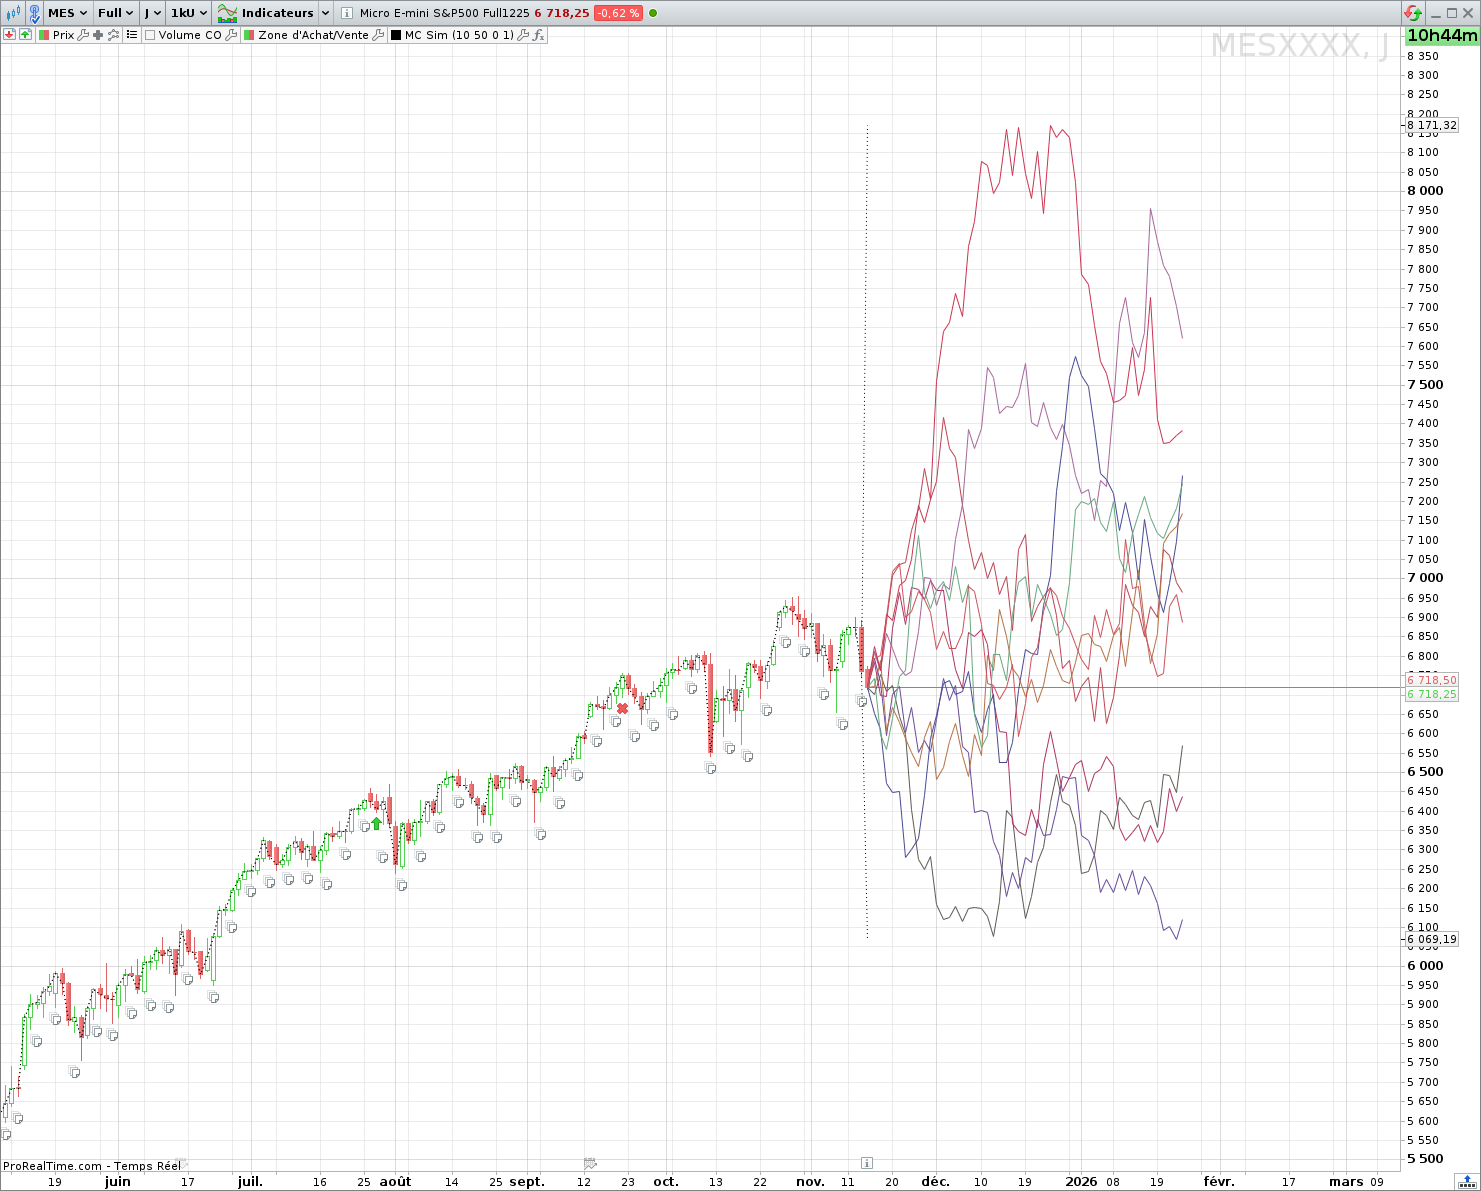
5) Reading the on-chart output
-
Colored path segments: each scenario is drawn in a random color, stepping forward from the last bar. These are possible (not predictions).
-
mxandmini(returned series): the running upper and lower envelopes reached by any scenario across all steps.-
You can plot them as lines to visualize the aggregate uncertainty band.
-
-
Because simulation runs on the last bar, paths emanate from “now” and do not clutter historical sections.
6) Practical tips for realistic simulations
-
Match your sampling to your trading lens:
-
Intraday scaling? Keep
NbCandle = 1. -
Swing lens? Use
NbCandle = 5–20to reflect multi-bar steps.
-
-
Window length (
per) matters:-
per = 0(full history) blends regimes and can under/overstate current risk. -
A rolling window (e.g., 100–250 bars) adapts better to current volatility.
-
-
Horizon vs variance: increasing
CandleForwardcompounds volatility; expect a wider fan even with the sameStandardDev. -
Drift realism: the mean return is typically small; most dispersion comes from
StandardDev. If your asset trends strongly, a shorterpermay capture it. -
Reproducibility: the internal RNG is not seeded; each refresh will produce new paths. Save snapshots if you need to keep a particular simulation.
7) Performance notes & troubleshooting
-
Drawing load: many paths × long horizons = heavy rendering. If it lags:
-
Lower
NbSimu, shortenCandleForward, or increaseNbCandle.
-
-
No lines appear? Ensure you’re on the last bar and the indicator is set to update on the live bar (the simulation runs inside
IsLastBarUpdate). -
Flat bands: happens if
StandardDevis ~0 (quiet market or too smallper). Increaseperor wait for more variability. -
Spikes/overshoots: normal shocks are unbounded; in high volatility regimes, outliers are expected by construction.
8) Code placement reminder (what you may edit safely)
-
Adjust only the parameters at the top:
NbSimu,CandleForward,per,NbCandle(and optionallyPrecision). -
The simulation core (normal transform, loops, drawing,
mx/minitracking) should be left untouched to avoid breaking the math and rendering.
// Parameters to be entered in the indicator variables:
ONCE NbSimu = 10 // Number of simulations to display
ONCE CandleForward = 50 // Simulation size (in number of candlesticks)
ONCE per = 0 // number of candlesticks for calculating statistics; if 0, then the entire history is used
ONCE NbCandle = 1 // number of candlesticks for variation calculation

// Contenu du code :
ONCE Precision=100000
if per>BarIndex or per=0 THEN
p=max(BarIndex ,1)
ELSE
p=per
ENDIF
if BarIndex >= NbCandle then
v=Close/Close[NbCandle]-1
if IsLastBarUpdate THEN
StandardDev=STD[P](v)
Mean=Average[P](v)
ENDIF
ENDIF
mx=Close
mini=close

if IsLastBarUpdate THEN
NbSimuInit=NbSimu
while NbSimu >= 1 do
r=RANDOM(50,210)
g=RANDOM(50,210)
b=RANDOM(50,210)
for i=1 to CandleForward do
// calcul de xn xn+1 & yn
if i=1 THEN
OriginInd=BarIndex
OriginPrice=Close
ELSE
OriginInd=DestInd
OriginPrice=DestPrice
ENDIF
DestInd=OriginInd+NbCandle
// Calcul de yn+1 en utilisant une loi normale
x = RANDOM(1,Precision)/Precision
// NDRV = Normaly Distributed Random Variable
if x > 1/2 THEN
NDRV = 5.5556*(1-POW((1-x)/x,0.1186))
ELSif x < 1/2 THEN
NDRV = - 5.5556*(1-POW((x)/(1-x),0.1186))
ELSE
NDRV = 0
ENDIF
NDRV = Mean + NDRV * StandardDev
DestPrice=OriginPrice*(1+NDRV)
mx=max(Destprice,mx)
mini=min(Destprice,mini)
DRAWSEGMENT(OriginInd , OriginPrice, DestInd, DestPrice) COLOURED(r,g,b)
NEXT
NbSimu = NbSimu - 1
WEND
ENDIF
RETURN mx as "max",mini as "mini"