Madness MA
Introduction
Everybody has drawn a fan of moving averages on a chart at some point. Ten, twelve lines of increasing period, and the eye does the rest: when they are stacked cleanly in order and pointing the same way, the trend is healthy. When they knot together, it is not.
That reading is entirely visual, and it stops working the moment you want to compare two instruments, scan a list, or write a rule around it. madnessMA, an indicator by karceWZROKIEM, turns it into a number.
It takes a list of moving averages — by default the Fibonacci series 1, 2, 3, 5, 8, 13, 21, 34, 55, 89, 144, 233 — and outputs three readings bounded between -100 and +100. Each one answers a different question about the same fan, and all three use the same formula.
Theory Behind the Indicator
One ratio, three questions
Every reading is built like this:
reading = 100 * SUM(signed differences) / SUM(absolute differences)
The numerator keeps the sign, the denominator throws it away. The consequences are worth stating explicitly, because they are what makes the indicator readable:
- If every difference points the same way, numerator and denominator are equal in magnitude and the ratio is +100 (or -100).
- If the differences cancel out, the ratio is around zero.
- The ratio does not grow when the averages separate. A fan spread wide apart and a fan tightly packed give the same reading as long as the ordering is the same.
That last point is the whole idea. This is a measure of agreement, not of distance. It is closer in spirit to a breadth indicator than to a momentum oscillator: it counts how many components of the fan vote in the same direction, weighted by how strongly each one votes.
The three readings
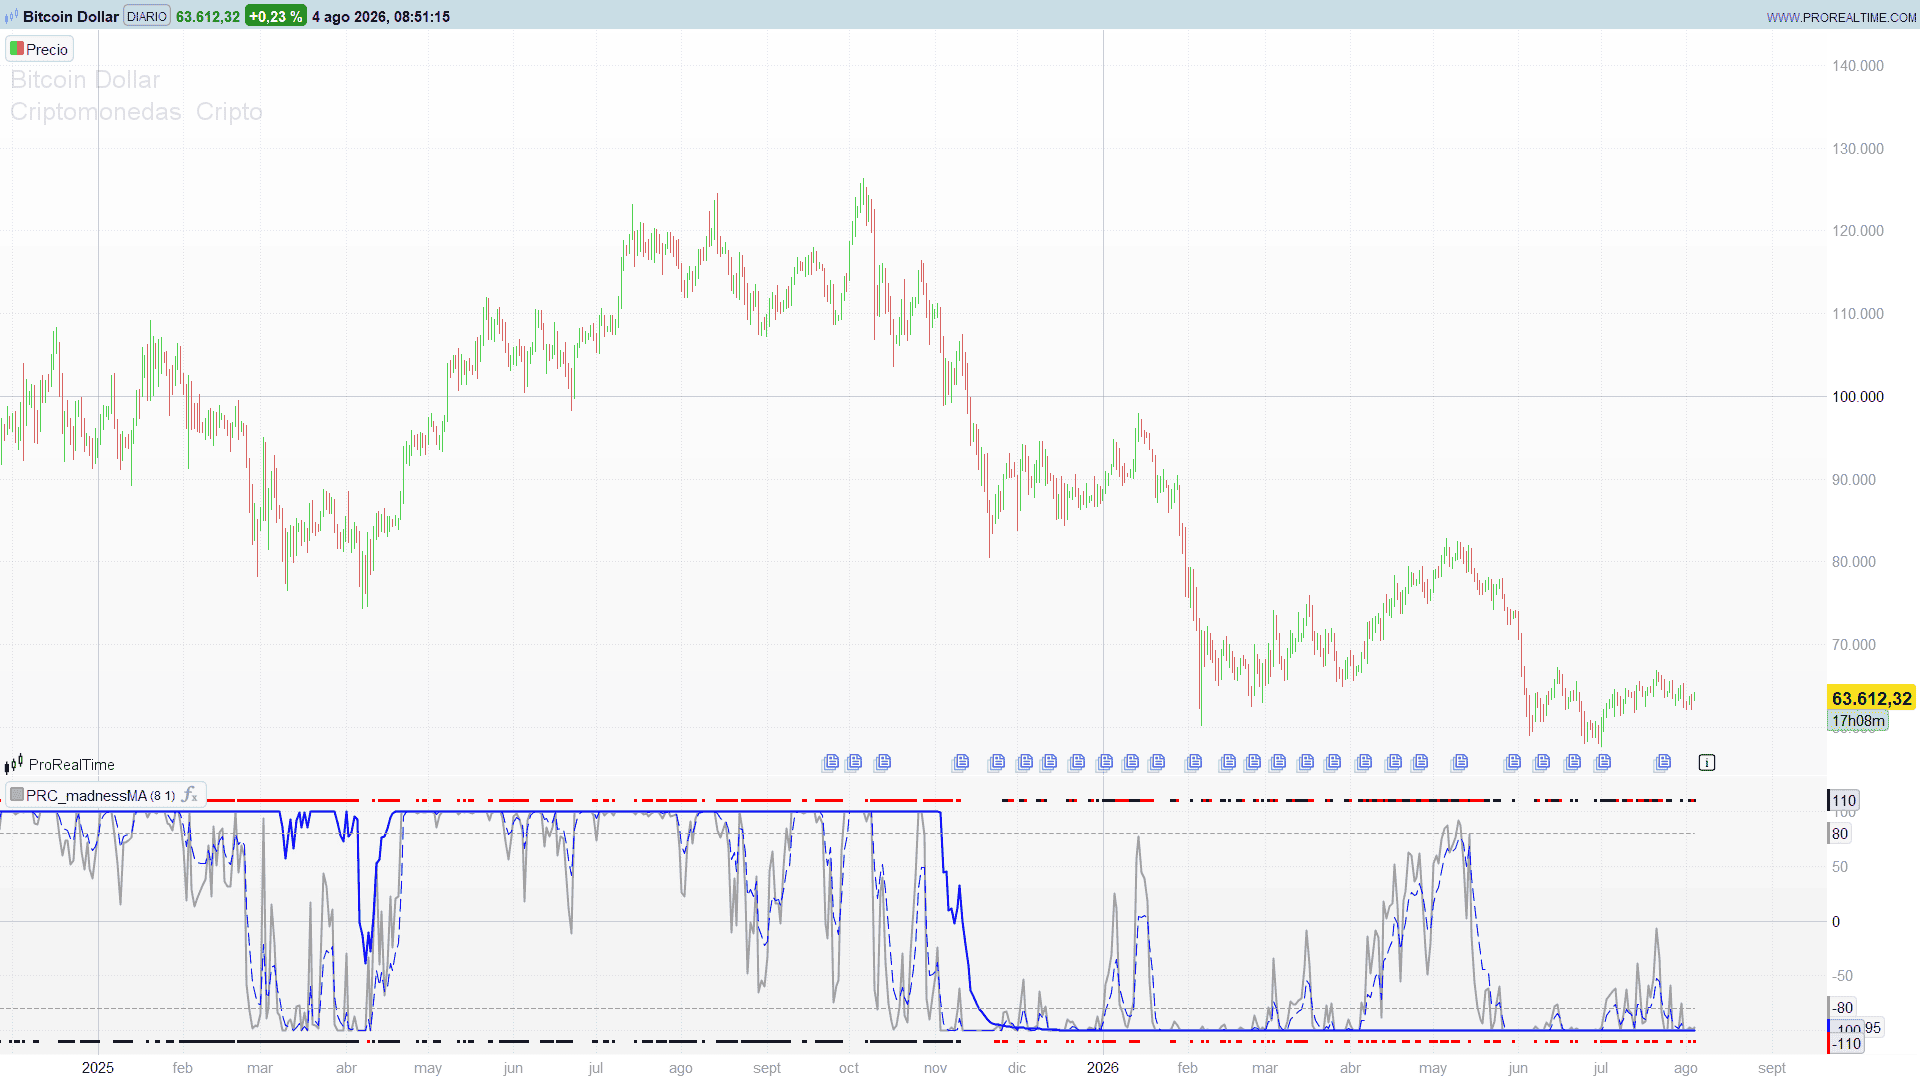
TrendDegree compares the closing price against every average in the fan. At +100 price is above all of them; at -100 it is below all of them. Crossing zero means price has worked its way through the middle of the fan.
MASortDegree compares a reference average — maCheck, default 8 — against every other average. Each comparison is signed so that a correctly stacked fan always adds in the same direction: for averages slower than the reference the sign is kept, for faster ones it is flipped. At +100 the fan is perfectly ordered for an uptrend, with every fast average above every slow one. At -100 it is perfectly ordered for a downtrend. Near zero the fan is tangled.
SortDegree compares every average against the last one on the list — the 233 by default. At +100 the whole fan sits above its slowest member; at -100, below it.
Why SortDegree anchors on a single average
The natural instinct is to make SortDegree compare every average against every other average, all pairs at once. It is worth showing why that does not work, because it is a genuinely counter-intuitive result.
Take the sum over all ordered pairs:
SUM over i, SUM over j not equal to i, of ( a[j] – a[i] )
This is exactly zero. Always. For any set of numbers, on any chart, on any timeframe. Every pair contributes a – b and also b – a, and the two cancel. The sum is antisymmetric, so the numerator vanishes before the data is even involved. An “all pairs” SortDegree would be a flat line on zero forever.
The absolute-value denominator survives that cancellation, but a zero numerator over anything is still zero.
So the comparison has to be anchored on one reference member for the sum to carry information, and the indicator anchors it on the last average of the list. This has a practical consequence that is easy to miss: the order of the list matters. Reordering the periods, or switching off the last slot, changes SortDegree completely. It is not cosmetic.
A pleasant side effect is that anchoring collapses what looks like a nested double loop into a single pass. With twelve averages that is 12 iterations per bar instead of 144, for an identical result.
The signals
Two dot series mark the conditions the author defined, at +110 and -110 so they sit clear of the curves.
Open fires when SortDegree is below both other readings and below zero, or the mirrored condition above zero. Note the polarity: the upward dot appears when SortDegree is negative — that is, when the fan is stretched below its slowest average. This is a mean-reversion reading, not a trend-following one, and the indicator does not label it as buy or sell.
Close fires when TrendDegree turns against its previous value while SortDegree sits on the other side of it, or whenever an opposite Open condition appears. Both dots showing on the same bar is normal and expected.
Key Features at a Glance
- Three normalised readings on a fixed -100 to +100 scale, directly comparable across instruments and timeframes.
- Measures agreement within the fan rather than distance, so readings do not inflate with volatility.
- Twelve configurable average periods, each of which can be switched off individually.
- Nine moving average types available for the whole fan through a single parameter.
- Reference levels at +80 and -80 marking near-perfect ordering.
- Two dot series flagging the author’s original entry and exit conditions.
- Single pass per bar over the fan, no nested loops.
How to Read the Indicator
Apply it in a separate panel below price.
Start with MASortDegree, the dashed blue line. It is the cleanest of the three. Sustained readings beyond +80 or -80 mean the fan is stacked almost perfectly — a trend that all timeframes in the list agree on. Readings oscillating around zero mean the averages are interleaved, which is what a range looks like from the inside.
TrendDegree, in grey, is the fastest to react because price moves before any average does. Treat the gap between TrendDegree and MASortDegree as an early warning: price leaving the fan while the fan is still ordered the old way is the normal signature of a turn beginning.
SortDegree, the solid blue line, is the slowest and the most structural. It tells you where the entire fan sits relative to its own long-term anchor.
Two practical notes. First, the readings are bounded, so they saturate: once all three sit at +100 the indicator cannot tell you the trend is getting stronger, only that it has not broken. Saturation is information, but it is not momentum. Second, with the default list the indicator needs 233 bars before it starts plotting anything.
Practical Applications
Regime filter. The most robust use. Require MASortDegree beyond a threshold before allowing any trend-following entry, and stand aside while it hovers near zero. Because the scale is instrument-independent, the same threshold works across a portfolio without retuning.
Divergence between the readings. TrendDegree turning down while MASortDegree stays pinned near +100 tells you price has broken away from a fan that is still fully ordered. That is a different situation from both readings falling together, and the pair separates the two cleanly.
Screener input. MASortDegree > 80 is a one-line condition that returns instruments whose entire moving average structure is aligned. It is a considerably stricter filter than any single moving average cross, and it maps directly onto ProScreener.
Fan design. The Fibonacci spacing is a choice, not a requirement. A linear list (10, 20, 30, 40…) weights the slow end differently and gives visibly different readings. Since the code packs the active slots automatically, comparing spacings is a matter of editing the numbers.
Indicator Configuration
- per01 to per12 (defaults 1, 2, 3, 5, 8, 13, 21, 34, 55, 89, 144, 233): the periods of the fan. Set a slot to 0 to disable it. The last active slot anchors SortDegree, so its position is not neutral.
- maCheck (default 8): the reference average for MASortDegree. Lower values make it more reactive, higher values more structural. It does not have to appear in the list.
- mType (default 1): the average type applied to the whole fan. 0 Simple, 1 Exponential, 2 Weighted, 3 Wilder, 4 Triangular, 5 LSMA, 6 Time Series, 7 Hull, 8 Zero-Lag. Hull and Zero-Lag react markedly faster and produce a busier MASortDegree.
Colours follow the original: grey for TrendDegree, dashed blue for MASortDegree, solid blue for SortDegree, black dots for Open and red for Close. The black dots will not show on a dark chart template — change COLOURED(0, 0, 0, aOpen) to COLOURED(255, 255, 255, aOpen) on the last block if that is your setup.
The Code
//--------------------------------------------
// PRC_madnessMA (by karceWZROKIEM)
// version = 0
// 03.08.2026
// Ivan Gonzalez @ www.prorealcode.com
// Sharing ProRealTime knowledge
//--------------------------------------------
// Conversion del indicador "Mix.mq4" (madnessMA) de MetaTrader 4.
// Mide el grado de ordenacion de un abanico de medias moviles y lo
// normaliza en tres lecturas acotadas entre -100 y +100:
//   TrendDegree   : posicion del precio respecto a TODAS las medias
//   MASortDegree  : orden del abanico respecto a la media de referencia
//   SortDegree    : dispersion del abanico respecto a la media mas lenta
// Los puntos Open/Close replican los buffers de flechas del original.
//--------------------------------------------

//=== LISTA DE MEDIAS (0 = posicion desactivada) ===
// Equivale al input "listMA" del original. El orden importa:
// la ULTIMA posicion activa es la que ancla el calculo de SortDegree.
per01 = 1
per02 = 2
per03 = 3
per04 = 5
per05 = 8
per06 = 13
per07 = 21
per08 = 34
per09 = 55
per10 = 89
per11 = 144
per12 = 233

//=== PARAMETROS ===
maCheck = 8  // media de referencia para MASortDegree (input MAcheck)
maMethod = 1 // 0=SMA  1=EMA  2=Smoothed(Wilder)  3=Linear Weighted

//--------------------------------------------
//=== MAPEO DEL METODO MT4 AL TIPO DE average[] DE PROBUILDER ===
// MT4: 0 SMA / 1 EMA / 2 SMMA / 3 LWMA
// PRT: 0 SMA / 1 EMA / 2 WMA  / 3 Wilder
IF maMethod = 0 THEN
   mType = 0
ELSIF maMethod = 2 THEN
   mType = 3
ELSIF maMethod = 3 THEN
   mType = 2
ELSE
   mType = 1
ENDIF

//--------------------------------------------
//=== CARGA DEL ABANICO (compacta solo las posiciones activas) ===
nMA = 0

IF per01 > 0 THEN
   $maPer[nMA] = per01
   $maVal[nMA] = average[per01, mType](close)
   nMA = nMA + 1
ENDIF
IF per02 > 0 THEN
   $maPer[nMA] = per02
   $maVal[nMA] = average[per02, mType](close)
   nMA = nMA + 1
ENDIF
IF per03 > 0 THEN
   $maPer[nMA] = per03
   $maVal[nMA] = average[per03, mType](close)
   nMA = nMA + 1
ENDIF
IF per04 > 0 THEN
   $maPer[nMA] = per04
   $maVal[nMA] = average[per04, mType](close)
   nMA = nMA + 1
ENDIF
IF per05 > 0 THEN
   $maPer[nMA] = per05
   $maVal[nMA] = average[per05, mType](close)
   nMA = nMA + 1
ENDIF
IF per06 > 0 THEN
   $maPer[nMA] = per06
   $maVal[nMA] = average[per06, mType](close)
   nMA = nMA + 1
ENDIF
IF per07 > 0 THEN
   $maPer[nMA] = per07
   $maVal[nMA] = average[per07, mType](close)
   nMA = nMA + 1
ENDIF
IF per08 > 0 THEN
   $maPer[nMA] = per08
   $maVal[nMA] = average[per08, mType](close)
   nMA = nMA + 1
ENDIF
IF per09 > 0 THEN
   $maPer[nMA] = per09
   $maVal[nMA] = average[per09, mType](close)
   nMA = nMA + 1
ENDIF
IF per10 > 0 THEN
   $maPer[nMA] = per10
   $maVal[nMA] = average[per10, mType](close)
   nMA = nMA + 1
ENDIF
IF per11 > 0 THEN
   $maPer[nMA] = per11
   $maVal[nMA] = average[per11, mType](close)
   nMA = nMA + 1
ENDIF
IF per12 > 0 THEN
   $maPer[nMA] = per12
   $maVal[nMA] = average[per12, mType](close)
   nMA = nMA + 1
ENDIF

maCheckVal = average[maCheck, mType](close)

//=== Periodo maximo -> barras de calentamiento ===
maxPer = maCheck
FOR kMx = 0 TO nMA - 1 DO
   IF $maPer[kMx] > maxPer THEN
      maxPer = $maPer[kMx]
   ENDIF
NEXT

//--------------------------------------------
//=== CALCULO ===
ONCE trendDeg = undefined
ONCE maSortDeg = undefined
ONCE sortDeg = undefined

IF nMA > 1 THEN
   IF barindex > maxPer THEN

      trendBuff = 0
      trendSum = 0
      srtBuff = 0
      srtSum = 0

      // --- Recorrido del abanico: TrendDegree y MASortDegree ---
      FOR kMa = 0 TO nMA - 1 DO

         // Distancia de la media de referencia a cada media del abanico.
         // Signo invertido para las medias mas rapidas o iguales que maCheck,
         // de forma que un abanico bien ordenado suma siempre en el mismo sentido.
         dRef = maCheckVal - $maVal[kMa]
         IF $maPer[kMa] <= maCheck THEN
            dRef = 0 - dRef
         ENDIF
         srtBuff = srtBuff + dRef
         srtSum = srtSum + abs(dRef)

         // Distancia del precio a cada media del abanico
         dPrc = close - $maVal[kMa]
         trendBuff = trendBuff + dPrc
         trendSum = trendSum + abs(dPrc)

      NEXT

      // --- SortDegree: abanico frente a la ULTIMA media de la lista ---
      kLast = nMA - 1
      maLast = $maVal[kLast]
      relBuff = 0
      relSum = 0

      FOR jMa = 0 TO nMA - 1 DO
         IF jMa <> kLast THEN
            dRel = $maVal[jMa] - maLast
            relBuff = relBuff + dRel
            relSum = relSum + abs(dRel)
         ENDIF
      NEXT

      // --- Normalizacion a -100..+100 ---
      IF trendSum > 0 THEN
         trendDeg = 100 * trendBuff / trendSum
      ENDIF
      IF srtSum > 0 THEN
         maSortDeg = 100 * srtBuff / srtSum
      ENDIF
      IF relSum > 0 THEN
         sortDeg = 100 * relBuff / relSum
      ENDIF

   ENDIF
ENDIF

//--------------------------------------------
//=== SENALES (buffers openOrder / closeOrder del original) ===
sigDir = 0
dotOpen = undefined
dotClose = undefined
aOpen = 0
aClose = 0

IF barindex > maxPer THEN

   IF sortDeg < trendDeg AND sortDeg <= maSortDeg AND sortDeg < 0 THEN
      sigDir = 1
   ELSIF sortDeg > trendDeg AND sortDeg >= maSortDeg AND sortDeg > 0 THEN
      sigDir = 0 - 1
   ENDIF

   IF sigDir > 0 THEN
      dotOpen = 110
      aOpen = 255
   ELSIF sigDir < 0 THEN
      dotOpen = 0 - 110
      aOpen = 255
   ENDIF

   IF (trendDeg < trendDeg[1] AND sortDeg < trendDeg) OR sigDir < 0 THEN
      dotClose = 110
      aClose = 255
   ELSIF (trendDeg > trendDeg[1] AND sortDeg > trendDeg) OR sigDir > 0 THEN
      dotClose = 0 - 110
      aClose = 255
   ENDIF

ENDIF

//--------------------------------------------
//=== NIVELES DE REFERENCIA (SetLevelValue +-80 del original) ===
lvlUp = 80
lvlDn = 0 - 80

//--------------------------------------------
RETURN trendDeg   AS "TrendDegree"  COLOURED(160, 160, 160)STYLE(line, 2),maSortDeg AS "MASortDegree" COLOURED(0, 0, 255)STYLE(dottedLine2, 1), sortDeg AS "SortDegree" COLOURED(0, 0, 255) STYLE(line, 2),dotOpen AS "Open" COLOURED(0, 0, 0, aOpen) STYLE(point, 4), dotClose   AS "Close" COLOURED(255, 0, 0, aClose) STYLE(point, 3),lvlUp AS "+80" COLOURED(160, 160, 160) STYLE(dottedLine, 1), lvlDn AS "-80" COLOURED(160, 160, 160)STYLE(dottedLine, 1)