Zeiierman Bands — An Asymmetric Volatility Envelope
Introduction
Every band indicator makes the same two assumptions, and both of them are usually wrong.
The first is that volatility is symmetric: a standard deviation is computed once and then added above and subtracted below, so the envelope is a mirror. But a market that is having its lows swept and its highs left alone is not equally volatile in both directions, and a mirrored band says it is.
The second is that a touch of the band means something. It only means something if price is being pulled back to a centre. In a trend the band is not a boundary — it is a rail, and price walks it. The indicator has no way of knowing which of the two situations it is in, so it signals in both, and half of those signals are structurally doomed.
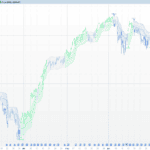
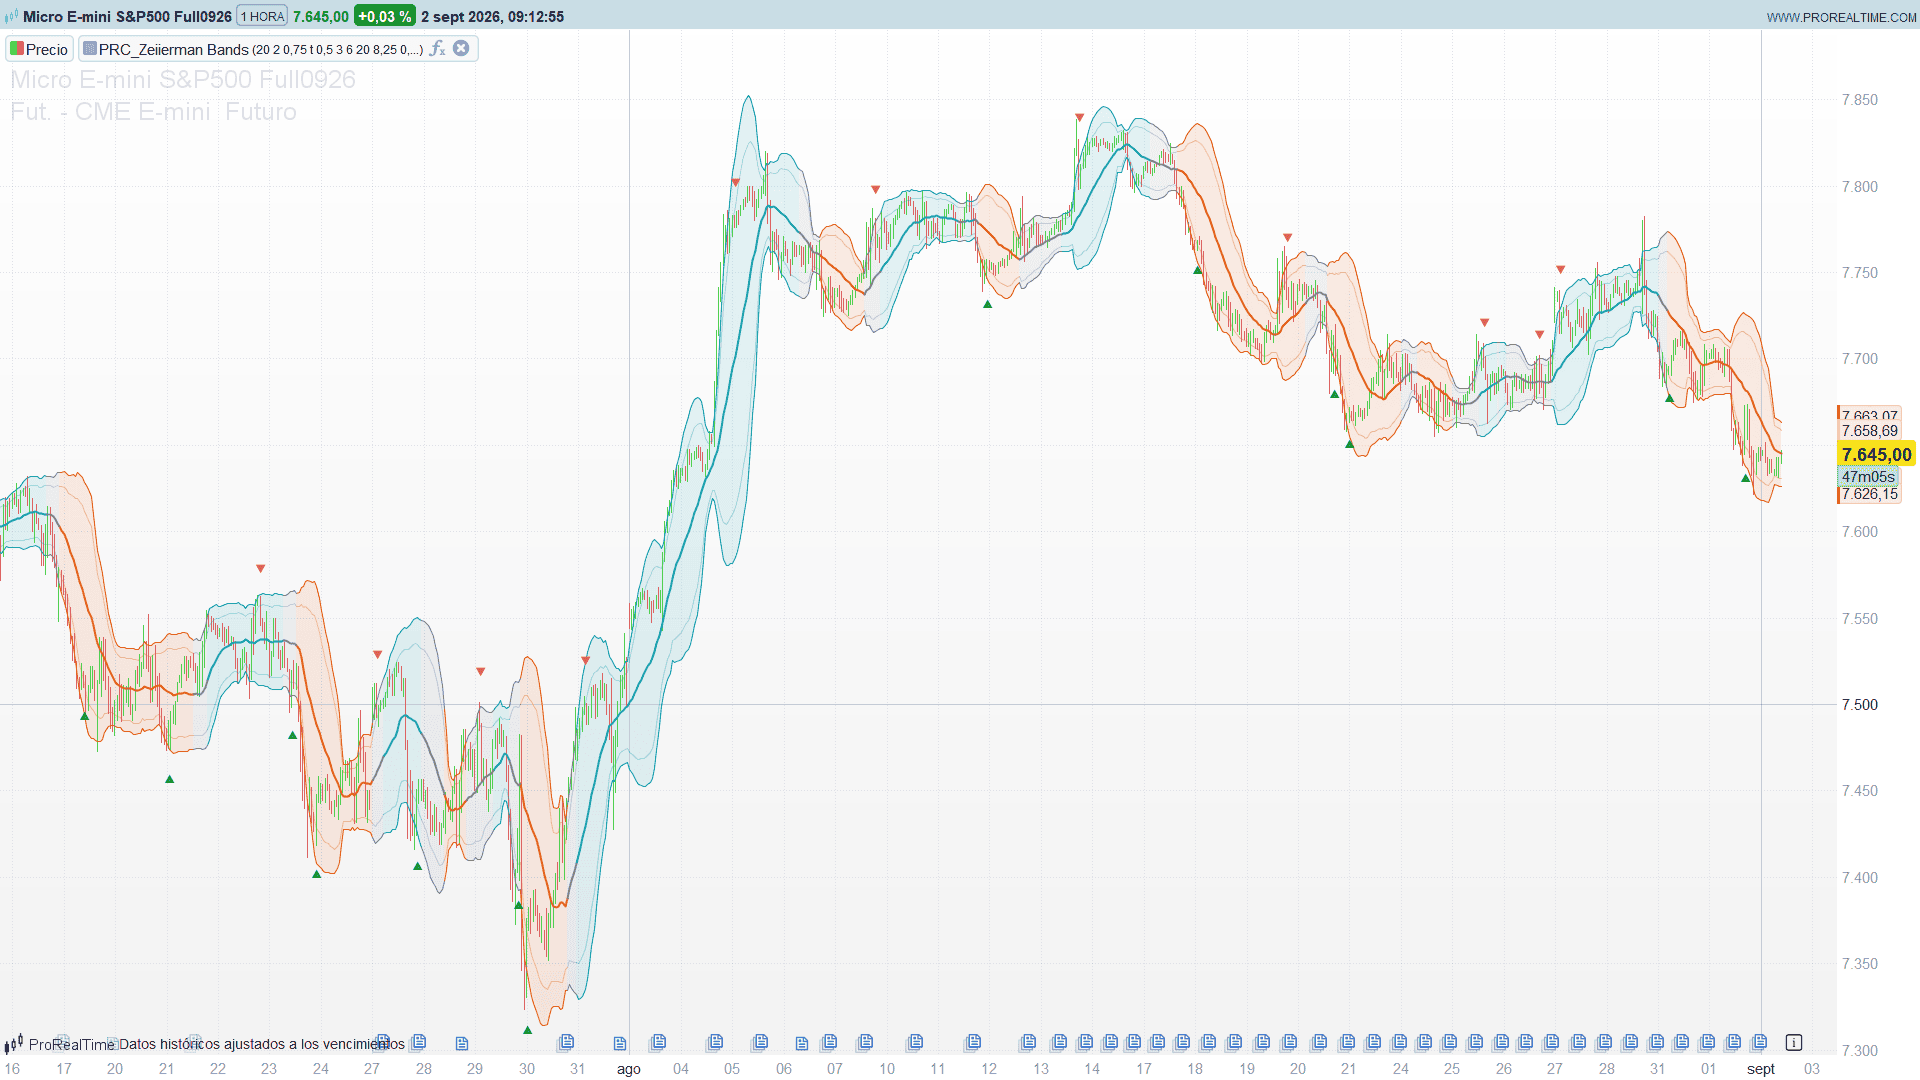
Zeiierman Bands, designed by Zeiierman, attacks both. Each side of the envelope is inflated only by the energy spent on that side, so the two halves are genuinely different widths. And before any signal is allowed out, the tool runs a statistical test on the price series to check whether a mean-reverting regime actually exists right now. When the test fails, the bands still draw — they are still useful context — but the signals go quiet.
Where the Centre Line Comes From
The baseline is not a plain moving average, although it is close enough to one to be readable.
Two adjustments are made before averaging. The first weights each bar by how much liquidity it accepted:
acceptance = (volume / average volume) / (range / average range)
A bar that traded heavy size inside a narrow range has a high value: a lot of business was done and price barely moved, which is the signature of a level the market agrees with. A wide, thin bar has a low value: price travelled a long way on very little participation, which is the signature of a vacuum. The ratio is clipped to [0.15, 6] so that one freak bar cannot dominate the window, and raised to the power 1.1 to give the extremes a little extra pull.
The second adjustment shifts the price being averaged towards the side that got rejected:
reference = close + 0.105 × (lower wick − upper wick)
A candle with a long lower wick closed higher than the market was willing to trade, so the reference is nudged up. A long upper wick nudges it down. It is a small correction by design — about a tenth of the wick imbalance — and it is there to stop a single rejection candle from dragging the centre line to a price that was refused.
The weighted average of that reference is then blended only 10 % into the plain moving average of the close. The result is a line that looks and behaves like a moving average, with a gentle bias towards where the business was actually done.
Why the Two Sides Breathe Independently
This is the part that separates the tool from a mirrored band.
Three quantities are measured over the window, all as root-mean-squares:
- the base dispersion of the close around the centre line,
- the wick energy on each side, upper and lower measured separately,
- the stress energy on each side.
Stress is the interesting one. A bar is under stress when it reaches for the recent swing extreme — within a buffer of 0.35 × average range — and the amount of stress is its wick, plus a penalty when the level was actually swept: the bar broke the swing high but closed back below it, or broke the swing low and closed back above. In that case the overshoot counts double and the give-back counts half.
upper deviation = √( base² + (0.3 × upper wick RMS)² + (0.3 × upper stress RMS)² )
lower deviation = √( base² + (0.3 × lower wick RMS)² + (0.3 × lower stress RMS)² )
The two share the base term and nothing else. If the last twenty bars have been probing lows and getting rejected, the lower deviation grows and the upper one does not: the envelope becomes visibly lopsided, wide underneath and tight on top. That asymmetry is the reading. It says which side the market has been fighting over.
The outer bands sit at deviation × 2.0, and a second, inner pair sits at 75 % of that distance. The gap between the inner and the outer band is the zone where signals are born, which is the next section.
The Regime Test
Everything above still describes a band. This is the part that decides whether the band is allowed to speak.
The tool fits a first-order autoregression on the log distance between price and the centre line:
x     = log(close / centre line)
x[t]  ≈ φ × x[t−1]
φ is the fraction of the deviation that survives one bar. If it is close to 1, deviations persist and price is drifting away, which is a trend. If it is close to 0, deviations vanish instantly, which is noise. In between, the deviation decays, and the decay has a half-life:
half-life = log(0.5) / log(φ)
That is the number of bars a typical excursion needs to give back half of itself. Two conditions are then imposed:
- the half-life must sit between 2 bars and
2 × length / strictnessbars — fast enough to be tradeable, slow enough to be real, - and the centre line itself must not have drifted more than
1 / strictnessdeviations over the lastlengthbars.
The second condition is the one people forget. A series can pass an autoregression test and still be useless if the thing it is reverting to is running away underneath it. Both must hold, on the current bar, or no signal is issued.
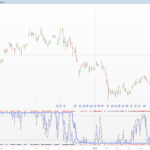
With the default strictness of 0.5, the acceptable half-life window is 2 to 80 bars and the drift ceiling is 2 deviations. Tightening strictness to 1.0 halves both and makes the tool considerably quieter.
You can switch this filter off. Do it once, look at how many marks appear in the trending sections of the chart, and you will have a good idea of what it is doing.
Armed, Then Fired
Signals are not band touches. They are a two-step state machine, one shot per excursion:
- Arming. Price closes beyond the outer band — the asymmetric distance is at least
2.0deviations from the centre. The corresponding side is now armed. Nothing is drawn. - Firing. Price crosses back through the inner band on that same side, still on the far side of the centre line. The triangle is printed and the side disarms immediately.
The state is also cleared when price crosses the centre line — an excursion that made it all the way through does not get a second chance on the way back — and whenever the regime test stops passing. That last rule matters: if the market moves into a trending regime while a side is armed, the arming is thrown away rather than left waiting for a reclaim that no longer means anything.
What this buys you is that the tool never signals into an extension. It requires price to have been outside, and to have come back, in a market where coming back is statistically what tends to happen.
The Colour Engine
The colour of every line and of the fill comes from a separate engine that reads a higher timeframe, and it answers a different question: not “is price stretched” but “is price being carried”.
Two measurements are combined. The first is where price sits inside the range of the last closed higher timeframe candle, normalised so that the top of that range is +1 and the bottom is −1. The second is path efficiency:
efficiency = |close − close[n]| / (sum of the absolute bar-to-bar moves over n bars)
A value of 1 is a straight line; a value near 0 is a saw. Multiplying position by efficiency gives a signed number that is large only when price is both at an extreme of the higher timeframe range and got there directly.
That number then feeds a smoother with a deliberately asymmetric coefficient: it builds with a period of 6 and releases with a period of 20. Tension therefore accumulates quickly when the market is committing and bleeds off slowly when it stops, which is the behaviour you want from a regime label — quick to acknowledge a change, reluctant to abandon it on one quiet bar.
Above +0.20 the bands turn bullish, below −0.20 bearish, and in between neutral. There is an optional switch, off by default, that makes long reclaims require the bullish colour and short reclaims the bearish one. Turned on, it converts the tool from a counter-trend instrument into a pullback instrument.
The higher timeframe is read with updateonclose, so the colour never changes inside a higher timeframe candle and never revises itself afterwards.
The Code
Insert it on price. One line of the timeframe block must be uncommented — the one matching your chart — and it must never be lower than the chart timeframe.
//----------------------------------------------
//PRC_Zeiierman Bands by Zeiierman
//version = 1
//01.09.2026
//Ivan Gonzalez @ www.prorealcode.com
//Concept and design: Zeiierman - CC BY-NC-SA 4.0
//Sharing ProRealTime knowledge
//----------------------------------------------
// Overlay indicator. Adaptive liquidity envelope: the centre line is a
// volume-per-range weighted mean biased by candle rejection, each side of the
// envelope breathes independently with the wick and sweep energy of THAT side,
// an Ornstein-Uhlenbeck test gates the reclaim signals, and the whole envelope
// is coloured by a higher timeframe tension engine.
//----------------------------------------------


// === 1. BAND BEHAVIOUR ===
lengthN  = 20     // rolling window: mean, deviation, sweep horizon and OU model
devMult  = 2.0    // outer band distance, in adaptive sigmas
reclaimR = 0.75   // inner reclaim bands as a fraction of the outer deviation


// === 2. OU FILTER ===
useOU    = 1      // 1 = reclaim signals require a valid mean reverting regime
ouStrict = 0.5    // higher = faster reversion and lower drift required


// === 3. LIQUIDITY COLOUR ENGINE ===
effLen    = 3     // path efficiency length
buildLen  = 6     // tension build length
relLen    = 20    // tension release length
maxTens   = 8.25  // tension cap
trendTens = 0.20  // tension needed to leave the neutral state


// === 4. COLOURS AND STYLE ===
showFill   = 1    // 1 = fill the band envelope
showSig    = 1    // 1 = draw the reclaim triangles
alignTrend = 0    // 1 = long reclaims only while bull coloured, shorts while bear
neutR = 120       // neutral regime
neutG = 123
neutB = 134
bullR = 0         // bullish tension regime
bullG = 151
bullB = 167
bearR = 230       // bearish tension regime
bearG = 81
bearB = 0
longR = 0         // long reclaim triangle
longG = 150
longB = 90
shortR = 255      // short reclaim triangle
shortG = 82
shortB = 82


// === DERIVED CONSTANTS ===
innerMult = devMult * reclaimR
negInner  = 0 - innerMult
negDev    = 0 - devMult
sweepLen  = max(3, round(lengthN * 0.5))
alLen     = max(30, lengthN * 6)


//----------------------------------------------
// HIGHER TIMEFRAME READ BY THE COLOUR ENGINE
// The colour comes from the range of the last CLOSED candle of a timeframe
// ABOVE the chart one. ProRealTime only reads upwards: the timeframe written
// in the block must be equal to or higher than the chart timeframe, never
// lower.
//
// This does NOT change your chart. Trade the chart you want and uncomment
// ONLY the line matching it - left column is the chart you are looking at,
// right column is the line to leave active:
//    chart 1 to 5 min      ->  timeframe(1 hour, updateonclose)
//    chart 15 to 30 min    ->  timeframe(4 hours, updateonclose)
//    chart 1 to 4 hours    ->  timeframe(daily, updateonclose)    <- default
//    chart daily           ->  timeframe(weekly, updateonclose)
//----------------------------------------------
//timeframe(1 hour, updateonclose)
//timeframe(4 hours, updateonclose)
timeframe(daily, updateonclose)
//timeframe(weekly, updateonclose)
htfHigh = high
htfLow  = low
timeframe(default)


//----------------------------------------------
// LIQUIDITY ACCEPTANCE
// How much size the bar absorbed per unit of range. A bar that trades heavy
// volume inside a narrow range is accepted price and weighs more in the mean;
// a wide thin bar is not and weighs less.
//----------------------------------------------
if barindex = 0 then
   prevClose = close
else
   prevClose = close[1]
endif
prevClose = max(prevClose, pointsize)
trng = max(high - low, max(abs(high - prevClose), abs(low - prevClose)))
volAvg = average[lengthN](volume)
rngAvg = average[lengthN](trng)


hasVol = 0
volRat = 1.0
if volume > 0 and volAvg <> undefined and volAvg > 0 then
   hasVol = 1
   volRat = volume / volAvg
endif
rngRat = 1.0
if rngAvg <> undefined and rngAvg > pointsize then
   rngRat = trng / rngAvg
endif
accRaw = 1.0
if hasVol = 1 then
   accRaw = volRat / max(rngRat, 0.20)
endif
accept = max(0.15, min(6.0, accRaw))
wgt = pow(accept, 1.1)


//----------------------------------------------
// REJECTION PRICE AND LIQUIDITY MEAN
// The close is pulled towards the side that got rejected (long lower wick
// pushes the reference up), then the weighted mean is blended 10% into the
// plain average so the centre line stays smooth.
//----------------------------------------------
upWick = max(0, high - max(open, close))
dnWick = max(0, min(open, close) - low)
adjPrice = close + 0.105 * (dnWick - upWick)


priceMean = average[lengthN](close)
sumApW = summation[lengthN](adjPrice * wgt)
sumW   = summation[lengthN](wgt)
bandMid = priceMean
if priceMean <> undefined and sumW <> undefined and sumW > 0 then
   bandMid = priceMean + 0.1 * (sumApW / sumW - priceMean)
endif


//----------------------------------------------
// LIQUIDITY STRESS
// Energy spent hunting the recent swing: the wick alone when price only got
// near it, plus the overshoot and the give-back when it actually swept it.
//----------------------------------------------
prevHigh = highest[sweepLen](high)[1]
prevLow  = lowest[sweepLen](low)[1]
sweepUp = 0
if prevHigh <> undefined and high > prevHigh and close < prevHigh then
   sweepUp = 1
endif
sweepDn = 0
if prevLow <> undefined and low < prevLow and close > prevLow then
   sweepDn = 1
endif
bufDist = trng * 0.35
if rngAvg <> undefined then
   bufDist = rngAvg * 0.35
endif
upStress = 0
if prevHigh <> undefined and high >= prevHigh - bufDist then
   upStress = upWick
   if sweepUp = 1 then
      upStress = upStress + 2.0 * (high - prevHigh) + 0.5 * (high - close)
   endif
endif
dnStress = 0
if prevLow <> undefined and low <= prevLow + bufDist then
   dnStress = dnWick
   if sweepDn = 1 then
      dnStress = dnStress + 2.0 * (prevLow - low) + 0.5 * (close - low)
   endif
endif


//----------------------------------------------
// ASYMMETRIC DEVIATION
// Base dispersion around the centre line, inflated on each side ONLY by the
// wick and sweep energy of that side. Hence the two halves are not mirrored.
// summation gives the rolling sums, so the whole block is O(1) per bar.
//----------------------------------------------
sumC  = summation[lengthN](close)
sumCC = summation[lengthN](close * close)
baseSig = undefined
if sumCC <> undefined and sumC <> undefined and bandMid <> undefined then
   baseVar = sumCC / lengthN - 2 * bandMid * sumC / lengthN + bandMid * bandMid
   baseSig = sqrt(max(baseVar, 0))
endif
upRms  = sqrt(summation[lengthN](upWick * upWick) / lengthN)
dnRms  = sqrt(summation[lengthN](dnWick * dnWick) / lengthN)
upeRms = sqrt(summation[lengthN](upStress * upStress) / lengthN)
dneRms = sqrt(summation[lengthN](dnStress * dnStress) / lengthN)


ugDev = undefined
lgDev = undefined
if baseSig <> undefined and upRms <> undefined and dnRms <> undefined then
   if upeRms <> undefined and dneRms <> undefined then
      ugDev = sqrt(baseSig * baseSig + 0.09 * upRms * upRms + 0.09 * upeRms * upeRms)
      lgDev = sqrt(baseSig * baseSig + 0.09 * dnRms * dnRms + 0.09 * dneRms * dneRms)
   endif
endif


upBand = undefined
dnBand = undefined
upIn   = undefined
dnIn   = undefined
zScore = undefined
if ugDev <> undefined and lgDev <> undefined then
   upBand = bandMid + devMult * ugDev
   dnBand = bandMid - devMult * lgDev
   upIn   = bandMid + innerMult * ugDev
   dnIn   = bandMid - innerMult * lgDev
   if close >= bandMid and ugDev > 0.0000000001 then
      zScore = (close - bandMid) / ugDev
   endif
   if close < bandMid and lgDev > 0.0000000001 then
      zScore = (close - bandMid) / lgDev
   endif
endif


//----------------------------------------------
// ORNSTEIN-UHLENBECK REGIME
// AR(1) on log(close / centre line). The autoregressive coefficient gives the
// half life of the pull back to the mean: it must be neither instantaneous nor
// infinite, and the mean itself must not be drifting away in sigma terms.
//----------------------------------------------
logDev = undefined
if bandMid <> undefined and bandMid > 0 then
   logDev = log(max(close, pointsize) / bandMid)
endif
ouReady = 0
if barindex > alLen + lengthN then
   ouReady = 1
endif
phi = undefined
if ouReady = 1 then
   sumXar = summation[alLen](logDev[1])
   sumYar = summation[alLen](logDev)
   sumXY  = summation[alLen](logDev * logDev[1])
   sumXX  = summation[alLen](logDev[1] * logDev[1])
   if sumXar <> undefined and sumYar <> undefined and sumXY <> undefined and sumXX <> undefined then
      mXar = sumXar / alLen
      mYar = sumYar / alLen
      covXY = sumXY / alLen - mXar * mYar
      varXar = sumXX / alLen - mXar * mXar
      if varXar > 0.000000000001 then
         phi = covXY / varXar
      endif
   endif
endif
hLife = undefined
if phi <> undefined and phi > 0 and phi < 1 then
   hLife = log(0.5) / log(phi)
endif
driftZ = undefined
if ugDev <> undefined and lgDev <> undefined then
   sigAvg = (ugDev + lgDev) * 0.5
   if sigAvg > 0.0000000001 and bandMid[lengthN] <> undefined then
      driftZ = abs(bandMid - bandMid[lengthN]) / sigAvg
   endif
endif
maxHL = lengthN * 2.0 / ouStrict
maxZv = 1.0 / ouStrict
filterOK = 0
if useOU = 1 then
   if ouReady = 1 and zScore <> undefined and hLife <> undefined and driftZ <> undefined then
      if hLife >= 2 and hLife <= maxHL and driftZ <= maxZv then
         filterOK = 1
      endif
   endif
else
   if zScore <> undefined then
      filterOK = 1
   endif
endif


//----------------------------------------------
// LIQUIDITY WARP COLOUR ENGINE
// Where price sits inside the last closed higher timeframe range, scaled by
// how directly it travelled there (path efficiency), then smoothed with a
// fast build / slow release filter and thresholded into three regimes.
//----------------------------------------------
hRange = htfHigh - htfLow
npos = 0
if htfHigh <> undefined and htfLow <> undefined and hRange > 0 then
   htfMid = (htfHigh + htfLow) * 0.5
   npos = 2.0 * (close - htfMid) / max(hRange, pointsize)
endif
stepAbs = abs(close - close[1])
avStep = average[effLen](stepAbs)
effRatio = 0
if avStep <> undefined then
   totPath = avStep * effLen
   netMove = abs(close - close[effLen])
   if totPath > pointsize then
      effRatio = min(netMove / totPath, 1.0)
   endif
endif
tensTgt = max(0 - maxTens, min(maxTens, npos * effRatio))
if barindex <= effLen + 1 then
   tens = 0
else
   prevT = tens[1]
   sameDir = 0
   if prevT = 0 or tensTgt = 0 then
      sameDir = 1
   elsif prevT > 0 and tensTgt > 0 then
      sameDir = 1
   elsif prevT < 0 and tensTgt < 0 then
      sameDir = 1
   endif
   alphaT = 2.0 / (relLen + 1.0)
   if sameDir = 1 and abs(tensTgt) > abs(prevT) then
      alphaT = 2.0 / (buildLen + 1.0)
   endif
   tens = max(0 - maxTens, min(maxTens, prevT + alphaT * (tensTgt - prevT)))
endif
regime = 0
if tens >= trendTens then
   regime = 1
elsif tens <= 0 - trendTens then
   regime = -1
endif
cr = neutR
cg = neutG
cb = neutB
if regime = 1 then
   cr = bullR
   cg = bullG
   cb = bullB
endif
if regime = -1 then
   cr = bearR
   cg = bearG
   cb = bearB
endif


//----------------------------------------------
// RECLAIM STATE MACHINE
// Arm on a close beyond the outer band, fire when price crosses back through
// the inner band on the same side. Disarm on the fire, on a mid line cross,
// or as soon as the OU regime stops being valid: one shot per excursion.
//----------------------------------------------
crossUp = 0
crossDn = 0
if zScore <> undefined and zScore[1] <> undefined then
   if zScore > negInner and zScore[1] <= negInner then
      crossUp = 1
   endif
   if zScore < innerMult and zScore[1] >= innerMult then
      crossDn = 1
   endif
endif
if barindex = 0 then
   armLong = 0
   armShort = 0
else
   armLong = armLong[1]
   armShort = armShort[1]
endif
longRec = 0
shortRec = 0
if filterOK = 1 and armLong = 1 and crossUp = 1 and zScore < 0 then
   if alignTrend = 0 or regime = 1 then
      longRec = 1
   endif
endif
if filterOK = 1 and armShort = 1 and crossDn = 1 and zScore > 0 then
   if alignTrend = 0 or regime = -1 then
      shortRec = 1
   endif
endif
if filterOK = 0 or longRec = 1 or shortRec = 1 then
   armLong = 0
   armShort = 0
elsif zScore <> undefined then
   if zScore <= negDev then
      armLong = 1
      armShort = 0
   endif
   if zScore >= devMult then
      armShort = 1
      armLong = 0
   endif
   if zScore >= 0 then
      armLong = 0
   endif
   if zScore <= 0 then
      armShort = 0
   endif
endif


//----------------------------------------------
// RENDER
// The triangles are historical event marks, so NO drawonlastbaronly here:
// the defparam would wipe every past signal on each new bar.
// A mark is only printed once its bar has closed, and it is anchored to THAT
// bar: condition and X coordinate belong to the same candle, and the anchor is
// frozen, so ticks cannot smear it.
//----------------------------------------------
atr14 = averagetruerange[14]
kOff = 2.0 / 201.0
if barindex < 14 then
   atrOff = atr14
else
   atrOff = atrOff[1] + kOff * (atr14 - atrOff[1])
endif


if barindex > 0 and showSig = 1 and atrOff[1] <> undefined then
   if longRec[1] = 1 then
      drawtext("▲", barindex - 1, low[1] - atrOff[1], SansSerif, Bold, 11) coloured(longR, longG, longB, 255)
   endif
   if shortRec[1] = 1 then
      drawtext("▼", barindex - 1, high[1] + atrOff[1], SansSerif, Bold, 11) coloured(shortR, shortG, shortB, 255)
   endif
endif


fillA = 0
if showFill = 1 then
   fillA = 26
endif
colorbetween(upBand, dnBand, cr, cg, cb, fillA)


return bandMid coloured(cr, cg, cb, 230) style(line, 2) as "Liquidity Mean", upBand coloured(cr, cg, cb, 255) style(line, 1) as "Upper Band", dnBand coloured(cr, cg, cb, 255) style(line, 1) as "Lower Band", upIn coloured(cr, cg, cb, 77) style(line, 1) as "Upper Reclaim", dnIn coloured(cr, cg, cb, 77) style(line, 1) as "Lower Reclaim"
Settings
lengthN (20) — the rolling window. It is used by four different things at once: the centre line, the deviations, the sweep horizon (half of it) and the regime model (six times it). Raising it makes everything slower and wider, and it also lengthens the warm-up considerably, since the regime model needs 6 × lengthN + lengthN bars before it produces anything.
devMult (2.0) — where the outer bands sit, in adaptive deviations. This is the arming threshold, so it directly controls how rare the signals are.
reclaimR (0.75) — where the inner bands sit, as a fraction of the outer distance. Lower it and the reclaim triggers sooner, closer to the extreme; raise it towards 0.95 and price has to come almost all the way back before the triangle appears. It is the trade-off between entering early into something that may still be extending, and entering late into something that has already moved.
useOU (1) and ouStrict (0.5) — the regime filter and how demanding it is. Higher strictness requires a faster reversion and a flatter centre line. Setting useOU to 0 turns the filter off entirely, which is worth doing once as an experiment and not much more.
effLen (3) — the path efficiency window of the colour engine. Short by design: it measures whether the last few bars travelled directly, not whether the last fifty did.
buildLen (6) and relLen (20) — how fast the colour state builds and how slowly it releases. Bringing them together makes the colour symmetric and noticeably more nervous.
maxTens (8.25) and trendTens (0.20) — the cap on the tension state and the threshold that separates neutral from directional. Raising the threshold widens the neutral zone and leaves the bands grey most of the time.
showFill (1), showSig (1) — the envelope fill and the reclaim triangles.
alignTrend (0) — set it to 1 to require the bullish colour for long reclaims and the bearish colour for short ones.
Colours — neutR/G/B, bullR/G/B, bearR/G/B for the three regimes, and longR/G/B, shortR/G/B for the two triangles. They are mid-tones rather than neon so that they hold up on both a white and a dark chart background.
The timeframe block — four commented lines, one of which must be active. As a rule of thumb: a 1 to 5 minute chart reads 1 hour, 15 to 30 minutes reads 4 hours, 1 to 4 hours reads daily, and a daily chart reads weekly.