

K's Reversal Indicator
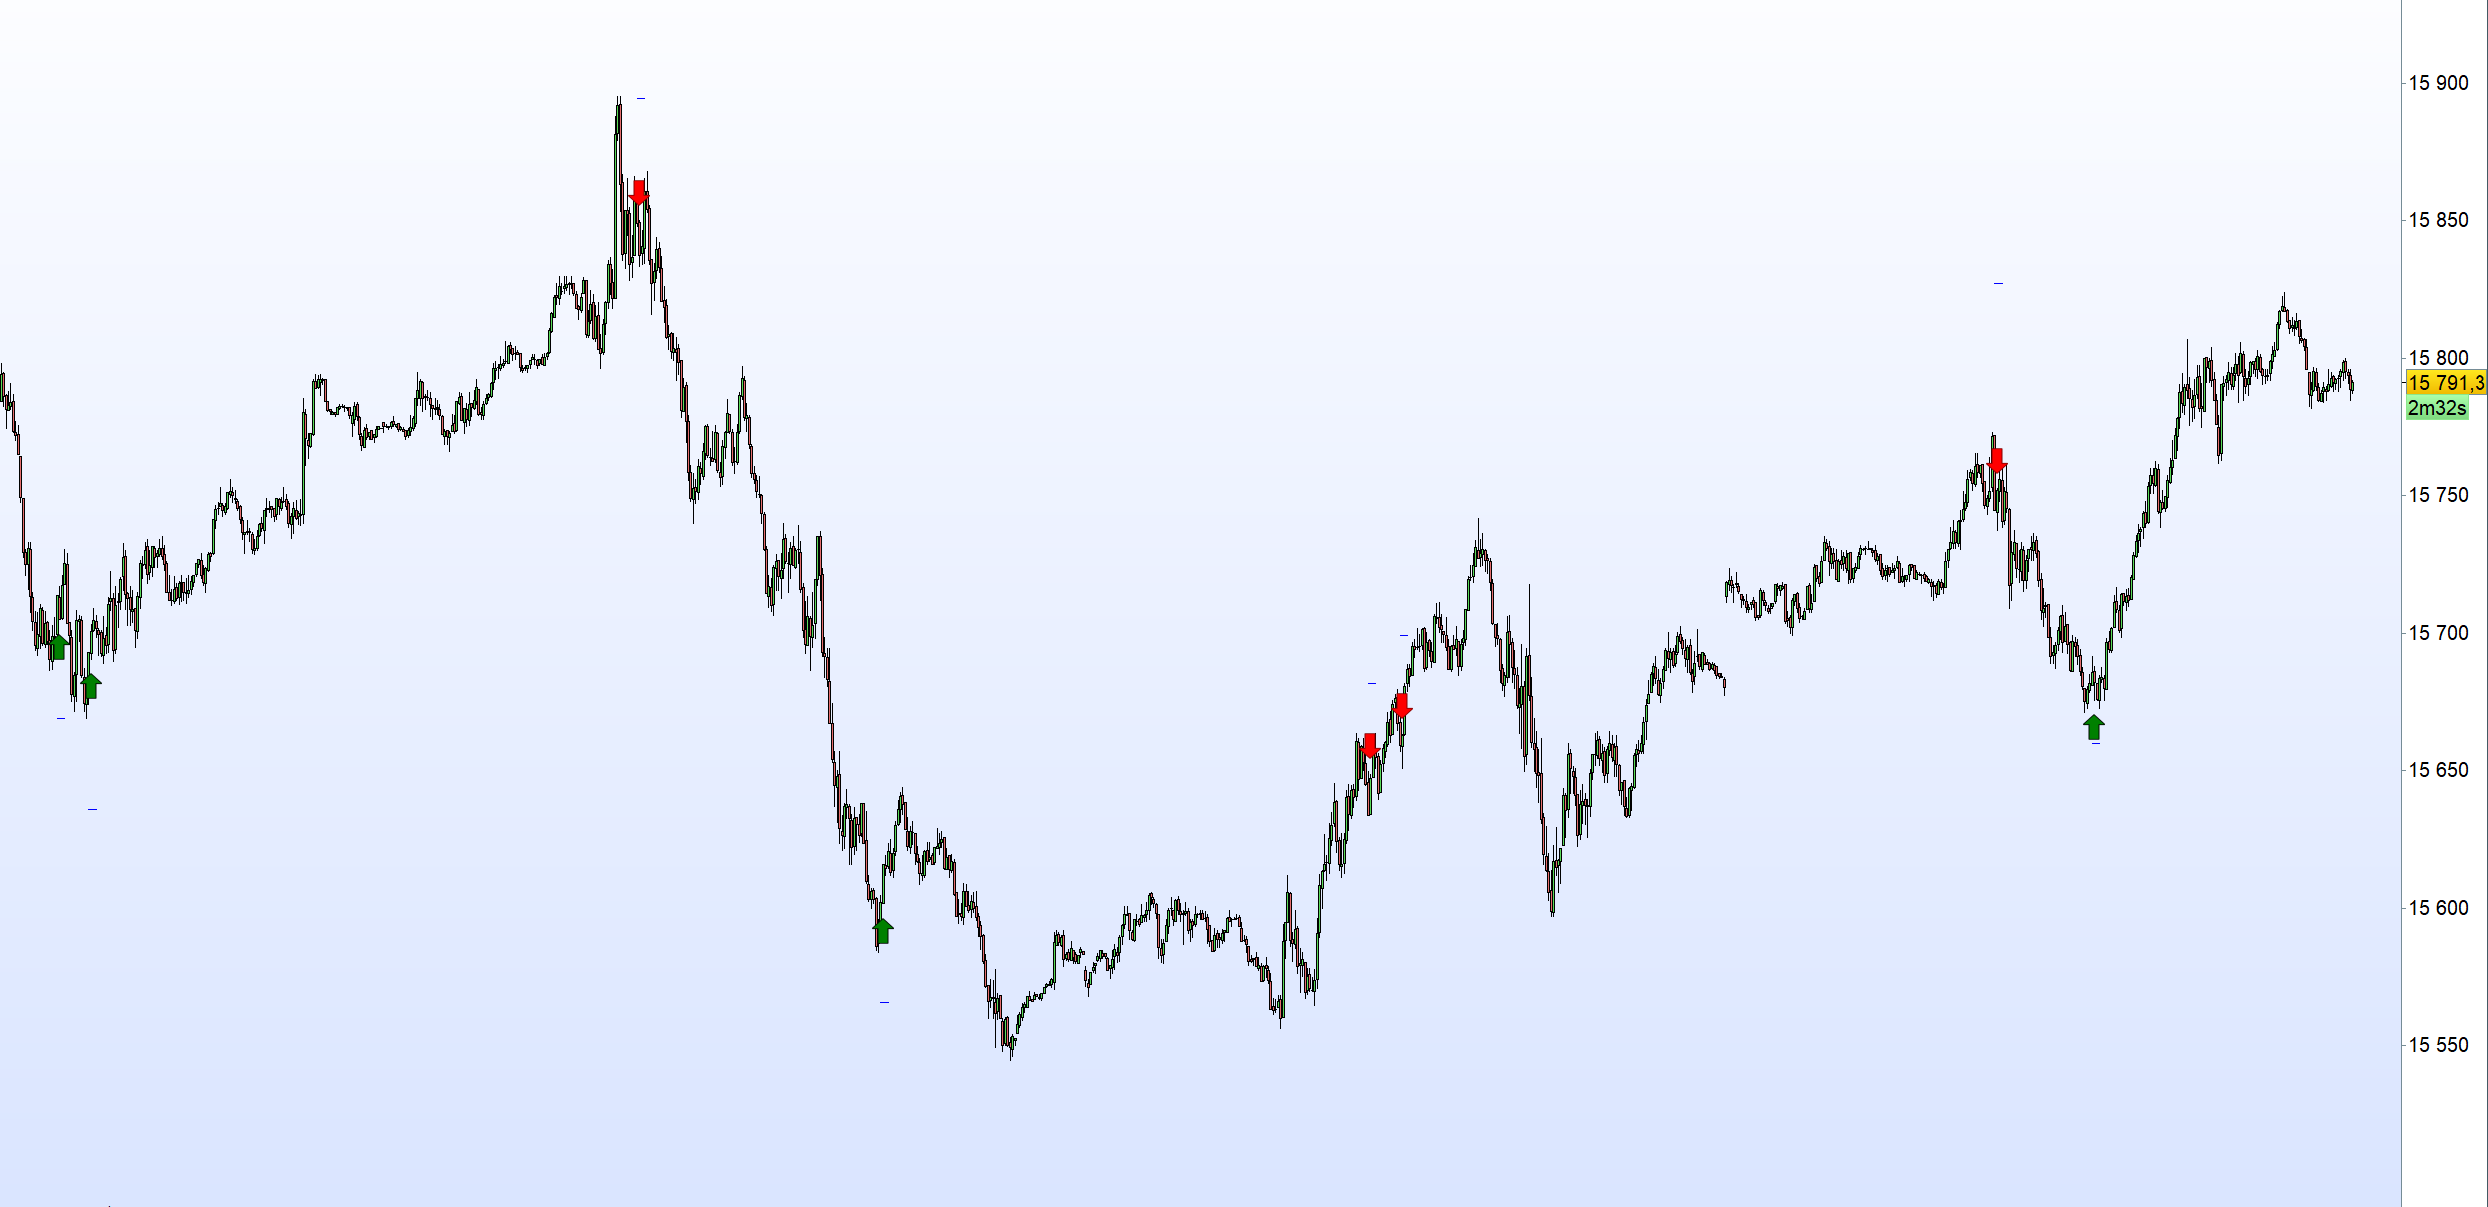
K’s reversal indicator I is a special combination between Bollinger bands and the MACD oscillator. It is a contrarian indicator that depends on the following conditions:
• A buy signal is generated whenever the current market price is below the 100-period lower Bollinger band while simultaneously, the MACD value must be above its signal line. At the same time, the previous MACD value must be below its previous signal line.
• A sell (short) signal is generated whenever the current market price is above the 100-period upper Bollinger band while simultaneously, the MACD value must be below its signal line. At the same time, the previous MACD value must be above its previous signal line.
The way to use K’s reversal indicator is to combine it with your already long/short bias in a sideways/range market in order to maximize the probability of success.
Limitations of the indicator include the following:
• There are no clear exit rules that work well on average across the markets. Even though K’s reversal indicator gives contrarian signals, it does not show when to exit the positions.
• As with other indicators, it underperforms on some markets and is not to be used everywhere.
• False signals tend to occur during trending markets but there is no proven way to detect a false signal.
fast=12
slow=26
signal=9
length=20
multiplier=2.0

// MACD
MyMACDline = ExponentialAverage[fast](close)-ExponentialAverage[slow](close)
signalline = ExponentialAverage[signal](MyMACDline)

// bollinger
midline = Average[length](close)
lowerBoll = midline-multiplier*STD[length](close)
upperBoll = midline+multiplier*STD[length](close)

// Signal

buySignal = Min(open[1],close[1]) <= lowerBoll[1] and Max(open[1],close[1]) <= midline and MyMACDline[1] > signalline[1] and MyMACDline[2] < signalline[2]

sellsignal = Max(open[1],close[1]) >= upperBoll[1] and Min(open[1],close[1]) >= midline and MyMACDline[1] < signalline[1] and MyMACDline[2] > signalline[2]

// Plotting

If buySignal then
DRAWARROWUP(barindex, low-10) coloured("green",255)
Drawsegment(barindex-1, low[1] - (high[1] - low[1]) * 2, barindex+2, low[1] - (high[1] - low[1]) * 2) coloured("blue",255)
Endif

If sellsignal then
DRAWARROWDOWN(barindex, high+10)coloured("red",255)
Drawsegment(barindex-1, high[1] + (high[1] - low[1]) * 2, barindex+2, high[1] + (high[1] - low[1]) * 2) coloured("blue",255)
Endif

Return