

Self-Aware Trend System
Introduction
The Self-Aware Trend System (by WillyAlgoTrader) is a SuperTrend-based engine that goes well beyond the classical formulation. It looks at the market’s own behaviour and rewires itself in real time: the trail tightens or relaxes, the bands become asymmetric, the take-profit targets stretch or shrink, and a 4-factor quality index tracks how clean the current trend really is. On top of that, every closed signal updates a rolling stats engine — win rate, average R, drawdown, streaks and a 3×3 regime grid — that the system uses to optionally self-calibrate its own quality parameter.
The result is a single-line overlay that behaves very differently from a fixed-multiplier SuperTrend: in a clean impulsive move the band hugs the price aggressively; in chop it widens and the system disengages; on a quality collapse the trend can flip even before price actually breaks the line. Each signal arrives with an entry, a stop based on the last pivot, three R-multiple targets and a numeric score from 0 to roughly 100 summarising six independent components.
This article walks through what each module does, how to read the chart, how to configure the indicator and ships the full ProBuilder code.
Theory Behind the Indicator
1. Adaptive SuperTrend on Efficiency-Weighted ATR
The base SuperTrend uses an ATR that has been weighted by Kaufman’s Efficiency Ratio (ER):
atrEffective = rawATR × (0.5 + 0.5 × ER)
ER is the ratio of net price change to total path length over a window, bounded in [0, 1]. ER ≈ 1 means the price went straight from A to B (clean trend); ER ≈ 0 means the price wandered to the same place (noisy chop). The weighting collapses the ATR contribution from chop bars by half while keeping trending volatility intact. The trail therefore reacts to meaningful volatility rather than mechanical bar range.
Two extra adaptive layers sit on top of the effective ATR:
- A legacy multiplier that pushes the band slightly wider when ER drops, slightly tighter when ER rises.
- A TQI multiplier (covered next) that does the same but driven by the composite quality index.
These two factors compose multiplicatively on top of baseMult, the user’s nominal width.
2. Trend Quality Index (TQI) — Four Factors, One Number
TQI is a continuous score in [0, 1] computed every bar as the weighted average of four independent factors, each clamped into [0, 1]:
- Efficiency factor — current ER value clamped. High when the market is trending cleanly.
- Volatility regime — Z-score of volume against its 20-period mean (or, when volume is unavailable, the ratio of current ATR to a 100-period baseline). High when participation is meaningful.
- Structure factor — the deviation of the closing price from the centre of its N-bar high-low range, mapped to [0, 1]. High when price sits at one extreme of the recent range, low when it floats in the middle.
- Momentum persistence — the fraction of the last momLen bars whose individual change agrees in sign with the net change over the same window. High when the bars line up directionally, low when they zig-zag.
The four factors carry user-configurable weights (defaults 0.35 / 0.20 / 0.25 / 0.20) summed into a normalised TQI. Each factor measures something genuinely different about the market — the four together produce a composite read on “how trustworthy is the current trend”.
TQI is the engine that drives almost everything downstream: band width, asymmetry, the character-flip threshold and the dynamic TP scaling.
3. Asymmetric Bands
Classical SuperTrends use a single symmetric multiplier on both sides of price. This system separates the two sides:
- The active side (the one currently acting as a stop — below price in an uptrend, above price in a downtrend) tightens as TQI rises, by a factor 1 − asymStrength × TQI × 0.3.
- The passive side (the one waiting for a flip) widens as TQI rises, by a factor 1 + asymStrength × TQI × 0.4.
Both raw multipliers are then EMA-smoothed (alpha = 0.15) to avoid jumpy band recomputation on every TQI tick.
The combined effect is a ratchet with leverage: in a strong trend the trail hugs price closely (giving back less in pullbacks) while the contrarian band is pushed far away (so a one-bar fakeout cannot flip it). In chop the asymmetry collapses and both bands behave like a vanilla SuperTrend with a wider multiplier.
4. Character-Flip — Quality-Driven Reversal
Beyond the standard flip on price breaking the line, the system implements a second flip mechanism that fires when the trend’s quality collapses without a price break yet.
The condition is:
- TQI was high in the previous bar (above charFlipHighTqi, default 0.55).
- TQI is low in the current bar (below charFlipLowTqi, default 0.25).
- The current trend has been alive for at least charFlipMinAge bars (default 5).
- No price-flip already happened this bar.
When all four are true, the system flips the trend direction proactively and seeds the new trail at close ± passiveMult × atrEffective. This catches regime changes that happen by exhaustion rather than by clean price break — a long position that has been losing momentum across the last few bars exits before the late mechanical break.
The minimum-age guard prevents whipsaw: a freshly born trend cannot be character-flipped until it has had a chance to develop.
5. Signal Score — Six Components, 0 to ~100
When a flip fires, the system attaches a numeric score to the resulting BUY or SELL signal. The score sums six independent components, each mapped to a 0–17 range (one is 0–16):
- Momentum — the ratio of the 3-bar price change in the signal direction to the effective ATR.
- Efficiency — the current ER, mapped over [0.15, 0.7].
- Volume — the volume Z-score, mapped over [0, 3]; bypassed (constant 12) if volume is unavailable.
- RSI depth — how deeply RSI has visited oversold (for buys) or overbought (for sells) over the last rsiLookback bars.
- Structure — the distance from the entry to the last detected pivot of the same side, in ATRs (lower distance = higher score).
- Break depth — how far the previous bar’s close pierced the SuperTrend line that just flipped, normalised by ATR.
The maximum is around 102. A score above 70 typically corresponds to a high-conviction setup (clean trend, deep RSI, strong volume, close to structure); a score below 40 marks a late or weak signal. The number is shown next to the BUY/SELL label on the chart.
6. Dynamic R-Multiple Targets
Each signal ships with three take-profit levels in R-multiples (default 1R / 2R / 3R). With useDynTp = 1, the indicator scales those R values by a blend of TQI and volatility ratio:
finalScale = dynTpMinScale + rawScale × (dynTpMaxScale − dynTpMinScale)
where rawScale is the weighted average of min(1, max(0, TQI)) and min(1, max(0, (volRatio − 0.5) / 1.5)), with weights dynTpTqiW and dynTpVolW. With defaults this scales the R targets between 0.5× and 2× the nominal values.
After scaling, the three R values pass through a re-sort step that guarantees tp1 ≤ tp2 ≤ tp3 even if the floor/ceiling constraints have collapsed two of them. This uses the arithmetic identity mid = sum − min − max, which avoids any explicit sorting. Floors and ceilings (dynTpFloorR1 and dynTpCeilR3) prevent runaway values in extreme regimes.
7. Self-Calibration
When useAutoCalib = 1, the system uses the rolling history of closed signals to drift its own qualityStrength parameter. Every calibCooldown signals (default 5), once at least calibWindow signals (default 20) have closed, the average realised R of the last window is computed and:
- If avgR < calibBadR, the system applies a mean-reversion drift to effQStrength: it pushes it back towards the user-configured base (qualityStrength) by calibStepQ. This dampens the influence of TQI when recent results have been poor.
- If avgR > calibGoodR, the cooldown counter resets — recent results are good, hold parameters.
The drift is bounded by calibMinQ and calibMaxQ. The auto-calibration is conservative by design: it nudges, never replaces, and the base parameter remains the gravitational centre. The feature is opt-in (off by default) because a deterministic backtest is easier to interpret without an active feedback loop.
8. Realised R, Win Rate and the 3×3 Regime Grid
Every closed signal contributes to a stats engine that lives entirely in-memory:
- Realised R: computed assuming a 1/3 position scale at each TP touch. A full TP3 hit returns (tp1R + tp2R + tp3R) / 3. A stop hit returns the realised portion plus a −1R penalty on the unrealised portion. A timeout (after tradeMaxAge bars) returns just the realised portion.
- Rolling buffer: the last maxHistory = 50 realised Rs sit in a circular array indexed by writeIdx. Win-rate and average R over calibWindow are computed from this buffer.
- All-time stats: sum of R, cumulative R curve, peak/trough for drawdown, current and maximum win/loss streaks.
- 3×3 regime grid: each signal is classified into one of nine buckets formed by the cross of (ER bin, volRatio bin), each binned into Low / Mid / High. The grid stores an EWMA of realised R per bucket plus the count. The dashboard reports the current bucket’s edge so the user can see, at a glance, whether the system is performing well in the regime it’s currently operating in.
9. Dashboard
A fixed top-right dashboard renders ~20 rows summarising:
- Trend direction (with arrow)
- TQI value with traffic-light colouring (green > 0.6, yellow > 0.35, red below)
- Effective Q.Strength (which can differ from input when auto-calibration is on)
- ER-based regime label (Trending / Mixed / Choppy)
- Volume regime (Low / Normal / High)
- Live R targets and TP scaling factor
- Total signals, rolling win rate, rolling average R
- Window drawdown and all-time drawdown
- Current and maximum win/loss streaks
- Current regime cell’s edge (EWMA realised R) and sample count
The dashboard updates only on the last bar to keep the chart clean.
Key Features at a Glance
- Adaptive SuperTrend on efficiency-weighted ATR (Kaufman) — chop volatility counts half, trending volatility counts full
- Trend Quality Index (TQI) computed every bar from four independent factors with configurable weights
- Asymmetric bands — active side tightens, passive side widens, both proportional to TQI
- Character-flip — quality collapse triggers a reversal independently of price break, with minimum-age guard
- Six-component signal score (0 to ~100) attached to each BUY/SELL label
- Three R-multiple take-profits with optional dynamic scaling driven by TQI and volatility ratio
- Pivot-based stop loss with ATR safety floor (whichever is more conservative)
- Self-calibration of quality strength based on rolling realised R (opt-in)
- Rolling stats engine: buffer of 50 closed signals, win rate, average R, drawdown, streaks
- 3×3 regime grid (ER × volRatio) with per-bucket EWMA edge
- Live dashboard top-right with ~20 metrics
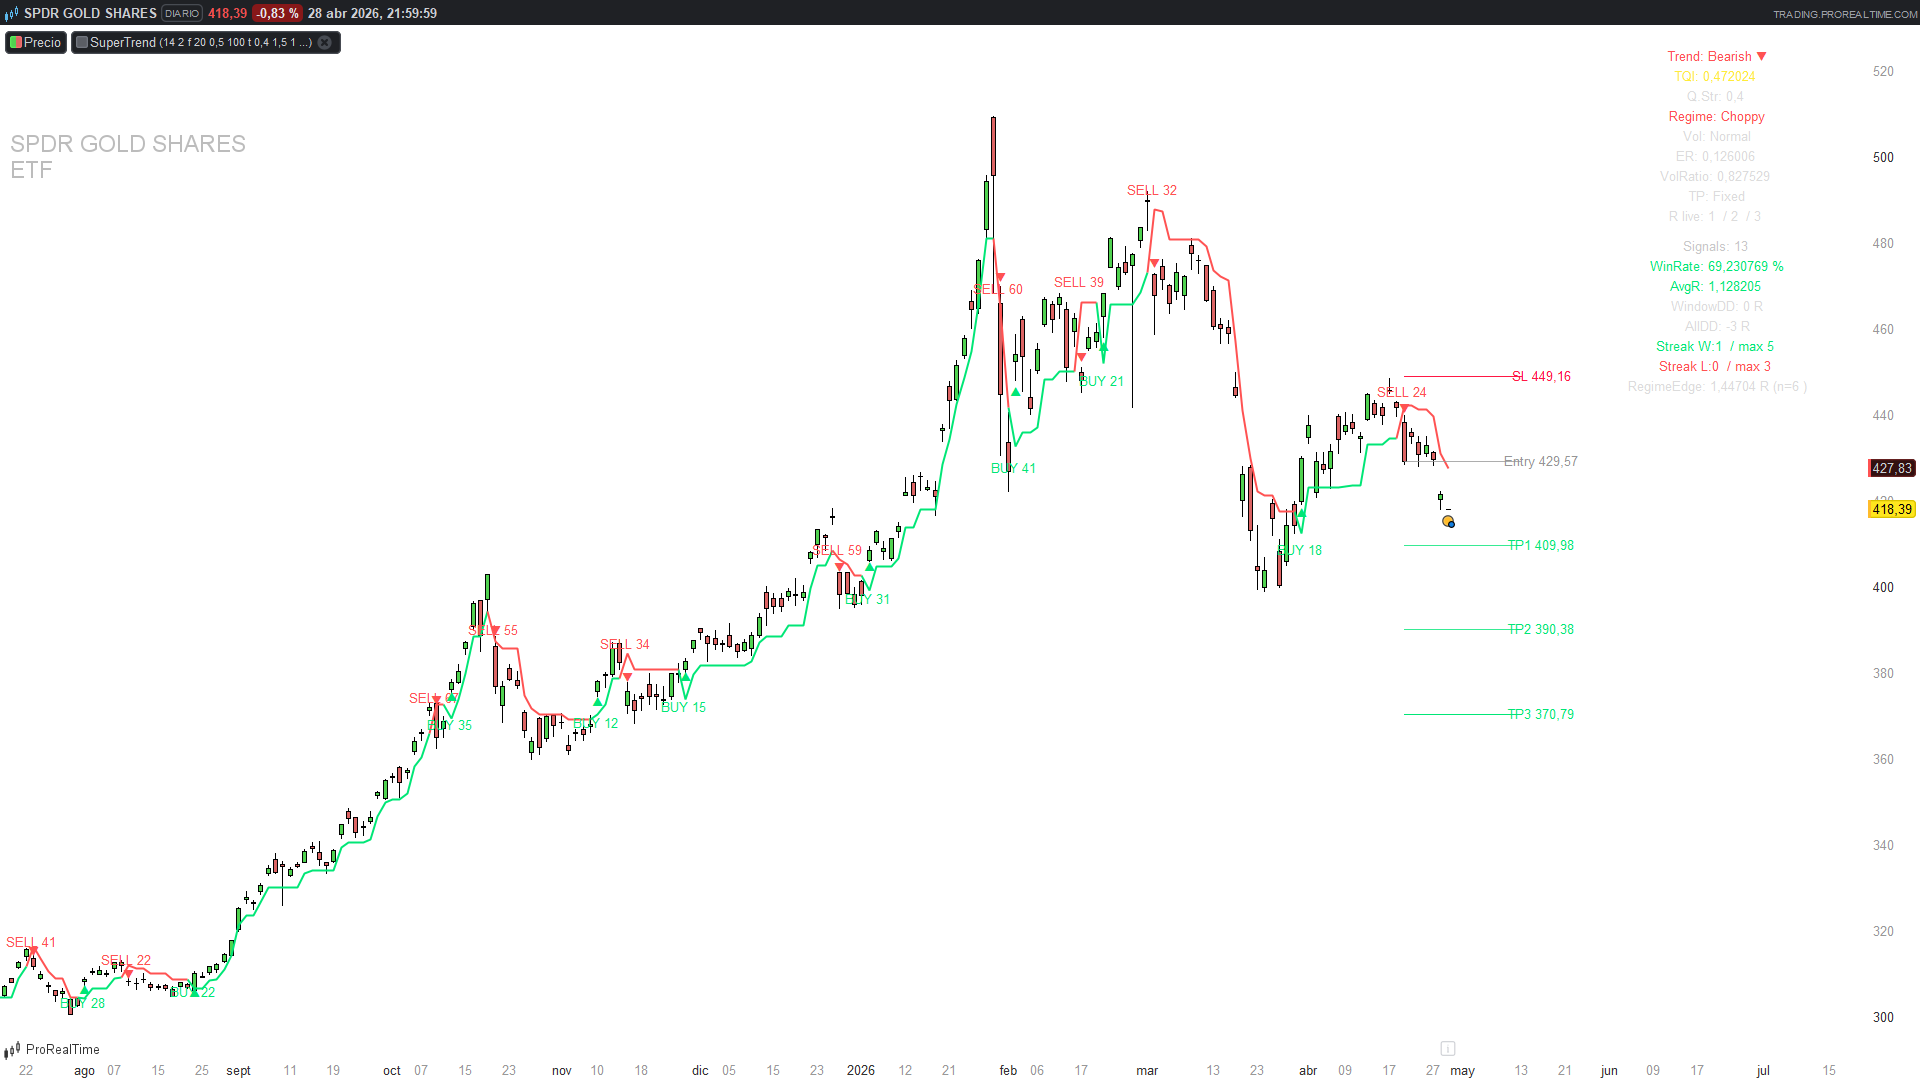
How to Read the Indicator
- The line on the chart is the SuperTrend, coloured green when bullish and red when bearish. Its slope is what matters — a steep, smooth slope indicates a strong, clean trend; a shallow or wobbly slope indicates a low-conviction trend that may flip soon.
- The arrows mark BUY (green ▲) or SELL (red ▼) signals at the bar where the trend flipped. Next to each arrow is the score (0–100). Treat scores above 70 as high conviction, between 40 and 70 as moderate, below 40 as marginal.
- The horizontal lines that appear on the right of the chart when a trade is open mark Entry, SL, TP1, TP2 and TP3. Each TP turns turquoise and acquires a ✓ once price has touched it. Lines disappear when the trade closes (TP3, SL or timeout).
- The dashboard in the top right is the meta-read on the system. The most informative single line is RegimeEdge: <X>R (n=<count>) — it tells you what the average realised R has been on signals fired in the same regime cell as the current bar. A negative edge in the current regime is a strong reason to skip the next signal even if the score is high.
- TQI and Q.Strength in the dashboard tell you how the system itself is currently parameterised. A TQI hovering above 0.6 means the engine sees a clean trend; below 0.35, it sees chop and the trail will widen.
Practical Applications
- Discretionary trend confirmation. The simplest use is to filter your existing entries: trade only in the direction of the SuperTrend line, only when TQI is above some threshold (e.g. 0.4) and only when the current regime cell has a positive EWMA edge. The dashboard makes all three checks visible at a glance.
- Score-based trade selection. If you take every signal of a single-multiplier SuperTrend mechanically, your sample will include a lot of low-quality flips in chop. Filtering by score (e.g. only trades with score > 60) is empirically a reasonable way to halve the trade count while keeping most of the cumulative R.
- Multi-timeframe pairing. Run the system on the daily for regime, on the hourly for entries. Trade the hourly direction only when the daily TQI is above 0.5 and the daily trend agrees. The character-flip on the daily often arrives early enough to flatten exposure before the hourly flips.
- Parameter calibration discovery. Even with useAutoCalib = 0, watching how effQStrength would drift across history (by enabling it offline) tells you whether the system’s base parameters need adjusting on a given asset. A persistent downward drift suggests the asset’s regime is more volatile than the defaults assume.
Indicator Configuration
The indicator exposes ~30 inputs grouped by section. The defaults work reasonably across most liquid instruments on H1 and above; below H1 the engine becomes computationally heavier and may need to be loaded with calculateonlastbars.
Main
- atrLen — ATR length (default 14)
- baseMult — base band width in ATRs (default 2.0)
Adaptive Engine
- useAdaptive — 1 = legacy ER-based adaptive multiplier on, 0 = off (default 1)
- erLen — Efficiency Ratio window (default 20)
- adaptStrength — strength of the legacy adaptive multiplier (default 0.5)
- atrBaselineLen — baseline window for volRatio (default 100)
- useEffAtr — 1 = use ER-weighted ATR, 0 = raw ATR (default 1)
Trend Quality Engine
- useTqi — 1 = TQI module on, 0 = collapse to symmetric vanilla SuperTrend (default 1)
- qualityStrength — strength of the TQI multiplier (default 0.4)
- qualityCurve — exponent on (1 − TQI) for non-linear response (default 1.5)
- multSmooth — 1 = EMA-smooth the active/passive multipliers (default 1)
- useAsymBands — 1 = enable asymmetric bands (default 1)
- asymStrength — magnitude of the asymmetry (default 0.5)
- useCharFlip — 1 = enable character-flip on quality collapse (default 1)
- charFlipMinAge — minimum bars in current trend before char-flip is allowed (default 5)
- charFlipHighTqi / charFlipLowTqi — TQI thresholds for the collapse trigger (defaults 0.55 / 0.25)
- wEr / wVol / wStruct / wMom — weights of the four TQI factors (defaults 0.35 / 0.20 / 0.25 / 0.20)
- structLen — window for the structure factor (default 20)
- momLen — window for momentum persistence (default 10)
Risk and TPs
- slAtrMult — ATR multiplier for the stop-loss safety floor (default 1.5)
- useDynTp — 0 = fixed R targets, 1 = scaled by TQI and volatility (default 0)
- tp1R / tp2R / tp3R — nominal R multiples (defaults 1 / 2 / 3)
- dynTpTqiW / dynTpVolW — weights of TQI and volRatio in the scaling blend (defaults 0.6 / 0.4)
- dynTpMinScale / dynTpMaxScale — scaling bounds (defaults 0.5 / 2.0)
- dynTpFloorR1 / dynTpCeilR3 — absolute floors and ceilings on the R values (defaults 0.5 / 8.0)
- labelOffsetBars — horizontal offset of the Entry/SL/TP price labels (default 10)
- tradeMaxAge — bars after which an open trade times out (default 100)
Self-Calibration
- useAutoCalib — 1 = enable auto-drift of qualityStrength (default 0)
- calibWindow — rolling window of closed signals used for the calibration (default 20)
- calibBadR / calibGoodR — thresholds for triggering a drift / resetting cooldown (defaults 0.0 / 0.7)
- calibStepQ — drift magnitude per calibration event (default 0.05)
- calibCooldown — minimum signals between two consecutive drifts (default 5)
- calibMinQ / calibMaxQ — bounds on effQStrength (defaults 0.1 / 0.9)
Score Components
- rsiLen — RSI length (default 14)
- rsiOB / rsiOS — RSI overbought / oversold thresholds (defaults 70 / 30)
- rsiLookback — window for the RSI depth measure (default 20)
- pivotLen — half-window for symmetric pivot detection (default 3)
- volLen — window for the volume Z-score (default 20)
- useVolScore / useRsiScore / useStructScore — toggles to bypass individual score components (defaults all 1)
Display
- showDash — 1 = show the top-right dashboard (default 1)
- showBands — reserved for future use, currently the SuperTrend line always shows when isWarm = 1
- showSignals — 1 = draw the BUY/SELL arrows and scores (default 1)
Code
//-------------------------------------------------------------
//PRC_Self-Aware Trend System [WillyAlgoTrader]
//version = 0
//21.04.2026
//Iván González @ www.prorealcode.com
//Sharing ProRealTime knowledge
//-------------------------------------------------------------
//defparam drawonlastbaronly=true
//==========================================================
// 1. INPUTS
//==========================================================
// --- Main ---
atrLen          = 14        // ATR length
baseMult        = 2.0       // base band width (xATR)
// --- Adaptive Engine (legacy ER) ---
useAdaptive     = 1         // 1=on
erLen           = 20        // efficiency window
adaptStrength   = 0.5
atrBaselineLen  = 100
// --- Trend Quality Engine ---
useTqi          = 1
qualityStrength = 0.4
qualityCurve    = 1.5
multSmooth      = 1         // EMA-smooth multipliers
useAsymBands    = 1
asymStrength    = 0.5
useEffAtr       = 1         // efficiency-weighted ATR
useCharFlip     = 1
charFlipMinAge  = 5
charFlipHighTqi = 0.55
charFlipLowTqi  = 0.25
wEr             = 0.35
wVol            = 0.20
wStruct         = 0.25
wMom            = 0.20
structLen       = 20
momLen          = 10
// --- Risk ---
slAtrMult       = 1.5
useDynTp        = 0         // 0=Fixed, 1=Dynamic
tp1R            = 1.0
tp2R            = 2.0
tp3R            = 3.0
// --- Dynamic TP ---
dynTpTqiW       = 0.6
dynTpVolW       = 0.4
dynTpMinScale   = 0.5
dynTpMaxScale   = 2.0
dynTpFloorR1    = 0.5
dynTpCeilR3     = 8.0
labelOffsetBars = 10
tradeMaxAge     = 100
// --- Self-learning ---
useAutoCalib    = 0
calibWindow     = 20
calibBadR       = 0.0
calibGoodR      = 0.7
calibStepQ      = 0.05
calibCooldown   = 5
calibMinQ       = 0.1
calibMaxQ       = 0.9
// --- Score (display) ---
rsiLen          = 14
rsiOB           = 70
rsiOS           = 30
rsiLookback     = 20
pivotLen        = 3
volLen          = 20
useVolScore     = 1
useRsiScore     = 1
useStructScore  = 1
showDash        = 1
showBands       = 1
showSignals     = 1

//==========================================================
// 2. CONSTANTS
//==========================================================
maxHistory     = 50        // rolling signal buffer size (reduced from 100 for PRT cost)
erLow          = 0.25
erHigh         = 0.50
volLow         = 0.7
volHigh        = 1.3
ewmaAlpha      = 0.2
multSmoothAlpha = 0.15

//==========================================================
// 3. WARMUP
//==========================================================
warmup = max(50, max(atrLen, max(erLen, max(rsiLen, max(volLen, max(structLen, momLen))))) + 10)
isWarm = barindex >= warmup

//==========================================================
// 4. BASE CALCULATIONS: ATR, ER, efficiency-weighted ATR
//==========================================================
rawAtr      = averagetruerange[atrLen](close)
atrBase     = average[atrBaselineLen](rawAtr)
if atrBase <= 0 then
   volRatio = 1.0
else
   volRatio = rawAtr / atrBase
endif

// Efficiency Ratio manual (Kaufman)
erChange    = abs(close - close[erLen])
erVolSum    = summation[erLen](abs(close - close[1]))
if erVolSum > 0 then
   erValue = erChange / erVolSum
else
   erValue = 0
endif

if useEffAtr = 1 then
   atrValue = rawAtr * (0.5 + 0.5 * erValue)
else
   atrValue = rawAtr
endif

//==========================================================
// 5. TREND QUALITY INDEX (TQI, 4 factors)
//==========================================================
// Factor 1: ER clamped
tqiEr = min(1.0, max(0.0, erValue))

// Factor 2: Volatility regime
// Z-score del volumen si hay; si no, mapeo sobre volRatio
hasVol = volume > 0
if hasVol then
   vMean = average[volLen](volume)
   vStd  = std[volLen](volume)
   if vStd > 0 then
      volZ = (volume - vMean) / vStd
   else
      volZ = 0
   endif
   // map [-1..2] to [0..1]
   tqiVolRaw = (volZ - (-1.0)) / 3.0
else
   volZ = 0
   // map volRatio [0.6..1.8] to [0..1]
   tqiVolRaw = (volRatio - 0.6) / 1.2
endif
tqiVol = min(1.0, max(0.0, tqiVolRaw))

// Factor 3: Structure (precio en el rango N-barras, desviación de 0.5)
sHi = highest[structLen](high)
sLo = lowest[structLen](low)
sRange = sHi - sLo
if sRange > 0 then
   pricePos = (close - sLo) / sRange
else
   pricePos = 0.5
endif
tqiStruct = min(1.0, max(0.0, abs(pricePos - 0.5) * 2.0))

// Factor 4: Momentum persistence — fracción de barras alineadas con el cambio N
aligned = 0
if barindex > momLen then
   winChg = close - close[momLen]
   for k = 0 to momLen - 1 do
      barChg = close[k] - close[k+1]
      if winChg > 0 and barChg > 0 then
         aligned = aligned + 1
      endif
      if winChg < 0 and barChg < 0 then
         aligned = aligned + 1
      endif
   next
endif
tqiMom = aligned / momLen

// Suma ponderada
wSum = wEr + wVol + wStruct + wMom
if wSum <= 0 then
   wSum = 1.0
endif
if useTqi = 1 then
   tqi = (tqiEr*wEr + tqiVol*wVol + tqiStruct*wStruct + tqiMom*wMom) / wSum
else
   tqi = 0.5
endif
tqi = min(1.0, max(0.0, tqi))

//==========================================================
// 6. ADAPTIVE MULTIPLIERS (active / passive)
//==========================================================
if useAdaptive = 1 then
   legacyAdapt = 1.0 + adaptStrength * (0.5 - erValue)
else
   legacyAdapt = 1.0
endif

// qualityStrength puede ser modificado por auto-calibración
once effQStrength = qualityStrength

if useTqi = 1 then
   qDev = 1.0 - tqi
   if qDev > 0 then
      qDevP = pow(qDev, qualityCurve)
   else
      qDevP = 0
   endif
else
   qDevP = 0.5
endif
tqiMult = 1.0 - effQStrength + effQStrength * (0.6 + 0.8 * qDevP)

symMult = baseMult * legacyAdapt * tqiMult

if useTqi = 1 and useAsymBands = 1 then
   asymTighten = 1.0 - asymStrength * tqi * 0.3
   asymWiden   = 1.0 + asymStrength * tqi * 0.4
   activeMultRaw  = symMult * asymTighten
   passiveMultRaw = symMult * asymWiden
else
   activeMultRaw  = symMult
   passiveMultRaw = symMult
endif

// EMA-smoothing de los multiplicadores
once activeMultSm  = activeMultRaw
once passiveMultSm = passiveMultRaw
if multSmooth = 1 then
   activeMultSm  = activeMultSm  * (1.0 - multSmoothAlpha) + activeMultRaw  * multSmoothAlpha
   passiveMultSm = passiveMultSm * (1.0 - multSmoothAlpha) + passiveMultRaw * multSmoothAlpha
else
   activeMultSm  = activeMultRaw
   passiveMultSm = passiveMultRaw
endif

//==========================================================
// 7. ADAPTIVE SUPERTREND (máquina de estado canónica PRT)
//==========================================================
// Patrón canónico (learning 003): una sola stLine que hace trailing + flip atómico.
// Se preserva el carácter asimétrico: lado activo (tighter) para el trail, lado pasivo (wider) al flipear.
once trendDir      = 1
once stLine        = close
once trendStartBar = 0

// prevTrend robusto en primeras barras
if barindex < 2 then
   prevTrend = 1
else
   prevTrend = trendDir[1]
endif

// Warmup guard: no operar máquina de estado hasta tener ATR válido.
// Durante el warmup stLine queda en su semilla (close de barindex=0) y trendDir = 1.
if barindex >= atrLen then
   // Bandas raw según la dirección previa
   if prevTrend = 1 then
      activeBandRaw = close - activeMultSm * atrValue   // lowerBand "tight"
      flipBandRaw   = close + passiveMultSm * atrValue  // upperBand "wide" tras flip
   else
      activeBandRaw = close + activeMultSm * atrValue   // upperBand "tight"
      flipBandRaw   = close - passiveMultSm * atrValue  // lowerBand "wide" tras flip
   endif

   // Primera barra post-warmup: re-inicializar stLine según dirección
   if barindex = atrLen then
      stLine   = activeBandRaw
      trendDir = 1
   else
      // Máquina de estado: trail + flip
      if prevTrend = 1 then
         // Alcista: stLine = lowerBand, sube (nunca baja)
         if activeBandRaw > stLine then
            stLine = activeBandRaw
         endif
         if close < stLine then
            trendDir = -1
            stLine   = flipBandRaw
         else
            trendDir = 1
         endif
      else
         // Bajista: stLine = upperBand, baja (nunca sube)
         if activeBandRaw < stLine then
            stLine = activeBandRaw
         endif
         if close > stLine then
            trendDir = 1
            stLine   = flipBandRaw
         else
            trendDir = -1
         endif
      endif
   endif
endif

// Character-flip (colapso de TQI fuerza inversión sobre la dirección PREVIA)
// Solo aplica si no hubo ya un price-flip en esta barra.
if barindex < 2 then
   prevTqi = 0.5
else
   prevTqi = tqi[1]
endif
trendAge = barindex - trendStartBar
priceFlipped = trendDir <> prevTrend

charBase = (useCharFlip = 1) and (useTqi = 1) and (prevTqi > charFlipHighTqi) and (tqi < charFlipLowTqi) and (trendAge >= charFlipMinAge)
if charBase and not priceFlipped then
   if prevTrend = 1 then
      trendDir = -1
      stLine   = close + passiveMultSm * atrValue
   else
      trendDir = 1
      stLine   = close - passiveMultSm * atrValue
   endif
endif

// Trend-start tracking
if trendDir <> prevTrend then
   trendStartBar = barindex
endif

flipUp = (trendDir =  1) and (prevTrend = -1)
flipDn = (trendDir = -1) and (prevTrend =  1)

//==========================================================
// 7.5 RSI + PIVOTS (para score de señales)
//==========================================================
rsiVal = rsi[rsiLen](close)

// Pivots high/low simétricos (ventana 2*pivotLen+1)
once lastPivotHigh = 0
once lastPivotLow  = 0
if barindex >= 2*pivotLen then
   if high[pivotLen] = highest[2*pivotLen+1](high) then
      lastPivotHigh = high[pivotLen]
   endif
   if low[pivotLen]  = lowest[2*pivotLen+1](low) then
      lastPivotLow  = low[pivotLen]
   endif
endif

//==========================================================
// 7.6 SIGNAL SCORE (6 componentes)
//==========================================================
bypassScore = 12.0

// Componente 1: momentum (mov en dirección contraria 3 barras previas)
dirMoveBuy  = close[3] - close
dirMoveSell = close - close[3]
if atrValue > 0 then
   momRatioBuy  = dirMoveBuy  / atrValue
   momRatioSell = dirMoveSell / atrValue
else
   momRatioBuy  = 0
   momRatioSell = 0
endif
// mapClamp(x, 0.3, 2.0, 0, 17) → t = (x-0.3)/1.7 clamp, * 17
tMomBuy      = min(1.0, max(0.0, (momRatioBuy  - 0.3) / 1.7))
tMomSell     = min(1.0, max(0.0, (momRatioSell - 0.3) / 1.7))
momScoreBuy  = tMomBuy  * 17.0
momScoreSell = tMomSell * 17.0

// Componente 2: efficiency ratio mapClamp(er, 0.15, 0.7, 0, 17)
tEr     = min(1.0, max(0.0, (erValue - 0.15) / 0.55))
erScore = tEr * 17.0

// Componente 3: volumen Z mapClamp(volZ, 0, 3, 0, 17) o bypass
if hasVol and (useVolScore = 1) then
   tVol   = min(1.0, max(0.0, volZ / 3.0))
   vScore = tVol * 17.0
else
   vScore = bypassScore
endif

// Componente 4: RSI depth
if useRsiScore = 1 then
   rsiWinLow  = lowest[rsiLookback](rsiVal)
   rsiWinHigh = highest[rsiLookback](rsiVal)
   rsiDepthBuy  = max(0.0, rsiOS - rsiWinLow)
   rsiDepthSell = max(0.0, rsiWinHigh - rsiOB)
   tRsiBuy      = min(1.0, max(0.0, rsiDepthBuy  / 15.0))
   tRsiSell     = min(1.0, max(0.0, rsiDepthSell / 15.0))
   rsiScoreBuy  = tRsiBuy  * 17.0
   rsiScoreSell = tRsiSell * 17.0
else
   rsiScoreBuy  = bypassScore
   rsiScoreSell = bypassScore
endif

// Componente 5: structure (distancia al último pivot)
if useStructScore = 1 then
   if lastPivotLow > 0 then
      pivDistBuy = abs(close - lastPivotLow)
   else
      pivDistBuy = 0
   endif
   if lastPivotHigh > 0 then
      pivDistSell = abs(lastPivotHigh - close)
   else
      pivDistSell = 0
   endif
   if atrValue > 0 then
      pivRatioBuy  = pivDistBuy  / atrValue
      pivRatioSell = pivDistSell / atrValue
   else
      pivRatioBuy  = 0
      pivRatioSell = 0
   endif
   // mapClampInv(x, 0, 1.5, 16, 6): desciende con x
   tStructBuy      = min(1.0, max(0.0, pivRatioBuy  / 1.5))
   tStructSell     = min(1.0, max(0.0, pivRatioSell / 1.5))
   structScoreBuy  = 16.0 - tStructBuy  * 10.0
   structScoreSell = 16.0 - tStructSell * 10.0
else
   structScoreBuy  = bypassScore
   structScoreSell = bypassScore
endif

// Componente 6: break depth (profundidad de rotura del SuperTrend previo)
breakDepthBuy  = max(0.0, stLine[1] - close[1])
breakDepthSell = max(0.0, close[1] - stLine[1])
if atrValue > 0 then
   breakRatioBuy  = breakDepthBuy  / atrValue
   breakRatioSell = breakDepthSell / atrValue
else
   breakRatioBuy  = 0
   breakRatioSell = 0
endif
tBrkBuy       = min(1.0, max(0.0, breakRatioBuy))
tBrkSell      = min(1.0, max(0.0, breakRatioSell))
breakScoreBuy  = tBrkBuy  * 16.0
breakScoreSell = tBrkSell * 16.0

// Suma (máx ~102)
buyScore  = momScoreBuy  + erScore + vScore + rsiScoreBuy  + structScoreBuy  + breakScoreBuy
sellScore = momScoreSell + erScore + vScore + rsiScoreSell + structScoreSell + breakScoreSell
buyScoreInt  = round(buyScore)
sellScoreInt = round(sellScore)

//==========================================================
// 8. DYNAMIC TP R-MULTIPLES (per-bar, for live signal use)
//==========================================================
// Scale por blend TQI + volRatio
tqiComp = min(1.0, max(0.0, tqi))
volComp01 = (volRatio - 0.5) / 1.5
volComp = min(1.0, max(0.0, volComp01))
wTpSum = dynTpTqiW + dynTpVolW
if wTpSum <= 0 then
   wTpSum = 1.0
endif
rawScale = (tqiComp * dynTpTqiW + volComp * dynTpVolW) / wTpSum
finalScale = dynTpMinScale + rawScale * (dynTpMaxScale - dynTpMinScale)

// TP base re-ordenados (garantizar tp1<tp2<tp3)
fixedTp1R = min(tp1R, min(tp2R, tp3R))
fixedTp3R = max(tp1R, max(tp2R, tp3R))
fixedTp2R = tp1R + tp2R + tp3R - fixedTp1R - fixedTp3R

if useDynTp = 1 then
   // Floors proporcionales
   tp1Floor = dynTpFloorR1
   if fixedTp1R > 0.01 then
      tp2Floor = dynTpFloorR1 * (fixedTp2R / fixedTp1R)
      tp3Floor = dynTpFloorR1 * (fixedTp3R / fixedTp1R)
   else
      tp2Floor = dynTpFloorR1
      tp3Floor = dynTpFloorR1
   endif
   effTp1R = min(dynTpCeilR3, max(tp1Floor, fixedTp1R * finalScale))
   effTp2R = min(dynTpCeilR3, max(tp2Floor, fixedTp2R * finalScale))
   effTp3R = min(dynTpCeilR3, max(tp3Floor, fixedTp3R * finalScale))
   // Re-sort tras scaling
   sTp1 = min(effTp1R, min(effTp2R, effTp3R))
   sTp3 = max(effTp1R, max(effTp2R, effTp3R))
   sTp2 = effTp1R + effTp2R + effTp3R - sTp1 - sTp3
   liveTp1R = sTp1
   liveTp2R = sTp2
   liveTp3R = sTp3
else
   liveTp1R = fixedTp1R
   liveTp2R = fixedTp2R
   liveTp3R = fixedTp3R
endif

//==========================================================
// 9. ACTIVE TRADE STATE (solo 1 señal viva a la vez)
//==========================================================
once tradeDir      = 0
once tradeClosed   = 1   // 1 = no hay trade vivo; se pone a 0 al abrir
once tradeEntryBar = 0
once tradeEntry    = 0
once tradeSl       = 0
once tradeTp1      = 0
once tradeTp2      = 0
once tradeTp3      = 0
once tradeTp1R     = 1.0
once tradeTp2R     = 2.0
once tradeTp3R     = 3.0
once hitTp1        = 0
once hitTp2        = 0
once hitTp3        = 0
once tradeCellIdx  = -1

confirmedBuy  = flipUp and isWarm
confirmedSell = flipDn and isWarm

if confirmedBuy then
   tEntry = close
   // SL basado en el último pivot low (réplica Pine): el más conservador entre pivot-SL y close-SL
   if lastPivotLow > 0 then
      slBase = lastPivotLow
   else
      slBase = low
   endif
   rawSl = slBase - slAtrMult * atrValue
   minSl = close  - slAtrMult * atrValue
   tSl   = min(rawSl, minSl)
   risk  = tEntry - tSl
   tradeDir      = 1
   tradeClosed   = 0
   tradeEntryBar = barindex
   tradeEntry    = tEntry
   tradeSl       = tSl
   tradeTp1      = tEntry + risk * liveTp1R
   tradeTp2      = tEntry + risk * liveTp2R
   tradeTp3      = tEntry + risk * liveTp3R
   tradeTp1R     = liveTp1R
   tradeTp2R     = liveTp2R
   tradeTp3R     = liveTp3R
   hitTp1        = 0
   hitTp2        = 0
   hitTp3        = 0
endif

if confirmedSell then
   tEntry = close
   // SL basado en el último pivot high (réplica Pine): el más conservador entre pivot-SL y close-SL
   if lastPivotHigh > 0 then
      slBase = lastPivotHigh
   else
      slBase = high
   endif
   rawSl = slBase + slAtrMult * atrValue
   minSl = close  + slAtrMult * atrValue
   tSl   = max(rawSl, minSl)
   risk  = tSl - tEntry
   tradeDir      = -1
   tradeClosed   = 0
   tradeEntryBar = barindex
   tradeEntry    = tEntry
   tradeSl       = tSl
   tradeTp1      = tEntry - risk * liveTp1R
   tradeTp2      = tEntry - risk * liveTp2R
   tradeTp3      = tEntry - risk * liveTp3R
   tradeTp1R     = liveTp1R
   tradeTp2R     = liveTp2R
   tradeTp3R     = liveTp3R
   hitTp1        = 0
   hitTp2        = 0
   hitTp3        = 0
endif

//==========================================================
// 10. HIT DETECTION + REALIZED R + LEARNING
//==========================================================
// Rolling buffer de últimas maxHistory señales cerradas (array $sigR)
once writeIdx = 0         // puntero rotante 0..maxHistory-1
once bufFilled = 0        // cuántos slots llenos (hasta maxHistory)
once winStreak = 0
once lossStreak = 0
once maxWinStreak = 0
once maxLossStreak = 0
once allCount = 0
once allRSum = 0
once allCumR = 0
once allPeak = 0
once allTrough = 0
once signalsSinceCalib = 0

// Regime grid (3×3): idx = erBin*3 + volBin
once gridC0 = 0
once gridC1 = 0
once gridC2 = 0
once gridC3 = 0
once gridC4 = 0
once gridC5 = 0
once gridC6 = 0
once gridC7 = 0
once gridC8 = 0
once gridE0 = 0
once gridE1 = 0
once gridE2 = 0
once gridE3 = 0
once gridE4 = 0
once gridE5 = 0
once gridE6 = 0
once gridE7 = 0
once gridE8 = 0

// Bin del regime actual (para clasificar la señal que se abre)
if erValue < erLow then
   curErBin = 0
elsif erValue < erHigh then
   curErBin = 1
else
   curErBin = 2
endif
if volRatio < volLow then
   curVolBin = 0
elsif volRatio < volHigh then
   curVolBin = 1
else
   curVolBin = 2
endif
curCell = curErBin * 3 + curVolBin

// Memorizar cell del trade cuando abre
if confirmedBuy or confirmedSell then
   tradeCellIdx = curCell
endif

if (tradeDir <> 0) and (tradeClosed = 0) and (barindex > tradeEntryBar) then
   if tradeDir = 1 then
      tp1Reached = high >= tradeTp1
      tp2Reached = high >= tradeTp2
      tp3Reached = high >= tradeTp3
      slHit      = low  <= tradeSl
   else
      tp1Reached = low <= tradeTp1
      tp2Reached = low <= tradeTp2
      tp3Reached = low <= tradeTp3
      slHit      = high >= tradeSl
   endif

   if tp1Reached and (hitTp1 = 0) then
      hitTp1 = 1
   endif
   if tp2Reached and (hitTp2 = 0) then
      hitTp2 = 1
   endif
   if tp3Reached and (hitTp3 = 0) then
      hitTp3 = 1
   endif

   tradeAge = barindex - tradeEntryBar
   timeoutHit = tradeAge >= tradeMaxAge

   if (hitTp3 = 1) or slHit or timeoutHit then
      // Calcular realized R (fórmula Pine: 1/3 por tramo)
      if hitTp3 = 1 then
         realizedR = (tradeTp1R + tradeTp2R + tradeTp3R) / 3.0
      elsif slHit then
         taken = 0
         remaining = 1.0
         if hitTp1 = 1 then
            taken = taken + (1.0/3.0) * tradeTp1R
            remaining = remaining - (1.0/3.0)
         endif
         if hitTp2 = 1 then
            taken = taken + (1.0/3.0) * tradeTp2R
            remaining = remaining - (1.0/3.0)
         endif
         realizedR = taken + remaining * (-1.0)
      else
         // timeout: solo suma los TPs tocados
         taken = 0
         if hitTp1 = 1 then
            taken = taken + (1.0/3.0) * tradeTp1R
         endif
         if hitTp2 = 1 then
            taken = taken + (1.0/3.0) * tradeTp2R
         endif
         if hitTp3 = 1 then
            taken = taken + (1.0/3.0) * tradeTp3R
         endif
         realizedR = taken
      endif
      // Clamp
      realizedR = max(-1.0, min(tradeTp3R, realizedR))

      // Push al buffer rotante
      $sigR[writeIdx] = realizedR
      writeIdx = writeIdx + 1
      if writeIdx >= maxHistory then
         writeIdx = 0
      endif
      if bufFilled < maxHistory then
         bufFilled = bufFilled + 1
      endif

      // Stats acumuladas
      allRSum = allRSum + realizedR
      allCount = allCount + 1
      allCumR = allCumR + realizedR
      if allCumR > allPeak then
         allPeak = allCumR
      endif
      curDD = allCumR - allPeak
      if curDD < allTrough then
         allTrough = curDD
      endif
      if realizedR > 0 then
         winStreak = winStreak + 1
         lossStreak = 0
         if winStreak > maxWinStreak then
            maxWinStreak = winStreak
         endif
      else
         lossStreak = lossStreak + 1
         winStreak = 0
         if lossStreak > maxLossStreak then
            maxLossStreak = lossStreak
         endif
      endif

      // Grid 3×3 EWMA update (despiadadamente manual por falta de arrays anidados)
      if tradeCellIdx = 0 then
         gridC0 = gridC0 + 1
         if gridC0 = 1 then
            gridE0 = realizedR
         else
            gridE0 = gridE0*(1-ewmaAlpha) + realizedR*ewmaAlpha
         endif
      endif
      if tradeCellIdx = 1 then
         gridC1 = gridC1 + 1
         if gridC1 = 1 then
            gridE1 = realizedR
         else
            gridE1 = gridE1*(1-ewmaAlpha) + realizedR*ewmaAlpha
         endif
      endif
      if tradeCellIdx = 2 then
         gridC2 = gridC2 + 1
         if gridC2 = 1 then
            gridE2 = realizedR
         else
            gridE2 = gridE2*(1-ewmaAlpha) + realizedR*ewmaAlpha
         endif
      endif
      if tradeCellIdx = 3 then
         gridC3 = gridC3 + 1
         if gridC3 = 1 then
            gridE3 = realizedR
         else
            gridE3 = gridE3*(1-ewmaAlpha) + realizedR*ewmaAlpha
         endif
      endif
      if tradeCellIdx = 4 then
         gridC4 = gridC4 + 1
         if gridC4 = 1 then
            gridE4 = realizedR
         else
            gridE4 = gridE4*(1-ewmaAlpha) + realizedR*ewmaAlpha
         endif
      endif
      if tradeCellIdx = 5 then
         gridC5 = gridC5 + 1
         if gridC5 = 1 then
            gridE5 = realizedR
         else
            gridE5 = gridE5*(1-ewmaAlpha) + realizedR*ewmaAlpha
         endif
      endif
      if tradeCellIdx = 6 then
         gridC6 = gridC6 + 1
         if gridC6 = 1 then
            gridE6 = realizedR
         else
            gridE6 = gridE6*(1-ewmaAlpha) + realizedR*ewmaAlpha
         endif
      endif
      if tradeCellIdx = 7 then
         gridC7 = gridC7 + 1
         if gridC7 = 1 then
            gridE7 = realizedR
         else
            gridE7 = gridE7*(1-ewmaAlpha) + realizedR*ewmaAlpha
         endif
      endif
      if tradeCellIdx = 8 then
         gridC8 = gridC8 + 1
         if gridC8 = 1 then
            gridE8 = realizedR
         else
            gridE8 = gridE8*(1-ewmaAlpha) + realizedR*ewmaAlpha
         endif
      endif

      // Auto-calibración (simplificación 1: determinista histórico)
      signalsSinceCalib = signalsSinceCalib + 1
      if (useAutoCalib = 1) and (bufFilled >= calibWindow) and (signalsSinceCalib >= calibCooldown) then
         // Avg R de los últimos calibWindow samples del buffer
         sumR = 0
         cnt  = 0
         n = calibWindow
         if n > bufFilled then
            n = bufFilled
         endif
         // lee hacia atrás desde writeIdx (que apunta al próximo slot libre)
         for k = 1 to n do
            idx = writeIdx - k
            if idx < 0 then
               idx = idx + maxHistory
            endif
            sumR = sumR + $sigR[idx]
            cnt = cnt + 1
         next
         if cnt > 0 then
            postAvgR = sumR / cnt
            if postAvgR < calibBadR then
               if effQStrength > qualityStrength then
                  drift = 0 - calibStepQ
               else
                  drift = calibStepQ
               endif
               effQStrength = min(calibMaxQ, max(calibMinQ, effQStrength + drift))
               signalsSinceCalib = 0
            elsif postAvgR > calibGoodR then
               signalsSinceCalib = 0
            endif
         endif
      endif

      // Cerrar trade: reset tradeDir para que las lineas TP/SL desaparezcan
      tradeClosed = 1
      tradeCellIdx = -1
      tradeDir = 0
   endif
endif

if useAutoCalib = 0 then
   effQStrength = qualityStrength
endif

//==========================================================
// 11. ROLLING STATS (win-rate, avg R, window DD)
// Solo se necesita el valor final para el dashboard → islastbarupdate
// (evita ~200K iteraciones en cargas de 10k+ barras que congelan PRT)
//==========================================================
once rollWinRate  = 0
once rollAvgR     = 0
once rollWindowDD = 0
if islastbarupdate then
   n = calibWindow
   if n > bufFilled then
      n = bufFilled
   endif
   sumR2 = 0
   wins = 0
   runR = 0
   minRun = 0
   for k = 1 to n do
      idx = writeIdx - k
      if idx < 0 then
         idx = idx + maxHistory
      endif
      rVal = $sigR[idx]
      sumR2 = sumR2 + rVal
      if rVal > 0 then
         wins = wins + 1
      endif
      runR = runR + rVal
      if runR < minRun then
         minRun = runR
      endif
   next
   if n > 0 then
      rollWinRate = wins / n
      rollAvgR    = sumR2 / n
   else
      rollWinRate = 0
      rollAvgR    = 0
   endif
   rollWindowDD = minRun
endif

//==========================================================
// 12. DRAW SIGNAL LABELS
//==========================================================
if showSignals = 1 then
   if confirmedBuy then
      // Flecha pegada al mínimo
      drawtext("▲", barindex, low - 0.15*rawAtr) coloured(0, 230, 118, 255)
      // Score junto a la flecha, debajo de stLine (que está debajo del precio en compra)
      drawtext("BUY #buyScoreInt#", barindex, stLine - 0.3*rawAtr) coloured(0, 230, 118, 255)
   endif
   if confirmedSell then
      // Flecha pegada al máximo
      drawtext("▼", barindex, high + 0.15*rawAtr) coloured(255, 82, 82, 255)
      // Score junto a la flecha, encima de stLine (que está encima del precio en venta)
      drawtext("SELL #sellScoreInt#", barindex, stLine + 0.3*rawAtr) coloured(255, 82, 82, 255)
   endif
endif

//==========================================================
// 13. DRAW TP/SL LINES + etiquetas de precio al final
//==========================================================
if tradeDir <> 0 and tradeClosed = 0 and islastbarupdate then
   xEnd   = barindex + labelOffsetBars
   xLabel = xEnd + 3
   // Redondeo a 2 decimales para texto (evita cola de floats feos)
   entryFmt = round(tradeEntry * 100) / 100
   slFmt    = round(tradeSl    * 100) / 100
   tp1Fmt   = round(tradeTp1   * 100) / 100
   tp2Fmt   = round(tradeTp2   * 100) / 100
   tp3Fmt   = round(tradeTp3   * 100) / 100

   // Entry
   drawsegment(tradeEntryBar, tradeEntry, xEnd, tradeEntry) coloured(150, 150, 150, 200)
   drawtext("Entry #entryFmt#", xLabel, tradeEntry) coloured(150, 150, 150, 255)
   // SL
   drawsegment(tradeEntryBar, tradeSl, xEnd, tradeSl) coloured(255, 23, 68, 255)
   drawtext("SL #slFmt#", xLabel, tradeSl) coloured(255, 23, 68, 255)
   // TPs (color distinto si ya tocado + marca ✓)
   if hitTp1 = 1 then
      drawsegment(tradeEntryBar, tradeTp1, xEnd, tradeTp1) coloured(64, 224, 208, 255)
      drawtext("TP1 #tp1Fmt# ✓", xLabel, tradeTp1) coloured(64, 224, 208, 255)
   else
      drawsegment(tradeEntryBar, tradeTp1, xEnd, tradeTp1) coloured(0, 230, 118, 200)
      drawtext("TP1 #tp1Fmt#", xLabel, tradeTp1) coloured(0, 230, 118, 255)
   endif
   if hitTp2 = 1 then
      drawsegment(tradeEntryBar, tradeTp2, xEnd, tradeTp2) coloured(64, 224, 208, 255)
      drawtext("TP2 #tp2Fmt# ✓", xLabel, tradeTp2) coloured(64, 224, 208, 255)
   else
      drawsegment(tradeEntryBar, tradeTp2, xEnd, tradeTp2) coloured(0, 230, 118, 200)
      drawtext("TP2 #tp2Fmt#", xLabel, tradeTp2) coloured(0, 230, 118, 255)
   endif
   if hitTp3 = 1 then
      drawsegment(tradeEntryBar, tradeTp3, xEnd, tradeTp3) coloured(64, 224, 208, 255)
      drawtext("TP3 #tp3Fmt# ✓", xLabel, tradeTp3) coloured(64, 224, 208, 255)
   else
      drawsegment(tradeEntryBar, tradeTp3, xEnd, tradeTp3) coloured(0, 230, 118, 255)
      drawtext("TP3 #tp3Fmt#", xLabel, tradeTp3) coloured(0, 230, 118, 255)
   endif
endif

//==========================================================
// 14. DASHBOARD (fixed top-right, anchor)
//==========================================================
if showDash = 1 and islastbarupdate then
   // Header
   drawtext("SATS  v1.9", -200, -10) anchor(topright, xshift, yshift) coloured(255,255,255,255)
   // Trend
   if trendDir = 1 then
      drawtext("Trend: Bullish ▲", -200, -30) anchor(topright, xshift, yshift) coloured(0, 230, 118, 255)
   else
      drawtext("Trend: Bearish ▼", -200, -30) anchor(topright, xshift, yshift) coloured(255, 82, 82, 255)
   endif
   // TQI
   if tqi > 0.6 then
      tqR = 0
      tqG = 230
      tqB = 118
   elsif tqi > 0.35 then
      tqR = 255
      tqG = 235
      tqB = 59
   else
      tqR = 255
      tqG = 82
      tqB = 82
   endif
   drawtext("TQI: #tqi#", -200, -50) anchor(topright, xshift, yshift) coloured(tqR, tqG, tqB, 255)
   // Q.Strength (efectivo, puede diferir del input por calibración)
   drawtext("Q.Str: #effQStrength#", -200, -70) anchor(topright, xshift, yshift) coloured(220,220,220,255)
   // Regime ER
   if erValue >= erHigh then
      drawtext("Regime: Trending", -200, -90) anchor(topright, xshift, yshift) coloured(0, 230, 118, 255)
   elsif erValue >= erLow then
      drawtext("Regime: Mixed", -200, -90) anchor(topright, xshift, yshift) coloured(255, 235, 59, 255)
   else
      drawtext("Regime: Choppy", -200, -90) anchor(topright, xshift, yshift) coloured(255, 82, 82, 255)
   endif
   // Vol regime
   if volRatio < volLow then
      drawtext("Vol: Low", -200, -110) anchor(topright, xshift, yshift) coloured(150,150,255,255)
   elsif volRatio < volHigh then
      drawtext("Vol: Normal", -200, -110) anchor(topright, xshift, yshift) coloured(220,220,220,255)
   else
      drawtext("Vol: High", -200, -110) anchor(topright, xshift, yshift) coloured(255, 180, 100, 255)
   endif
   drawtext("ER: #erValue#", -200, -130) anchor(topright, xshift, yshift) coloured(220,220,220,255)
   drawtext("VolRatio: #volRatio#", -200, -150) anchor(topright, xshift, yshift) coloured(220,220,220,255)
   // TP mode
   if useDynTp = 1 then
      drawtext("TP: Dynamic ×#finalScale#", -200, -170) anchor(topright, xshift, yshift) coloured(100,200,255,255)
   else
      drawtext("TP: Fixed", -200, -170) anchor(topright, xshift, yshift) coloured(220,220,220,255)
   endif
   drawtext("R live: #liveTp1R# / #liveTp2R# / #liveTp3R#", -200, -190) anchor(topright, xshift, yshift) coloured(220,220,220,255)
   // Stats
   drawtext("Signals: #bufFilled#", -200, -220) anchor(topright, xshift, yshift) coloured(200,200,200,255)
   if bufFilled >= 5 then
      if rollWinRate >= 0.5 then
         wrR = 0
         wrG = 230
         wrB = 118
      else
         wrR = 255
         wrG = 82
         wrB = 82
      endif
   else
      wrR = 150
      wrG = 150
      wrB = 150
   endif
   wrPct = rollWinRate * 100
   drawtext("WinRate: #wrPct#%", -200, -240) anchor(topright, xshift, yshift) coloured(wrR, wrG, wrB, 255)
   if bufFilled >= 5 then
      if rollAvgR > 0 then
         arR = 0
         arG = 230
         arB = 118
      else
         arR = 255
         arG = 82
         arB = 82
      endif
   else
      arR = 150
      arG = 150
      arB = 150
   endif
   drawtext("AvgR: #rollAvgR#", -200, -260) anchor(topright, xshift, yshift) coloured(arR, arG, arB, 255)
   drawtext("WindowDD: #rollWindowDD#R", -200, -280) anchor(topright, xshift, yshift) coloured(220,220,220,255)
   drawtext("AllDD: #allTrough#R", -200, -300) anchor(topright, xshift, yshift) coloured(220,220,220,255)
   drawtext("Streak W:#winStreak# / max #maxWinStreak#", -200, -320) anchor(topright, xshift, yshift) coloured(0,230,118,255)
   drawtext("Streak L:#lossStreak# / max #maxLossStreak#", -200, -340) anchor(topright, xshift, yshift) coloured(255,82,82,255)
   // Current regime edge (de la celda actual)
   if curCell = 0 then
      regC = gridC0
      regE = gridE0
   elsif curCell = 1 then
      regC = gridC1
      regE = gridE1
   elsif curCell = 2 then
      regC = gridC2
      regE = gridE2
   elsif curCell = 3 then
      regC = gridC3
      regE = gridE3
   elsif curCell = 4 then
      regC = gridC4
      regE = gridE4
   elsif curCell = 5 then
      regC = gridC5
      regE = gridE5
   elsif curCell = 6 then
      regC = gridC6
      regE = gridE6
   elsif curCell = 7 then
      regC = gridC7
      regE = gridE7
   else
      regC = gridC8
      regE = gridE8
   endif
   drawtext("RegimeEdge: #regE#R (n=#regC#)", -200, -360) anchor(topright, xshift, yshift) coloured(220,220,220,255)
endif

//==========================================================
// 15. PLOT: SuperTrend (patrón canónico PRT — ver PRC_Supertrend-TV)
//==========================================================
// UNA sola variable con coloured(r,g,b) dinámico. PRT pinta por tramos correctamente.
if trendDir = 1 then
   stR = 0
   stG = 230
   stB = 118
else
   stR = 255
   stG = 82
   stB = 82
endif

if isWarm then
   plotLine = stLine
else
   plotLine = undefined
endif

return plotLine coloured(stR, stG, stB) style(line, 2) as "SuperTrend"
