

Initial Balance Indicator V2.0
March 23, 2017, 9:26 AM
Indicators
29 Comments
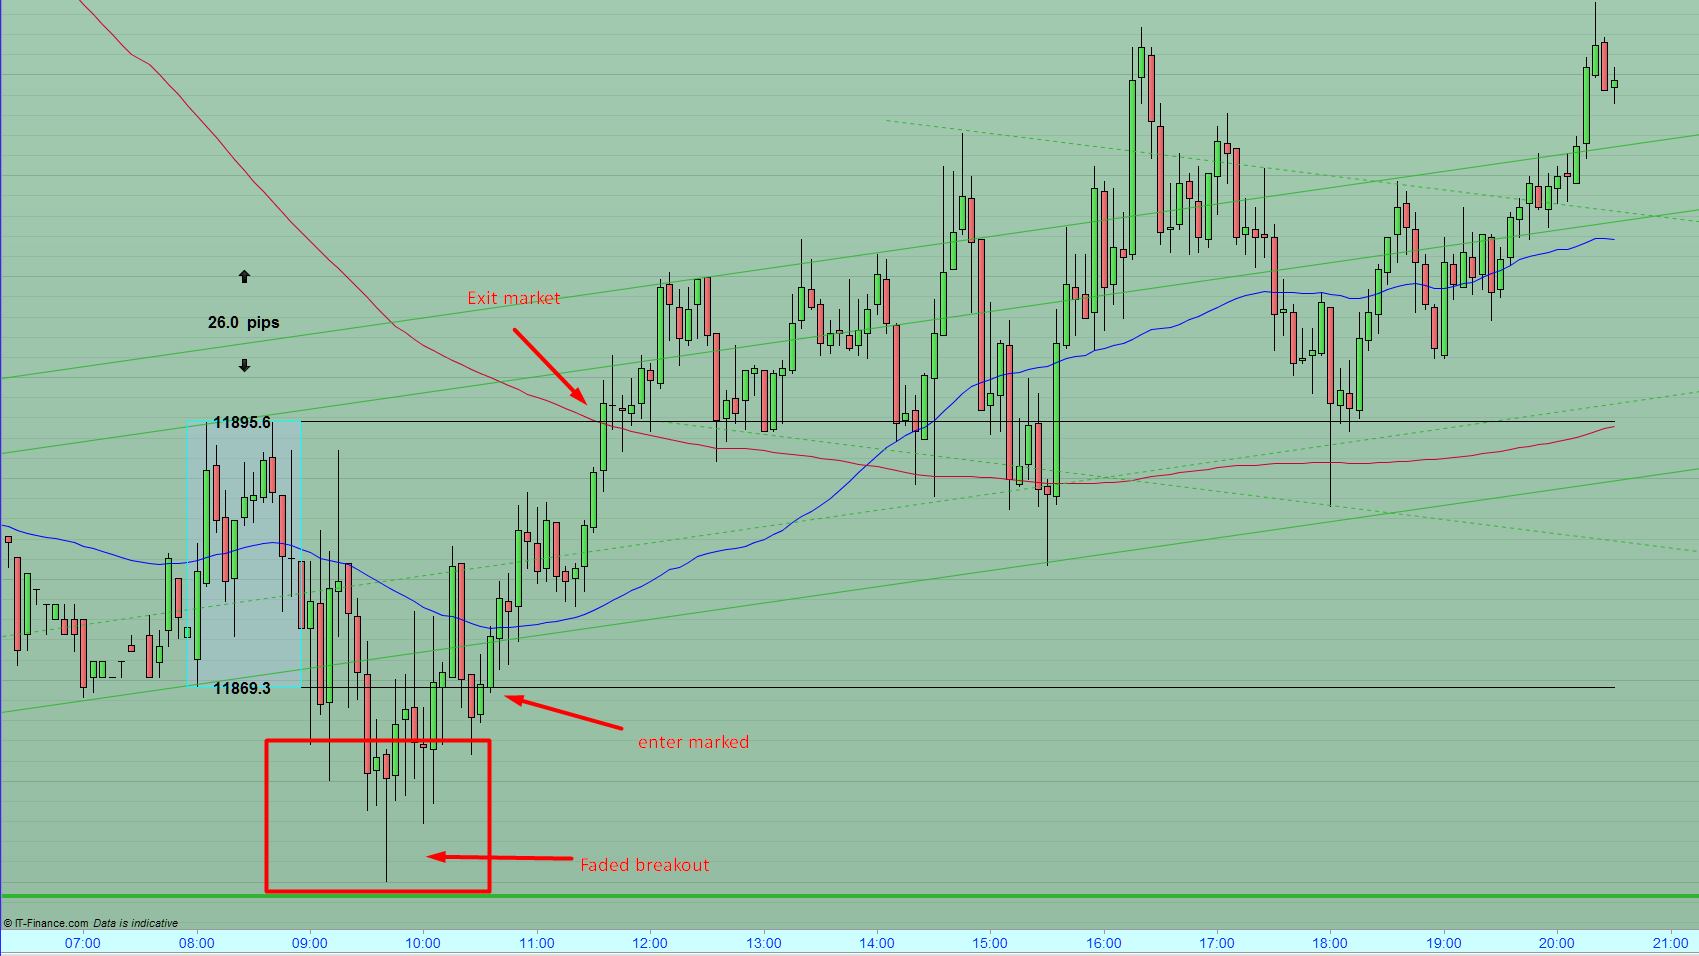
Here is an Initial Balance Indicator V2.0 on a 5 min DAX chart. It measures high and low between 08:00 and 09:00 GMT+1. The strategy is to trade the faded breakout. Enter at high or low and ride toward the opposite side. You need to do the research on the best pips and SL for the strategy on various Instruments, but around 25-40 pips works very good.
//===========================================================
//5 min Time frame
//Initial Ballance indicator v2.0
//First Hour in the morning form 8:00-9:00 GMT+1 on DAX
//Observe pips between 25-40, trade faded breakout to opposite High/Low
//Kasper Elsborg @Elsborgtrading
//===========================================================

defparam drawonlastbaronly = false
once upper=0
once lower=0

starttime = 080000
endtime = 090000

If Time = endtime then
 upper=highest[12](high)
 lower=lowest[12](low)
 dif=round(abs((lower-upper)*pipsize*pointvalue))
 //bars=barindex
 DRAWTEXT("#dif# pips", barindex-6, upper+10,SansSerif,bold, 16)
 DRAWARROWDOWN (barindex-6,upper+5)
 DRAWARROWup (barindex-6,upper+15)
 DRAWTEXT("#upper#", barindex-6, upper,SansSerif,bold, 16)
 DRAWTEXT("#lower#", barindex-6, lower,SansSerif,bold, 16)
endif
//if time >=080500 and Time <=090000 then
////backgroundcolor(0,255,255)
//DRAWRECTANGLE(barindex-6,upper,barindex-6,lower) COLOURED(0,255,0)
//endif
if time >=090500 and Time <=220000 then
 count=count+1
 DRAWsegment(barindex-count,upper,barindex,upper)coloured(0,0,0)
 DRAWsegment(barindex-count,lower,barindex,lower)coloured(0,0,0)
else
 count=0
endif

if intradaybarindex=0 then
 hh = 0
 ll = 0
 alreadydrawn = 0
endif

if time=starttime then
 startbar=barindex
endif

if time=endtime then
 endbar=barindex
endif

if time>=starttime and time<=endtime then
 if high>hh then
  hh = high
 endif
 if low<ll or ll=0 then
  ll = low
 endif
endif

if time>endtime and alreadydrawn=0 then
 drawrectangle(startbar,hh,endbar,ll) coloured(0,255,255)
 alreadydrawn=1
endif

RETURN
Download
Filename:
Screenshot_151.jpg
Downloads:
189
Download
Filename:
faded-breakout-indicator.png
Downloads:
213
Download
Filename:
Initial-Balance-indicator-2.0.itf
Downloads:
396
Veteran
Operating in the shadows, I hack problems one by one. My bio is currently encrypted by a complex algorithm. Decryption underway...
Author’s Profile
Loading...