

Indicator to support the strategy: "A based on 2RSI weekly strategy working on indexes".
August 3, 2023, 11:58 AM
Indicators
2 Comments
Please set up colors and lines as you prefere or as suggested in the pictures.
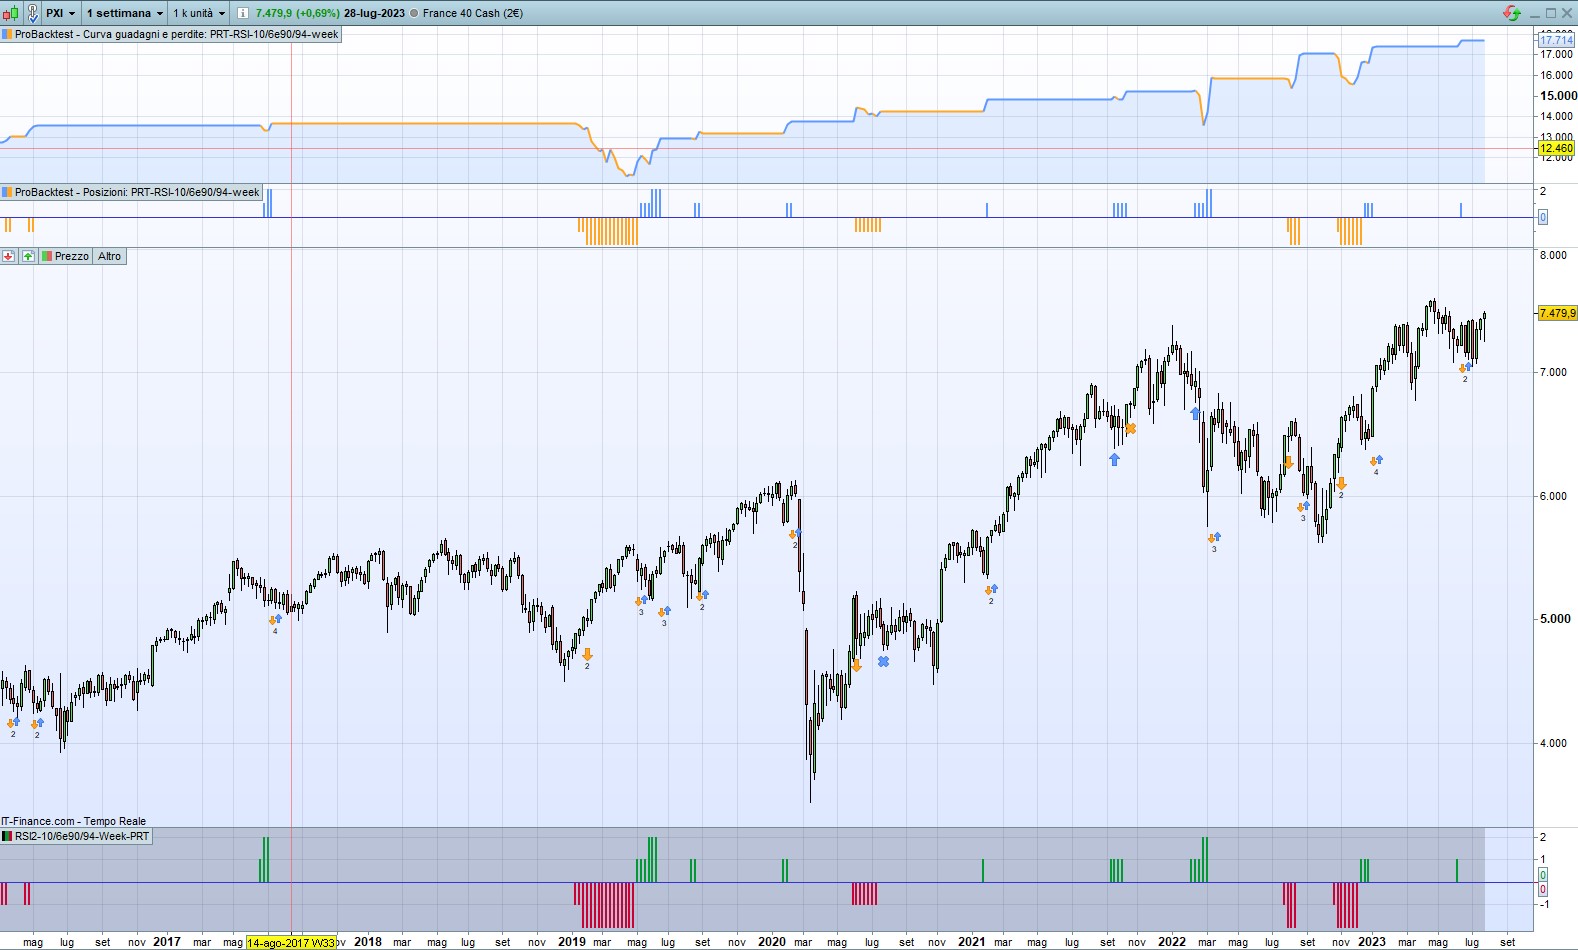
On a weekly chart, the indicator inform you if enter the market next week according to automatic strategy called “A based on 2RSI weekly strategy working on indexes” posted here.
The simulated performances of the automated strategy code, combined with the information of the indicator can support you in the decision if enter the market the next week. If you enter manually, it may be on monday or in a diferent eek day.
// 10/6e90/94 - Week setup - CONNORS

daysForbiddenEntry = OpenDayOfWeek = 0

// IND
MM = average[50](close)
indicator1 = Average[1](RSI[2](close))
indicator2 = Average[5](close)

ONCE posA = 0
ONCE posV = 0

// BUY 1
ca1 = close >MM
ca2 = indicator1<=10
ca3 = close<indicator2

IF posA = 0 and ca1 and ca2 and ca3 and not daysForbiddenEntry THEN
tradeprice1 = close
barencours = barindex
posA = 1
ENDIF

// BUY 2
IF posA = 1 and barindex - barencours>= 1 THEN
IF indicator1<=6 and not daysForbiddenEntry THEN
tradeprice2 = close
barencours = barindex
posA = 2
ENDIF
ENDIF

// EXIT LONG
IF posA>0 and indicator1>70 THEN
posA = 0
ENDIF

//SHORT 1
cv1 = close <MM
cv2 = indicator1>=90
cv3 = close>indicator2

IF posV = 0 and cv1 and cv2 and cv3 and not daysForbiddenEntry THEN
tradeprice1 = close
barencours = barindex
posV = -1
ENDIF

// SHORT 2
IF posV = -1 and barindex - barencours>= 1 THEN
IF indicator1>=94 and not daysForbiddenEntry THEN
tradeprice2 = close
barencours = barindex
posV = -2
ENDIF
ENDIF

// EXIT SHORT
IF posV<0 and indicator1<30 THEN
posV = 0
ENDIF

// RETURN
return posA as "BUY", posV as "SHORT"
Download
Filename:
2RSI-weekly-strategy.itf
Downloads:
56
Junior
Developer by day, aspiring writer by night. Still compiling my bio... Error 404: presentation not found.
Author’s Profile
Loading...