RVol Multi-Timeframes: Relative Volume at the Same Time of Day
Introduction
Raw volume is hard to judge on an intraday chart. A 5-minute bar with 200,000 shares is huge at lunchtime and ordinary at the open, because volume follows a daily profile: heavy at the open, quiet around midday, heavy again into the close. Comparing a bar with a plain moving average of the last N bars mixes all those moments together, so the opening bars always look “high” and the midday bars always look “low”.
RVol Multi-Timeframes answers the question that matters during the session: is today trading more or less than usual, at this point of the session? On intraday charts it compares the volume accumulated since the start of today’s session with the average volume that the previous sessions had accumulated by the same moment. A reading of 1.50 at 11:00 means “50% more volume than a normal session had traded by 11:00”.
On daily and higher timeframes it switches to the classic definition: bar volume divided by its own Wilder average. The columns are coloured in four levels, and a Wilder average of the RVol, which restarts at every session, shows whether participation is building or fading.
Theory Behind the Indicator
1. Cumulative volume against the same moment of previous sessions
On every intraday bar the indicator keeps track of two things:
- the cumulative volume of the current session, reset on the first bar of each session;
- the bar where each of the recent sessions started.
For each of the previous N sessions it looks for the last bar that had opened no later than the current moment of the session, and reads the cumulative volume that session had reached at that bar. The search is a binary search inside each session, so it stays fast even on 1-minute charts. The average of those N values is the reference:
RVol = cumulative volume of today / average cumulative volume of the last N sessions at the same moment
If one of the previous sessions had not traded yet at that moment, it contributes zero, but it still counts as one of the N sessions.
Because both sides of the ratio are cumulative, the reading gets steadier as the session goes on. In the first bars of the day a single large print moves it a lot; by midday it takes a sustained change in participation to move it.
2. “The same moment” is measured from the start of the session
The position of a bar inside its session is measured as the time elapsed since the first bar of that session, not as the time shown on the clock. The chart clock is the clock of your platform, and the exchange may switch to summer time on a different date: Europe and the US do so up to three weeks apart. Measuring from the session start keeps today’s open aligned with the open of the previous sessions during those weeks. It also handles sessions that run past midnight.
3. Daily and higher timeframes
A daily bar has no “time of day”, so there the ratio becomes bar volume divided by its Wilder average over N bars. An RVol of 2.0 on a daily chart means the day traded twice its recent average volume.
4. The Wilder line
The line is a Wilder moving average (smoothing factor 1/length) of the RVol itself. On intraday charts it restarts at every new session, seeded with the RVol of the last bar of the previous session, so each day’s line starts from where the previous day finished and then follows today’s participation. It is drawn in gold while rising and in purple while falling.
Key Features at a Glance
- Relative volume at the same moment of the session on intraday charts, classic relative volume on daily and higher.
- Four levels: low, moderate (from 1.2), high (from 1.5) and very high (from 2.0), each with its own column colour.
- Reference lines at 1.0 and at the three thresholds. They follow the thresholds when you change them.
- Wilder average of the RVol, restarting at every session and coloured by its slope.
- Optional dotted vertical line at the start of every session.
- Instruments without volume are handled safely: the indicator simply stays empty.
How to Read the Indicator
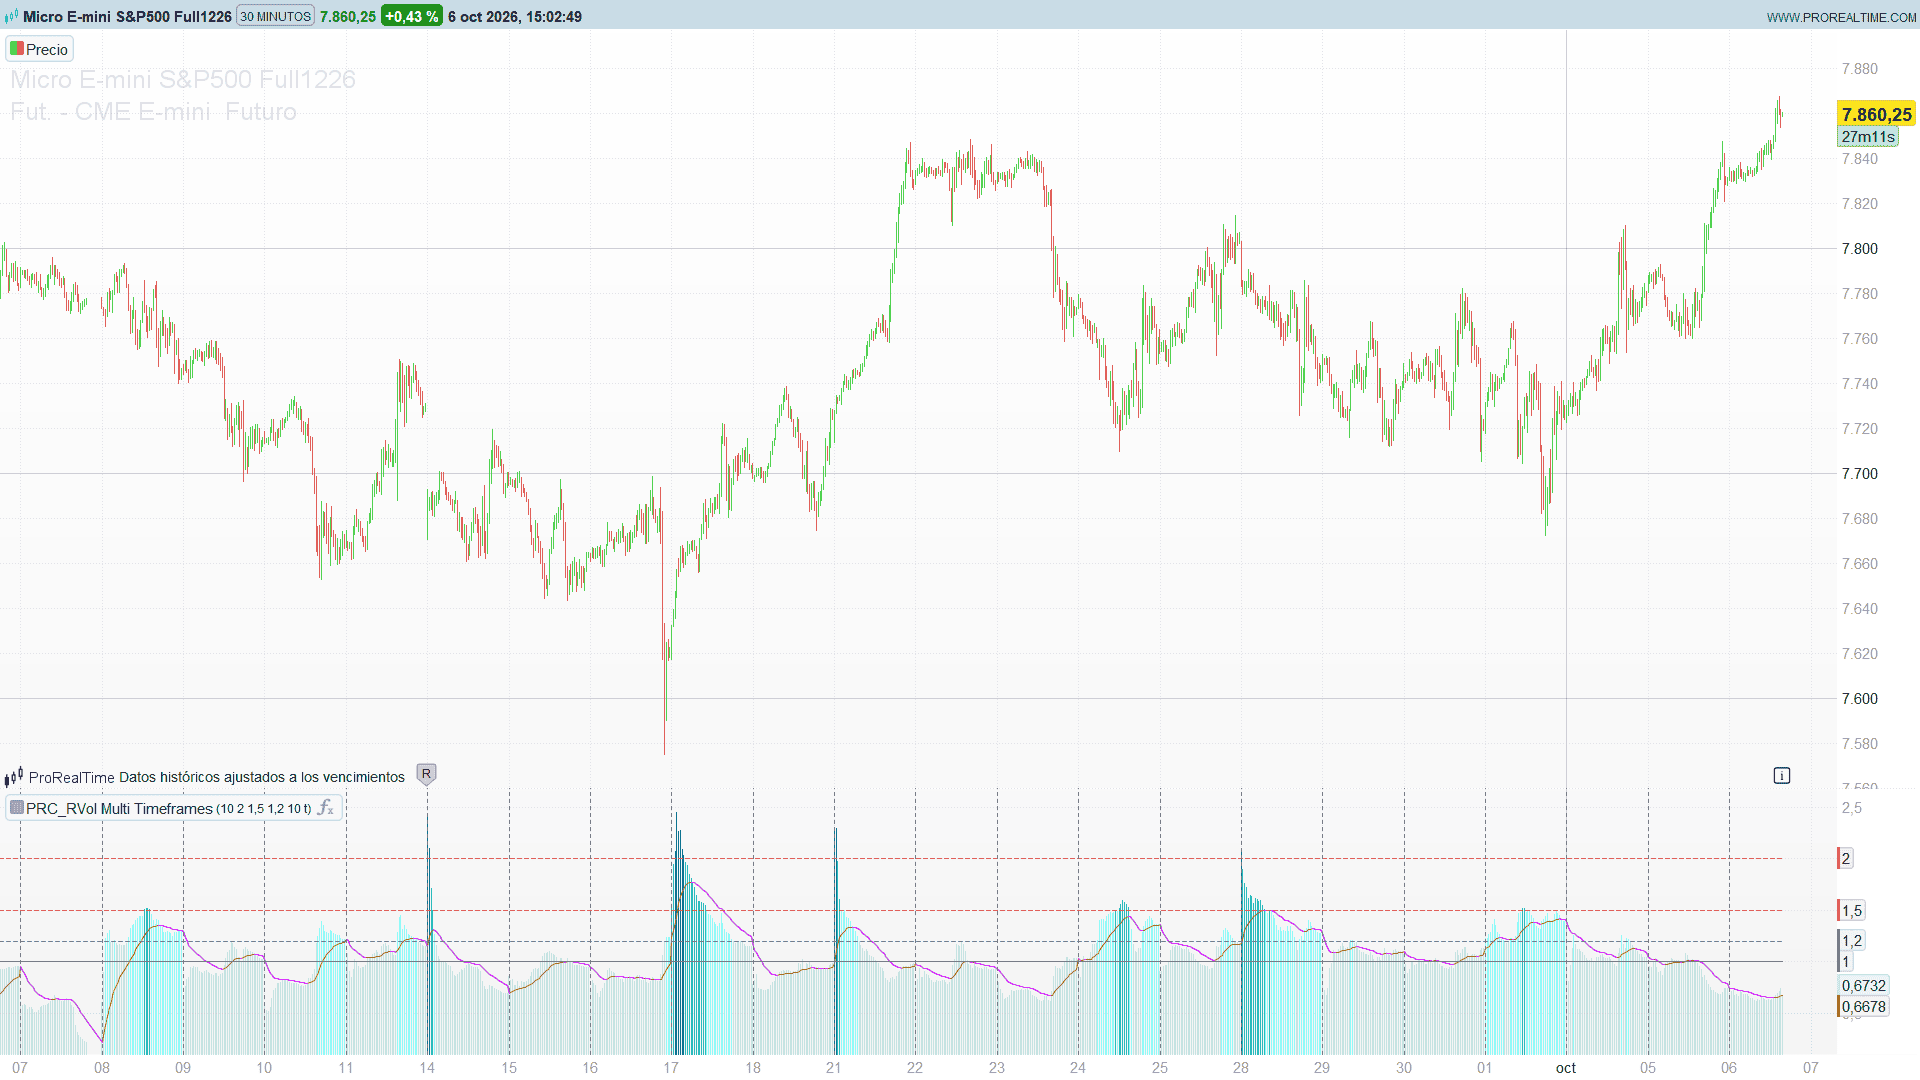
- Columns. Faint teal: below 1.2, ordinary or quiet participation. Light cyan: from 1.2 to 1.5, moderate. Solid teal: from 1.5 to 2.0, high. Dark teal: 2.0 and above, very high.
- Line at 1.0. The neutral level: today is trading exactly like an average session at this point.
- Wilder line. Rising (gold) means participation is accelerating compared with a normal session; falling (purple) means it is fading, even while the columns are still above 1.
- The first bars of the session. Early in the session the ratio rests on very few bars, so one big opening print can push it far above 2. Give it a few bars before drawing conclusions, or rely on the line.
- Cumulative, not bar by bar. On intraday charts a column tells you how the whole session compares so far, not how the current bar compares. A strong morning keeps the reading high in a quiet afternoon; the slope of the Wilder line is what shows the change.
Practical Applications
- Confirming breakouts. A range break with RVol above 1.5 and a rising line has real participation behind it. The same break with RVol below 1 is trading on thin volume and deserves less trust.
- Following the opening drive. When RVol is very high from the open and stays there through the first hour, the market is trading the day with conviction. When it drifts back towards 1 by mid-morning, the opening move is losing support.
- Discounting quiet-hour moves. A price spike around midday with RVol below 1 happens with fewer participants than usual.
- Daily charts. On daily bars the columns flag the sessions with unusual participation (results, news, index events) at a glance.
Indicator Configuration
All parameters sit at the top of the code. Declare them as variables to change them from the indicator settings:
- nDays (default: 10): previous sessions in the average (bars on daily and higher).
- thresVeryHigh (default: 2.0): RVol from which a column is very high.
- thresHigh (default: 1.5): RVol from which a column is high.
- thresModerate (default: 1.2): RVol from which a column is moderate.
- wilderLength (default: 10): length of the Wilder average of the RVol.
- showSessions (default: 1): 1 draws a dotted vertical line at every new session, 0 hides it.
History needed. On intraday charts the indicator needs nDays complete sessions before it shows anything; the session at the left edge of the chart is usually incomplete and is not used. With the default of 10 that is about 1,100 bars on a 5-minute chart of a European stock, about 4,300 bars on a 1-minute chart of a US stock and around 15,000 bars on a 1-minute chart of a 24-hour future. Load enough bars, or lower nDays.
Two cases to keep in mind:
- On futures the trading day on the chart starts at midnight, so there the session start is always the midnight bar. In the weeks when the exchange and your platform are on different summer time, the reference sessions are then one hour apart.
- If a session is missing its very first bar (an illiquid stock with no trade at the open), that session is measured from its first real bar and stays slightly out of step until it leaves the N-session window.
Code
//--------------------------------------------
// PRC_RVol Multi-Timeframes (Relative Volume Multi-Levels)
// version = 0
// 06.10.2026
// Ivan Gonzalez @ www.prorealcode.com
// Sharing ProRealTime knowledge
//--------------------------------------------
// Intraday charts: cumulative volume of the current session
// divided by the average cumulative volume reached at the
// SAME TIME of the previous N sessions.
// Daily and higher: bar volume divided by its Wilder average.
// Columns are coloured by level; the line is a Wilder average
// of the RVol that restarts at every new session.
//--------------------------------------------

//=== INPUTS (declare as Variables in the editor) ===
nDays         = 10    // Previous sessions (or bars on daily+) in the average
thresVeryHigh = 2.0   // Very high volume threshold
thresHigh     = 1.5   // High volume threshold
thresModerate = 1.2   // Moderate volume threshold
wilderLength  = 10    // Length of the Wilder average of the RVol
showSessions  = 1     // 1 = dotted vertical line at every new session

nRef = max(1, round(nDays))
wLen = max(1, round(wilderLength))
alphaW = 1 / wLen

// Instruments that do not report volume return undefined, not zero.
// Any comparison with undefined is false, so vol stays at 0 there.
vol = 0
IF volume >= 0 THEN
   vol = volume
ENDIF

isIntraday = 0
IF 86400 > gettimeframe THEN
   isIntraday = 1
ENDIF

//=== NEW SESSION ===
// On daily and higher every bar is a new day. On intraday charts the
// partial session at the left edge of the chart is not used as a
// reference: counting starts at the first complete session.
newDay = 0
IF isIntraday = 0 OR intradaybarindex = 0 THEN
   newDay = 1
ENDIF

// Seconds elapsed since the first bar of the session.
// The platform clock is not the exchange clock: on stocks and cash
// indices, comparing sessions by elapsed time keeps them aligned when
// the exchange and the platform change to summer time on different
// dates. It also handles sessions that cross midnight.
hh = floor(opentime / 10000)
mm = floor(opentime / 100) - hh * 100
ss = opentime - floor(opentime / 100) * 100
todSec = hh * 3600 + mm * 60 + ss

IF newDay = 1 THEN
   startSec = todSec
ENDIF
elapsed = todSec - startSec
IF 0 > elapsed THEN
   elapsed = elapsed + 86400
ENDIF

//=== CUMULATIVE SESSION VOLUME + SESSION START BARS ===
// The index comes from a scalar, so writing the same slot on every
// tick of the first bar is harmless (arrays are not rewound between
// ticks, scalars are).
IF isIntraday = 1 AND newDay = 1 THEN
   dayCount = dayCount + 1
   $dayStart[dayCount] = barindex
   cVol = 0
   IF showSessions = 1 THEN
      DRAWVLINE(barindex) COLOURED(120, 123, 134) STYLE(dottedline)
   ENDIF
ENDIF
cVol = cVol + vol

//=== RELATIVE VOLUME ===
rVol = 0
rVolOK = 0

IF isIntraday = 1 THEN
   // Average of the cumulative volume reached, in each of the previous
   // nRef sessions, by the last bar that opened no later than the
   // current one (binary search inside each session).
   aVol = 0
   IF dayCount >= nRef + 1 THEN
      FOR k = dayCount - nRef TO dayCount - 1 DO
         b1 = $dayStart[k]
         b2 = $dayStart[k + 1]
         lo = b1 - 1
         hi = b2
         WHILE hi > lo + 1 DO
            mi = lo + floor((hi - lo) / 2)
            IF elapsed[barindex - mi] > elapsed THEN
               hi = mi
            ELSE
               lo = mi
            ENDIF
         WEND
         // lo below b1: that session had not traded yet at this time
         IF lo >= b1 THEN
            aVol = aVol + cVol[barindex - lo] / nRef
         ENDIF
      NEXT
   ENDIF
   IF aVol > 0 THEN
      rVol = cVol / aVol
      rVolOK = 1
   ENDIF
ELSE
   avgVol = average[nRef, 3](vol)
   IF barindex >= nRef - 1 AND avgVol > 0 THEN
      rVol = vol / avgVol
      rVolOK = 1
   ENDIF
ENDIF

//=== WILDER AVERAGE OF THE RVOL ===
// Saved on the first bar of every session: RVol of the last bar of
// the previous session, used to restart the average.
IF newDay = 1 THEN
   lastPrev = rVol[1]
   lastPrevOK = rVolOK[1]
ENDIF

IF lastPrevOK = 1 THEN
   seed = lastPrev
   seedOK = 1
ELSE
   seed = rVol
   seedOK = rVolOK
ENDIF

isReset = 0
IF barindex = 0 OR (isIntraday = 1 AND newDay = 1) THEN
   isReset = 1
ENDIF

IF isReset = 1 OR wOK[1] = 0 THEN
   wRVol = seed
   wOK = seedOK
ELSIF rVolOK = 1 THEN
   wRVol = alphaW * rVol + (1 - alphaW) * wRVol[1]
   wOK = 1
ELSE
   wRVol = 0
   wOK = 0
ENDIF

//=== COLOURS ===
// Columns by level
IF rVol >= thresVeryHigh THEN
   cR = 0
   cG = 121
   cB = 135
   cA = 255
ELSIF rVol >= thresHigh THEN
   cR = 32
   cG = 187
   cB = 184
   cA = 255
ELSIF rVol >= thresModerate THEN
   cR = 0
   cG = 255
   cB = 251
   cA = 105
ELSE
   cR = 38
   cG = 166
   cB = 164
   cA = 59
ENDIF
IF rVolOK = 0 THEN
   cA = 0
ENDIF

// Line by slope
IF wRVol >= wRVol[1] THEN
   mR = 176
   mG = 110
   mB = 0
ELSE
   mR = 212
   mG = 0
   mB = 255
ENDIF
// Hidden while undefined and on the first defined bar, so that no
// segment is drawn up from zero
mA = 255
IF wOK = 0 OR wOK[1] = 0 THEN
   mA = 0
ENDIF

RETURN rVol COLOURED(cR, cG, cB, cA) STYLE(histogram) AS "RVol", wRVol COLOURED(mR, mG, mB, mA) STYLE(line, 1) AS "Wilder RVol", 1 COLOURED(120, 123, 134) STYLE(line, 1) AS "Neutral", thresModerate COLOURED(113, 128, 150) STYLE(dottedline, 1) AS "Moderate", thresHigh COLOURED(234, 88, 12) STYLE(dottedline, 1) AS "High", thresVeryHigh COLOURED(242, 54, 69) STYLE(dottedline, 1) AS "Very high"
Conclusion
On an intraday chart, relative volume only tells you something when it is compared at the same moment of the session. RVol Multi-Timeframes makes that comparison, grades it in four levels and adds a Wilder line that restarts every session, so you can see at a glance whether today’s participation is building or fading.