

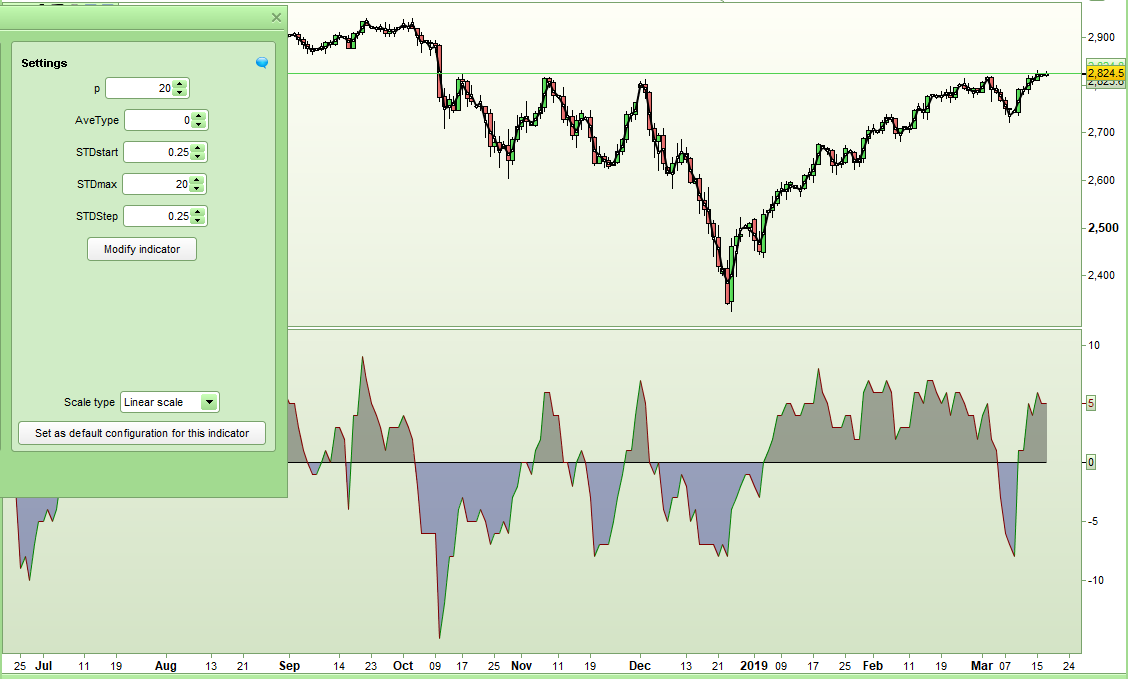
Force Indicator
This indicator counts the number of standard deviations price is above or below an average of price.
Discussion regarding this indicator can be found here:
https://www.prorealcode.com/topic/higher-timeframes-bollinger-filter/#post-93803
Thanks to Jebus89 for the original concept which I then recoded so as to allow different levels of standard deviation to be used in the indicator.
The following variables can be adjusted to alter the output.
- p = The period used for the average.
- AveType = The type of average used. Values from 0 to 6 as follows:0 = SMA1 = EMA
2 = WMA
3 = Wilder
4 = Triangular
5 = End point
6 = Time series
- STDstart = The first STD of average to be used.
- STDmax = The maximum STD of average to be used.
- STDstep = Step levels of STD used.
So for example if STDstart = 1 and STDmax = 3 and STDstep = 0.5 then 1.0, 1.5, 2.0, 2.5 and 3.0 STD multiples will be used as well as -1.0, -1.5, -2.0, -2.5 and -3.0 for the indicator output.
The line is red if Force is falling and green if Force is rising. A Force reading above zero indicates how far price has moved above the average and a Force reading below zero how far price has moved below the average.
Jebus89’s original idea was to use this indicator on higher time frames as a filter to check how far from the mean a price has moved to help evaluate whether it is a good time to enter the market on lower time frames but it can also be used in many other ways.
I recommend downloading and importing the ITF file to get full functionality.
// Force indicator
// Concept by jebus89 / Coding by Vonasi
// 18 March 2019


p = 20
AveType = 0 //0 to 6
STDstart = 0.1
STDmax = 10
STDstep = 0.1

if close > Average[p, AveType](close) then
 a = STDstart
 force = 0
 while a <= STDmax
  if close > Average[p, AveType](close) + a*std[p](close) then
   force = force + 1
   a = a + STDstep
  else
   break
  endif
 wend
endif

if close < Average[p, AveType](close) then
 a = -STDstart
 force = 0
 while a >= -STDmax
  if close < Average[p, AveType](close) + a*std[p](close) then
   force = force - 1
   a = a - STDstep
  else
   break
  endif
 wend
endif

r = 128
g = 0
if force > force[1] then
 r = 0
 g = 128
endif

return 0 coloured(0,0,0), force coloured(r,g,0) as "Force!"